Categories
Leisure

Walthamstow Reservoirs

walt1

The Walthamstow Reservoirs are a true London secret, a huge area of lakes, trees and paths, which is publically accessible but largely unknown. The only people you are likely to meet in it are anglers and birdwatchers, both groups that thrive in a quiet environment and so I’m sure would rather the secret remained! But the area covers a huge part of central(ish) London and deserves to be known by more. There are plans mooted to open it up although nothing concrete. I took a trip into the reserve on Sunday, to have a look around.

Anyone can get in to the reserve, which is generally open during daylight hours (e.g. 8am to 5pm from October to March). There is only one public entrance, which is opposite the Ferry Boat Inn, on Ferry Lane, the road which runs across the Lea Valley, between Tottenham and Walthamstow. Tottenham Hale station is about a five minute walk away. The complex is owned by Thames Water, who enforce a permit system. On entering, go to the shack immediately on the right, fill out a pink form and hand it over to the warden there, along with £1. You’ll get half of the slip back, which acts as your permit.

You then pass through a narrow passage underneath the London Overground “GOBLIN” route, past a decaying Victorian pumping station – with some attractive lampholders attached to it – and then to various paths radiating out from this point into the reserve.

walt3

At the far end there is The Coppermill, a historic building which used to, as the name implies, mill copper into coins. These days it is used as part of the reservoir operations.

walt2

View all my photos from the Walthamstow Reservoirs here.

Categories
London

Pan-London London Traffic Flows Map

traffic2

[Updated] As an update to the London Cycling Census map that I mentioned in the last post, here is a map based on similar data collected by the Department of Transport during 2012. The map covers the whole of London, over 3000 datapoints – in fact the underlying data is available for the major road network across Great Britain.

My earlier work was based on the Transport for London cycle census which was carried out in April this year, covering around 170 locations in central London only, mainly the major road network plus some cycle-specific routes. The DfT dataset is older, and is major roads only, but by covering the whole of London, it puts cycling (and the other modes of transport covered) in context.

By default, the map shows cyclists vs buses vs lorries. You can change any of the three colours to show cars, but these are generally very large values so the arrows for cars tend to dominate the map. Zooming in may improve clarity when this happens.

Looking across London, for initial set of just bikes, buses and lorries, it is striking to see how closely the lorries follow just the trunk road network. Bicycles also dominate the centre of the city, their levels dropping dramatically between inner and outer London.

The work is an output produced while working on the EUNOIA project. It is one of the datasets that the project will use, when calibrating a MATSim-based travel demand model of London, to check that the numbers in the model roughly match those seen in this dataset.

View the visualisation here.
The data comes from here.

[Update: I produced a major update to the map in January 2017 – it now includes data from 2000-2015, includes data on some minor roads, removes the arrows (as they don’t reveal much, for full-day counts), and allows a comparison between years instead of between modes. The data table has also been replaced with an interactive graph.]

Categories
Notes

The Tottenham Hale Gyratory

The Tottenham Hale Gyratory is a road structure I know well – I pass through it regularly. It’s actually made up of two gyratories: a large one around Seven Sisters, and a small one around Tottenham Hale itself, connected like a “flywheel”:

th2012
The “feeder” roads, all two-way, are shown in black. The one-way roads of the gyratory are shown in red, with an additional bonus couple of circles in green for the unfortunate buses visiting the bus station beside Tottenham Hale station. Having made it out of the main gyratories, they still have to “loop the loop”.

There are lots of problems with the design. Being a one-way gyratory, it pushes lots of traffic, from different origins and destinations, together. Traffic tends to hurtle along the single-way roads at speed. As such, it has always been an intimidating obstacle for both pedestrians and cyclists.

For example, people getting from the houses in the middle of the larger gyratory, to the northmost shopping area, or the station, have to cross a very strange road, where the traffic appears to be going on the wrong side of the road. What’s actually happening is this is where the two gyratories meet – or rather are only a couple of metres apart. As such, it is a confusing and unpleasant place if you aren’t in a car.

Recently, TfL has been working on replacing the gyratories with a more conventional layout. Last weekend, they made their main switch – completely removing the smaller gyratory, and making much of the larger one two-way. The remaining one-way section will also go two-way soon. The swirly bus station has also disappeared, and will reappear as only one circle, early next year. This is what it looks like now (including the soon-to-emerge bus station):

th2014

As you can imagine, the change has not gone down entirely smoothly:

thtweets

Plenty of cars have ended up heading along Hale Road, to find no connection with Ferry Lane, resulting in U-turns galore and extreme congestion. Others, coming southwards from Watermead Way or High Road, are still aiming for Broad Lane – the resulting left/right manoeuvre making the congestion still worse.

I’ll not mention the seperate cycle network that mirrored the smaller gyratory and half the larger one, which has been completely dug up in the last week…

Posted partly to commemorate the passing of the twin gyratories of Tottenham Hale but mainly as an excuse to draw the diagram.

Categories
Data Graphics London

Mapping London’s Cycling Census Dataset

londontraffic

The London Cycling Census Map is an interactive map I’ve created, showing traffic flows on key corridors in central London. The counts were collected by Transport for London in around 170 locations, in April. TfL released some sample statistics from the dataset in a report published on their website, but the original dataset was not released – however Andrew Gilligan, the Greater London Authority’s cycling commissioner, obtained the data and forward it on to a number of people, including (indirectly) me. I took the data, consolidated it, and created this map. The most tedious bit was pointing the arrows in the right direction!

There are three time periods for which you can show data: AM Peak (7am to 10am), PM Peak (4pm to 7pm) and All Day (which is, I believe, a 24-hour sample.) which is from 6am to 8pm. The locations chosen are generally ones where high numbers of cyclists travel, so some roads which have high numbers of other vehicles, but not bicycles, e.g. Oxford Street, are not included.

Cycling along key corridors in London is highly time dependent – in the below extract, morning (red) and evening (green) flows for cyclists are compared. Cyclists generally travel away from Clerkenwell, to the east and the west, in the morning, returning to it in the evening. The other travel modes generally don’t show this directionality on this road – cars in particular generally travel in both directions during both peaks. I would hypothesis that the cyclists are accessing this road from Goswell Road, which unfortunately wasn’t included in the census.

london_ampm

So what does the data show?

  • There are several roads where there are more bikes on the streets than any other type of vehicles.
  • Bicycle flow is highly direction, unlike that for most other forms of transport.
  • There are certain routes which are popular with certain kinds of traffic. There are four main east/west corridors in central London. Cars dominate the north-most (Euston Road) and the south-most (Victoria Embankment) ones. Taxis heavily use Holborn, while cyclists mainly use Old Street/Theobald’s Road. You can see all four of these corridors in the map extract at the top of this article.
  • Equivalent north-south links show little separation of vehicle types.
  • Elephant & Castle remains a complicated junction with large numbers of cyclists and buses, depending on the direction, road and time of day.

A note on the arrows

The map uses the vector styling capabilities of OpenLayers, with a custom SVG “arrow” symbol. Symbols in OpenLayers are always positioned with their centre over the location point, so to have them pointing away from the location, I had to add a hidden stalk to each arrow – you can see the stalk when clicking on it. My custom SVG for the arrows is:


OpenLayers.Renderer.symbol.arrow = [1, 0, 0, -3, -1, 0, 0, -0.5, 0, 3, 0, -0.5];

I’m using 0, 0 as the point on the arrow that corresponds to the underlying location – but it doesn’t need to be that, i.e. the location of 0, 0 does not affect where OpenLayer actually pins your symbol on your point location.

And finally…

Red arrows are taxis, blue arrows are buses. Proof, perhaps, of the oft-quoted saying that it’s a battle to find a London taxi driver willing to go south of the river:

londontaxis

The map was created as an output of EUNOIA, a European Union funded project to model travel mobility in major European cities using novel datasets. UCL CASA is the UK university partner for the project.

You can view the map here.
View alternative version of the map – uses OpenCycleMap as a basemap.
Download the data here which I have augmented with bearings.

Categories
Cycling

London’s Cycling Revolution

cyclerevmap

Above is part of a graphic created to highlight the dramatic changes in London’s non-casual cycling population. It is a map showing the proportion of people that travel to work by bicycle (compared to the overall population that travels to work) – each of London’s 620-odd wards being coloured by the resulting value, that comes from the 2011 census. QGIS was used to produce the map, the colour ramp used is a “fire” one, with the highest values corresponding to “white hot” colours, then cooling through orange and red for lower values. Yellow dots show the current (pre-December 2013) extent of the Barclays Cycle Hire system, which is revealingly at odds with where the cyclists actually are.

As a keen cyclist myself, it’s fascinating seeing how Hackney is “lit up” in the map, and also how barriers such as the North Circular Road and the Lea Valley act, apparently both physically and psychologically, to stop cyclists commuting across them. Outwith these constraints, traditionally affluent south-west London boroughs have combined with “hipster central” new-wealth north-east boroughs of Hackney and Islington to create an “axis of cycle commuting” across the capital city. The northern parts of Tower Hamlets, and the eastern parts of Camden, are also starting to turn red, as the Hackney cycling cultural influence slowly spreads. Herne Hill stands out in south London as being a popular cycling location, perhaps inspired by the legacy of the Herne Hill Velodrome (from the 1948 Olympics) living on. Highgate is also another hotspot. Perhaps people commute down its famous steep hills to work in central London, and then take the bike back home on the train?

The full graphic also includes a table listing the top 100 areas (wards) for the main measure. The numbers on the map correspond to the top 20 wards in this table – striking to see how many of them are in Hackney borough. The data came from the UK Census 2011 ward-aggregated data releases made earlier this year by the Official of National Statistics.

You can see the full graphic here which includes a number of “headline numbers” I haven’t mentioned here. I’ve listed the 100 wards from the graphic’s table below for convenience.

The “Total Num” is the population (aged 16-74) that travels to work, so not including those that work from home, are students, or don’t work. “Num by bicycle” is the subset of this population that use a bicycle as their primary means of commuting to work.

Rank Ward Borough Total Num Num by bicycle % by bicycle
1 Clissold Hackney 5988 1226 20.5%
2 Stoke Newington Central Hackney 6269 1274 20.3%
3 Queensbridge Hackney 6154 1235 20.1%
4 Dalston Hackney 7199 1395 19.4%
5 Hackney Downs Hackney 5636 1040 18.5%
6 Hackney Central Hackney 5663 993 17.5%
7 Victoria Hackney 5702 955 16.8%
8 Leabridge Hackney 5946 991 16.7%
9 Wick Hackney 4540 695 15.3%
10 Chatham Hackney 5445 829 15.2%
11 De Beauvoir Hackney 6765 1009 14.9%
12 Lordship Hackney 4620 675 14.6%
13 Mildmay Islington 5968 830 13.9%
14 King’s Park Hackney 3910 542 13.9%
15 Highbury East Islington 5765 795 13.8%
16 Highgate Camden 4538 607 13.4%
17 Bethnal Green North Tower Hamlets 6027 805 13.4%
18 Cazenove Hackney 5221 689 13.2%
19 Herne Hill Lambeth 7751 1017 13.1%
20 Haggerston Hackney 6564 837 12.8%
21 Weavers Tower Hamlets 6087 776 12.8%
22 St George’s Islington 5751 703 12.2%
23 Cantelowes Camden 5127 615 12.0%
24 Kentish Town Camden 6385 744 11.7%
25 Bow West Tower Hamlets 5863 671 11.4%
26 Village Southwark 5608 635 11.3%
27 Brownswood Hackney 5889 660 11.2%
28 Palace Riverside Hammersmith and Fulham 3285 357 10.9%
29 Hoxton Hackney 6844 737 10.8%
30 Highbury West Islington 8127 871 10.7%
31 Brunswick Park Southwark 5977 637 10.7%
32 Brixton Hill Lambeth 8544 910 10.7%
33 The Lane Southwark 7025 740 10.5%
34 Barnsbury Islington 5771 600 10.4%
35 St Peter’s Islington 5799 601 10.4%
36 St Mary’s Park Wandsworth 8833 913 10.3%
37 Wandsworth Common Wandsworth 7133 726 10.2%
38 Tollington Islington 6239 628 10.1%
39 Tulse Hill Lambeth 7544 757 10.0%
40 Junction Islington 5567 558 10.0%
41 Vassall Lambeth 6700 660 9.9%
42 Camden Town with Primrose Hill Camden 5546 543 9.8%
43 Bow East Tower Hamlets 7244 707 9.8%
44 Stroud Green Haringey 6252 609 9.7%
45 Gospel Oak Camden 4540 442 9.7%
46 Peckham Rye Southwark 6669 642 9.6%
47 Shaftesbury Wandsworth 8703 837 9.6%
48 Mortlake and Barnes Common Richmond upon Thames 5159 495 9.6%
49 East Dulwich Southwark 6536 624 9.6%
50 Oval Lambeth 8270 789 9.5%
51 Northcote Wandsworth 8532 811 9.5%
52 Canonbury Islington 5704 541 9.5%
53 St Mary’s Islington 5967 563 9.4%
54 Clapham Common Lambeth 7380 695 9.4%
55 Prince’s Lambeth 6938 650 9.4%
56 Askew Hammersmith and Fulham 7020 656 9.3%
57 Thamesfield Wandsworth 8505 791 9.3%
58 South Camberwell Southwark 5982 553 9.2%
59 Holloway Islington 6869 633 9.2%
60 Munster Hammersmith and Fulham 5953 548 9.2%
61 Mile End and Globe Town Tower Hamlets 5856 537 9.2%
62 East Sheen Richmond upon Thames 4425 404 9.1%
63 Ravenscourt Park Hammersmith and Fulham 4917 448 9.1%
64 Clapham Town Lambeth 7986 724 9.1%
65 Queenstown Wandsworth 8944 810 9.1%
66 Newington Southwark 6546 589 9.0%
67 Nightingale Wandsworth 8062 721 8.9%
68 Stockwell Lambeth 7367 658 8.9%
69 Barnes Richmond upon Thames 4146 370 8.9%
70 Ham, Petersham and Richmond Riverside Richmond upon Thames 4195 373 8.9%
71 Thurlow Park Lambeth 6497 574 8.8%
72 Clerkenwell Islington 5188 455 8.8%
73 Caledonian Islington 5935 518 8.7%
74 Finsbury Park Islington 6373 548 8.6%
75 Crouch End Haringey 6647 567 8.5%
76 Fulham Reach Hammersmith and Fulham 5892 497 8.4%
77 Thornton Lambeth 6235 525 8.4%
78 Balham Wandsworth 8660 729 8.4%
79 Fulham Broadway Hammersmith and Fulham 5583 469 8.4%
80 Hillrise Islington 5077 426 8.4%
81 Ferndale Lambeth 8868 744 8.4%
82 Larkhall Lambeth 9197 771 8.4%
83 Shepherd’s Bush Green Hammersmith and Fulham 6244 521 8.3%
84 Sands End Hammersmith and Fulham 5947 489 8.2%
85 Coldharbour Lambeth 7267 597 8.2%
86 Colville Kensington and Chelsea 3896 318 8.2%
87 Addison Hammersmith and Fulham 6154 500 8.1%
88 Fairfield Wandsworth 9123 741 8.1%
89 Bethnal Green South Tower Hamlets 5471 443 8.1%
90 Notting Barns Kensington and Chelsea 3657 294 8.0%
91 Streatham Hill Lambeth 7180 577 8.0%
92 Chiswick Riverside Hounslow 5428 433 8.0%
93 Tudor Kingston upon Thames 4128 329 8.0%
94 Hammersmith Broadway Hammersmith and Fulham 5574 444 8.0%
95 Camberwell Green Southwark 6471 513 7.9%
96 Queens Park Brent 7598 600 7.9%
97 Haverstock Camden 4900 386 7.9%
98 Spitalfields and Banglatown Tower Hamlets 4619 362 7.8%
99 West Putney Wandsworth 6772 527 7.8%
100 Fulwell and Hampton Hill Richmond upon Thames 4747 369 7.8%

The graphic was produced in association with Mediarun and Bolt Burdon Kemp.

Categories
Data Graphics Geodemographics London

Data Windows

datawindows
Our 10×10 artwork for 2013.

This is a data visualisation artwork created by Dr Cheshire (@spatialanalysis) and myself. We were invited to submit an entry to 10X10 Drawing the City London, run by the building design charity Article 25. The submissions, including various from “real” artists and architects, will then be auctioned in November to raise funds for the charity’s projects.

Our technological, cartographical and geographical skills are almost certainly better than our artistic ability, so we decided to let technology create our artwork. We took the 2011 census data for the target area (Shoreditch) and combined it with building data from Ordnance Survey Vector Map District, creating a 3×3 panel. Colorbrewer colour ramps, supplied in QGIS 2.0, were used, to colour each panel differently.

The resulting artwork is completely based on open data, licensed under the Open Government Licence.

A single physical copy was printed directly onto white canvas, using specialised equipment operated by Miles Irving at the Drawing Office in UCL Geography. He mounted it onto a wooden frame. The resulting artwork can be seen above and has now been passed to Article 25 for their exhibition and auction next month.

Update: They invited us back for 2014 and 2015, and we produced maps for these latter two editions too.

2014 was taken from an old high-resolution Ordnance Survey map, which we vectorised and stylised:

Our 10×10 artwork for 2014.

Our 2015 map was from GIS digital raster data – using a high-resolution DEM for our square, and styling it in Illustrator:

Our 10×10 artwork for 2015.
Categories
Cycling Olympic Park

Five Not-so-great Pieces of Cycling Infrastructure in London

Following on from my previous article on five great pieces of cycling infrastructure, here’s five things that didn’t make the list, and why:

Cycle Superhighways

cyclefac_cshgoogle

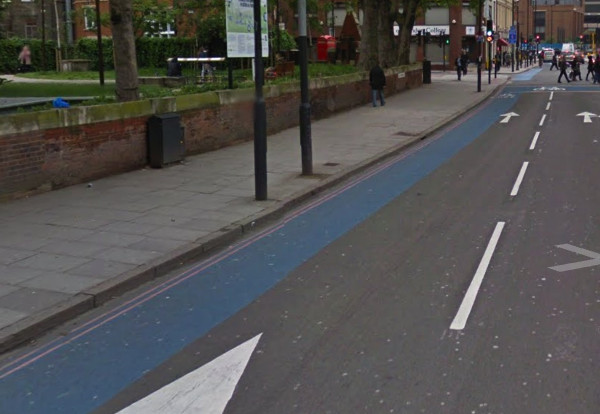
These were never intended to be “Dutch” fully segregated, high-capacity cycle routes. They are there to assist confident cyclists getting to work and back along the major roads. The project included reconfiguring many junctions to make them safer for cyclists too. However, too often, the “Superhighways” are just specially surfaced sections of roads, with no physical or optical barrier stopping trucks and cars driving along them. Worse, some sections are badly breaking up, with the surface disintegrating – most likely due to motorised traffic rather than the bicycles themselves. I understand that the project included funds to keep these maintained but that’s clearly not happening.

A real Cycle Superhighway would have been a lane in each road closing to motor traffic, which is happening in other cities (Vancouver, Washington DC to name but two). But with one measure of the transport authority’s performance being the average speed of traffic across its network, this was never likely to happen on the trunk roads.

Tavistock Place / Torrington Place Cycleway

cyclefac_tavistock

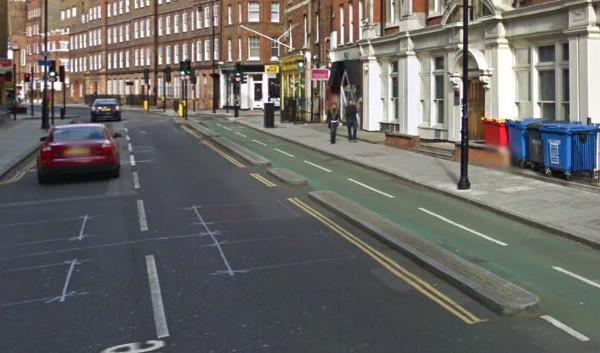
A very well used two-way cycle facility on a key east-west cycle route in London, the cyclists’ parallel to the heavily trafficked Euston Road. Sadly it is so busy with cyclists now that, at rush hour, with the lane only wide enough for one bicycle, the queues can stretch back beyond the previous junction. It’s therefore faster to cycle along the road during the rush hour – except you get hassled by taxis and other traffic when you do, because apparently the rest of the road is out of bounds to cyclists if there’s a cycleway.

The cycleway also includes an odd section where the two cycle lanes pass each other on their left – minor cycle-cycle collisions are frequent. Pedestrians often also cross the lanes without looking, with poor sight-lines, resulting in frequent frustrated yells from oncoming cyclists. The route needs the Royal College Street armadillo treatment, and the Camden Cycle Campaign has recently launched a project to encourage this to happen.

One-way Streets, even for Cyclists

cyclefac_oneway

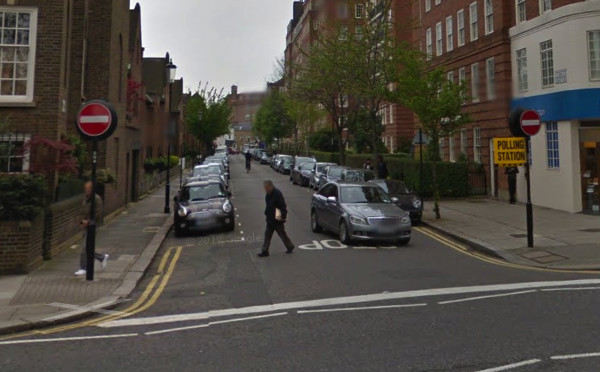
Encouragingly, two-way cycling on one-way streets is happening in quite a few places now – Hackney borough and the City of London Corporation, in particularly, have been taking the simple steps to allow quiet roads to be one-way for traffic, but two way for cyclists, without building complicated and often unnecessary dedicated cycle routes. Most European cities – Paris, Brussels and Vienna to name but three, are full of these kinds of streets. However, in London a great many side streets remain as impermeable for narrow bicycles as they do for big cars and trucks. There is often no reason why other than historical convention.

Cycle Routes in the Olympic Park / East Village

cyclefac_olympic

A whole brand-new neighbourhood being created, and a great chance to create a sustainable transport utopia, along with direct, spacious cycleways between east and central London, avoiding the traditional big roads? It’s still early days, but it doesn’t look like it’s going to happen. There’s just the “usual” cycle lanes which cars can drive in. There are a few dedicated sections, which are wide and straight, but it’s not all joined up. A real missed opportunity.

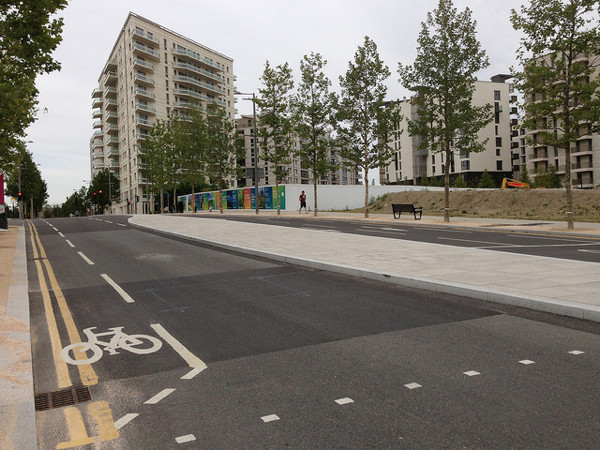
Removal of Cycle Paths

broadlane

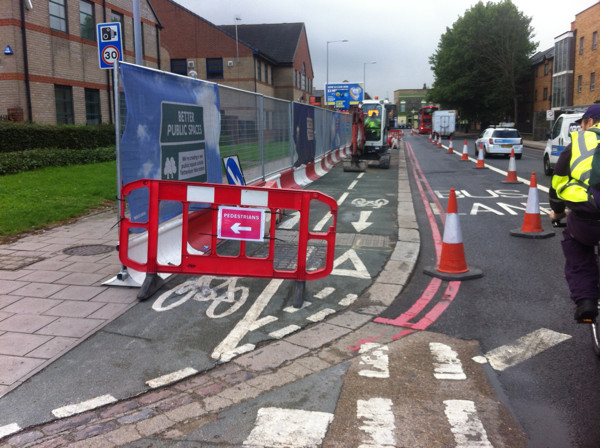
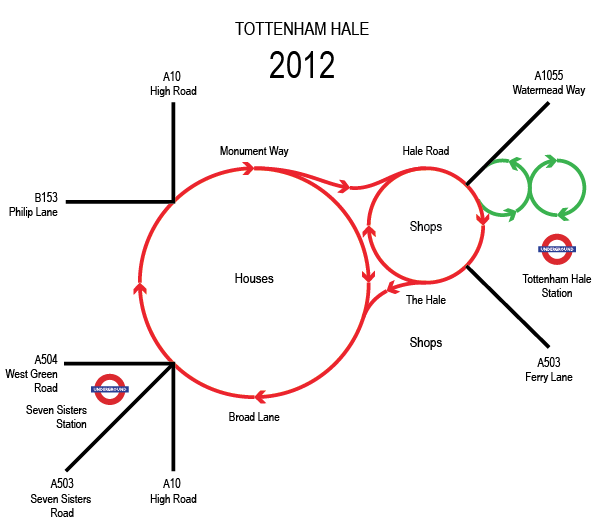
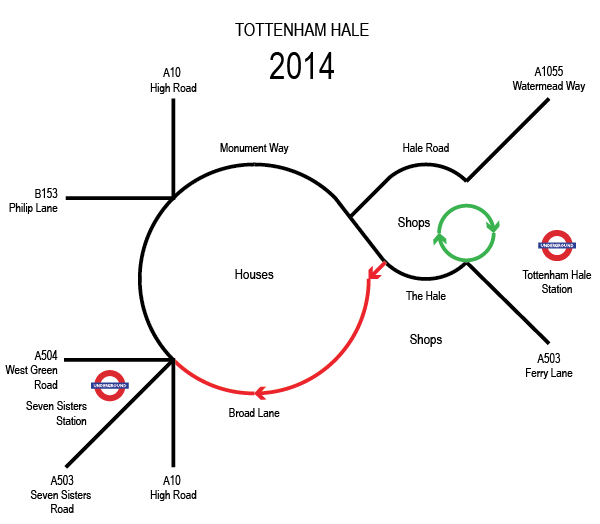
For streets managed by the central transport authority, rather than the individual boroughs, it seems that dedicated bicycle paths are out of fashion. The photo shows a cycle path on a wide pavement, about to be bulldozed away. It was never a great path, and not particularly popularly used (and often walked upon by pedestrians, hence the sign here), but it was still better than being on the road with the traffic. Original plans for the road rebuild here showed the cycle path being retained (Map D) but the plans were quietly updated and now show it gone. It will be replaced by a wide pavement with trees, the three-lane one-way road beside going to a two-lane two-way road. You can tell its a centrally managed street, by the way, because of the lines on the edge of the street being pink rather than yellow.

There are other examples of junction rebuilds happening where dedicated infrastructure for cyclists appears to be being designed out.

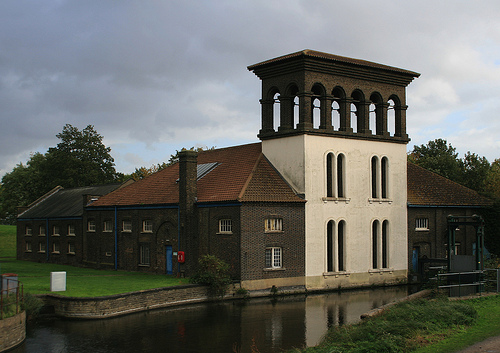
First three photos: Google Streetview. Fourth photograph: Diamond Geezer.

Categories
Conferences OpenLayers

FOSS4G 2013 Conference

IMG_4958

Well, that was good.

September this year was Maptember with numerous conferences with a geographical flavour taking place in the East Midlands. The undoubted highlight for me was FOSS4G 2013, the annual conference for OSGeo which travels around the world, this year it was conveniently in Nottingham, so I was able to make it along relatively easily. FOSS4G is Free and Open Source Software for GIS and as such the conference is a good mix of open-source technology and geography.

As I will be spending some time this month writing a book chapter on open source GIS, the conference was an unmissable event for me, even though a clash with another conference (ECCS) abroad meant logistics were tricky – in the end, a 6am wakeup call necessitated and lots of freshly ground coffee (very big thumbs up to the conference for that – a first) helped me out.

Just over 800 people attended the conference and there were up to 9 parallel streams. With many talks sounding very interesting it was often hard to pick a track to follow, not least as there was a 10 minute walk between the two main conference venues. I had brought my bike up from London, which helped.

Highlights of the conference for me were:

  • A keynote by Ben Hennig of Worldmapper fame on the need for the Open Source geospatial software community to remember about the cartography – the gist being just because you have the tools to map, doesn’t always mean you jump straight in without thinking about the better picture.
  • IMG_4959
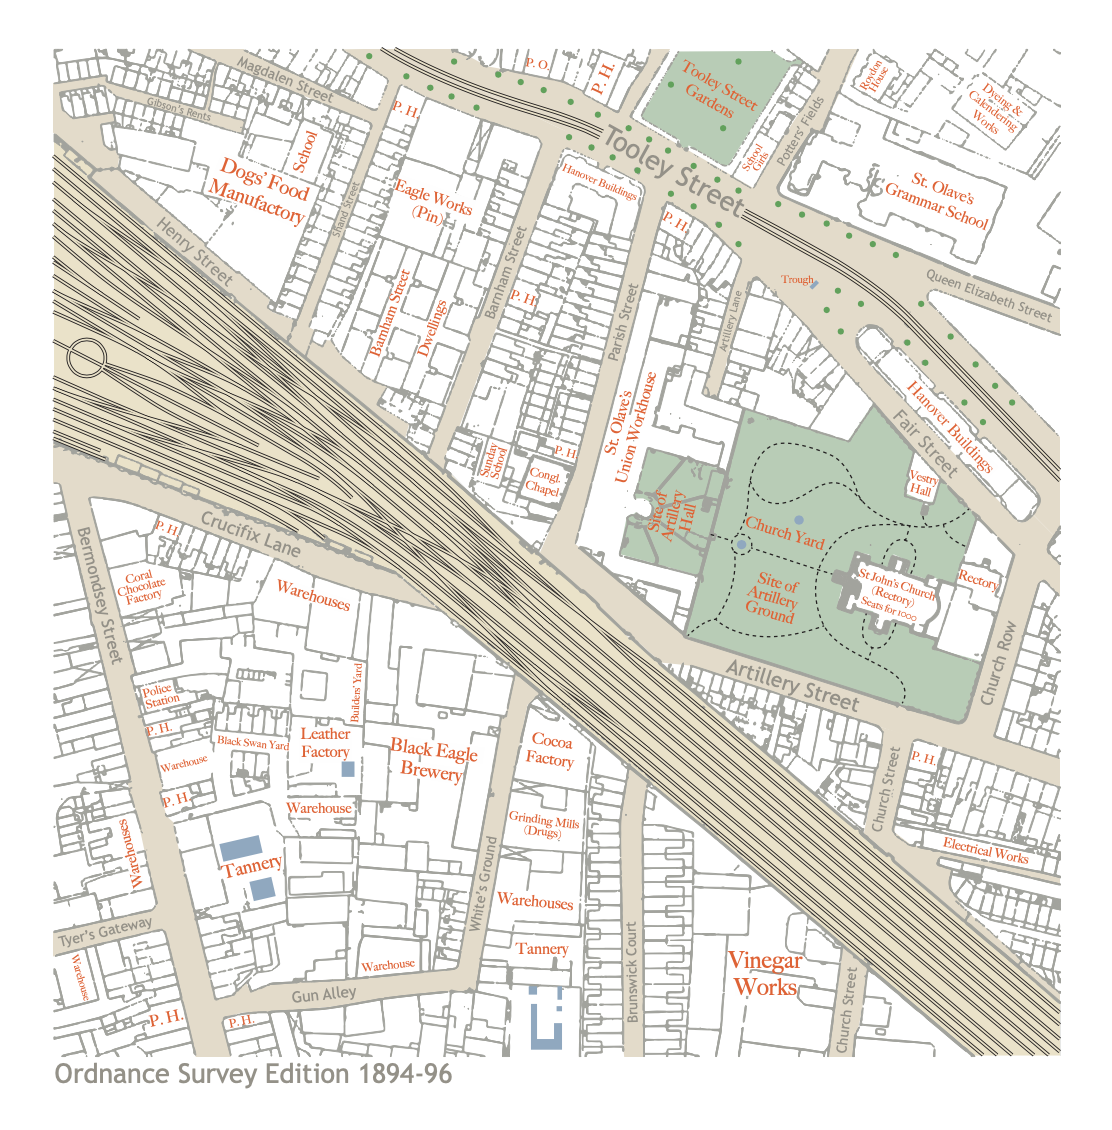
Keynotes by the two top sponsors at the conference – the Ordnance Survey and the Met Office. Both sponsors knew who they were talking to, and pitched the technical level appropriately. At both organisations, the open source ecosystem is pushing in from the sides and slowly becoming a core asset. Both also have large open datasets ready for crunching in your open source GIS of choice.
  • QGIS 2. This was launched at the conference. I’ve always been a fan of this open source GIS in particular (there are others available, including the venerable GRASS, uDIG etc), in no short part because of its excellent integration with PostGIS, that it works well on the Mac and that it is extendable and drivable with Python. Also, excitingly for the project in the longer time, the developer time and effort has ramped up recently – it’s reassuring to be using an open source application with a large and enthusiastic team beside it. Also – it’s not called Quantum anymore, although it’s going to take me a while to stop accidentally still calling it that.
  • OpenLayers 3. The first beta of this was also launched at the conference. I have long been a fan on OpenLayers, having regarded it as a richer and more powerful web mapping API than the Google Maps API, and have used its vector styling capabilities extensively. However, it has somewhat had its lunch stolen from it by Leaflet and by Google Maps continuously innovating, so it was due a rewrite – and OpenLayers 3 looks to be that rewrite!
  • IMG_4956PostGIS/PostgreSQL. There were a number of PostGIS talks, almost all of which were massively oversubscribed – not sure why they were in one of the smallest venues – one even got a representation later! PostGIS is another enormously impressive bit of open source technology, and the rapid-fire demonstration of what was new made me realise I really need to move forward and update my old version! (& do more cool stuff with it.)
  • The final talk before the closing session was by a tech person at ESRI. He had an awful lot to say in 20 minutes, and consequently overran, but had numerous interesting things to say on JavaScript geo libraries, many of which he lamented hadn’t been covered much (or at all) in the conference – I agree, but the conference did have to pare down nearly 400 submissions to under 200 at the event – such as TopoJSON, Node JS, JS Topology Suite, Shapefile.js, or D3. He did bash QGIS a bit which didn’t go down very well, but to be fair some of the QGIS talks had previously bashed ESRI a lot, which wasn’t called for… Good for ESRI for making the effort to come, even if (or indeed because) QGIS is rapidly becoming a serious competitor.
  • The conference food – it was excellent.
  • Catching up with a bunch of people in the community, not just the OSMers – e.g. Rollo (OS), Addy (Edina), Andy, Ben. Andy showed me some new OpenStreetMap renderings which use some advanced cartographic techniques in Mapnik and look great. Mapnik was another topic that I missed from the conference.
  • Evening tour of Nottingham by SK53 (actually just the leg from the curry house to the Ye Olde Trip To Jerusalem, but we went an interesting way.) SK53 has also written up in detail a blog post based in part on a comment I made!
  • IMG_4944The CASA iPad Wall (which was the other reason I was there) was showing, Ken Burns style, the various submissions to the map competition. In the end, the wall pretty much ran itself, thanks to careful stewardship by the Ordnance Survey who had requested it, and some high quality code that had been written for the display. Interestingly, Wired covered the conference, and focused on the iPad Wall, which really was quite a minor, albeit cool, part of the conference.
  • Winning a green glass globe paperweight for my submission to the aforementioned competition, namely the global version of my Bike Share Map – “Best Web Map”. This was completely unexpected, indeed I was already on a train back to London, having left just before the announcement, and found out through Twitter. “Singing” legend Gregory is, I hope, keeping careful stewardship of the globe and I will grab it in due course.

There’s a lot I didn’t get to see – Cartopy/Iris, more CartoDB, plus lots of interesting sounding papers presented on the integrated academic track.

This could have been the best conference I’ve ever been to. Ever. Well done to the organising team – I know they worked incredibly hard to deliver, but it was very definitely worth it.

Categories
Bike Share Conferences

Tracking, Visualising and Cycling

Along with Martin Zaltz Austwick, who blogs as Sociable Physics, I led a workshop session as part of CASA’s annual conference. The topic was “Tracking, Visualising and Cycling” and focused on analysing and mapping bikeshare data. I concentrated on mapping the near-real-time docking station data, while Martin graphed journey data. Both of us used Google Drive as a quick an easy platform to map spatial data and graph it. The techniques that the participants were led through are relatively rudimentary, but hopefully acheived our main purposes of demonstrating the availability of such data and the utility of Google Drive for quick analysis, without leaving anyone on the course behind.

After short presentations by Martin and myself, presenting our recent related output, there were two practical sessions. In the first session, I led participants through downloading the live dock locations/status JSON data files from bikeshare systems in the US, before hacking the JSON into a CSV suitable for upload to Google Drive and showing on a map as a Google Fusion Table. A calculated column was then added to show the empty/full ratio and the docking stations on the maps were coloured appropriately. The result looked a bit like this (if the New York dataset was picked):

trackingworkshop

A couple of gotchas we ran into: (1) If using Notepad, don’t save the JSON text, as that will “burn in” linebreaks that break it. (2) If you don’t see Google Fusion Tables in your Google Drive apps menu, you need to add it as an app using the button at the bottom of the popup.

Martin then followed by showing participants how to download journey data from the Washington DC “Capital Bikeshare” website, extracting just the data for Saturday 30 June 2012, extracting the number of minutes each journey took in Excel, binning the journeys by minute and then plotting it on a Google Speadsheet chart. An additional section was breaking down the plots by user type – showing a pronounced difference between Subscriber and Casual hires – the latter generally taking much longer for their journeys.

You can view the slides here.