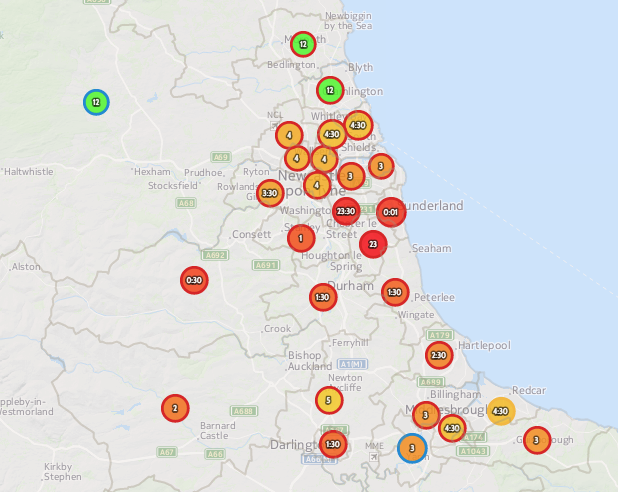
I’ve created an Election 2015 Time Map which maps the estimated declaration times that the Press Association have published. It follows on from a similar map of the Scottish independence referendum.
Each constituency is represented by a circle which is roughly in its centre (using a longest-interior-vertex centroid determined in QGIS). The area of the circle represents the size of the electorate, with the Isle of Wight being noticeably larger, and the Western Isles and Orkney/Shetland constituencies smaller, than average. The main colours show the expected time (red = around midnight, falling to green for the slow-to-declare constituencies late in the morning) while the edge colour shows the 2010 winning party. Mouseover a constituency circle for more data. Grey lines shows the constituency boundaries, created from ONS data (for Great Britain) and aggregating NISRA small area and lookup data (for Northern Ireland). You can download the resulting TopoJSON file, which is simplified using MapShaper. The data is Crown Copyright ONS/NISRA.
As the election approaches, and after the results come in, I hope to modify and update the map with other constituency-level data, such as the result itself.
One reply on “Election Time!”
[…] boundaries are now overlaid as a simplified GeoJSON (OL 2 doesn’t handle TopoJSON). For my time map, I was using OL 3 and TopoJSON. Ideally I would combine the […]