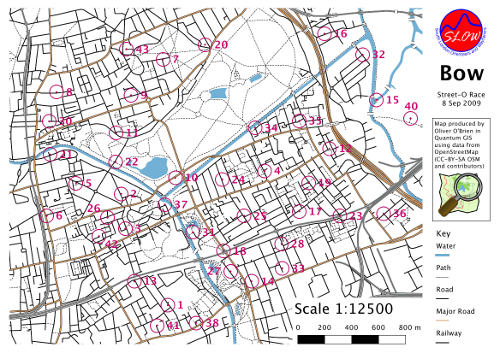
I organised a street orienteering event last night in Bow, East London. It was the first race of this season’s SLOW Street-O series. Nearly 40 people came along and survived the mean streets of Bow in soaring temperatures – it was nearly the hottest day of the year.
When producing the map for the race, I wanted to do something different – I wanted to finally utilise my GIS/OSM based method that I developed in my MSc dissertation last year. So, the map was based *entirely* on OpenStreetMap data, and produced in a GIS rather than a cartography or graphics package. Nothing was added to the map that isn’t in the OpenStreetMap database, so future street orienteering maps of the area that use the same technique will be at least as good, or better, as the wider OSM community continues to improve the mapping of the areas.

The GIS used was Quantum GIS. I used a pre-release version, 1.2.0, although the current “unstable” 1.1.0 release should work the same for these purposes. A patch was applied, to cap the ends of thick line strokes to the true extent of the line, rather than them extending slightly out which is the default.
During the creation of the map (which was in Quantum GIS’s buggy but full-featured Print Composer function) I created a number of style templates, representing standard street orienteering map symbology. I hope to have these available for download soon.
The process in creating the map was:
- Friday – investigating how complete and accurate the OpenStreetMap data of the area is, by comparing with satellite imagery and other sources.
- Saturday and Sunday afternoons – two long and windy cycles through various housing estates and down alleyways and streets, to record GPS tracks of missing streets.
- Saturday and Sunday evenings – adding in the detail to the OSM database, based on the GPS data and my notes. Also building Quantum GIS.
- Monday afternoon – identifying possible locations for controls.
- Monday early evening – a cycle around half the control points to confirm the questions and answers.
- Monday late evening – creating, styling and adorning the draft map in Quantum GIS.
- Tuesday morning – cycling around the remaining control points.
- Tuesday lunchtime – assembling the final map, checking for any generalisation needed, fine-tuning the control location “dots” and printing.
- Tuesday evening – the race!
You can download the vector-based PDF of the map here (1MB), and the questions here if you fancy doing the race in your own time (or virtually on Google Street View – many of the answers are visible on it.)
Comments from runners were generally positive – one spotted a road that wasn’t accessible, and the 1:12500 scale made the map quite cluttered. One key underpass under a railway was missed by someone. The simple cartography in Quantum GIS means, for example, black dashed lines can’t be forced to have a black segment at each end. There were more issues with interpretations of the questions than with the map itself.
No one got all of the controls in the hour, and they weren’t supposed to – with 41 controls spread right across the map, this would have been impossible to do. The top score was 550 points, out of a maximum of 800.
4 replies on “Bow Street Race”
Would love to get my hands on your QGIS O symbols. 🙂
Simon
I have a QPS file if you would like it – but it’s from version 1.2. It crashes QGIS 2.0 on startup, so I suspect it’s not very useful for you.
Anyway i have put it here: http://pastebin.com/1Mmfvqby
[…] data has been used for one street-O before – my Bow race in September, although here the data was pulled into Quantum GIS and a vector-based PDF was produced, allowing […]
[…] – this area was first used for a Street-O race in September – event […]