I was invited by organiser Landor LINKS to speak at the Walking and Cycling Conference which took place in Manchester last month. The conference included a good focus on bikeshare, and it was a good time for the UK-focused bikeshare industry to pause and take stock of a busy 2019. Three UK-focused bikeshare operators – Freebike, Beryl and Nextbike UK – were present, and it was good to chat with the respective teams and find out how the year had gone and their thoughts for the following year.
MicroMAAS and the UK
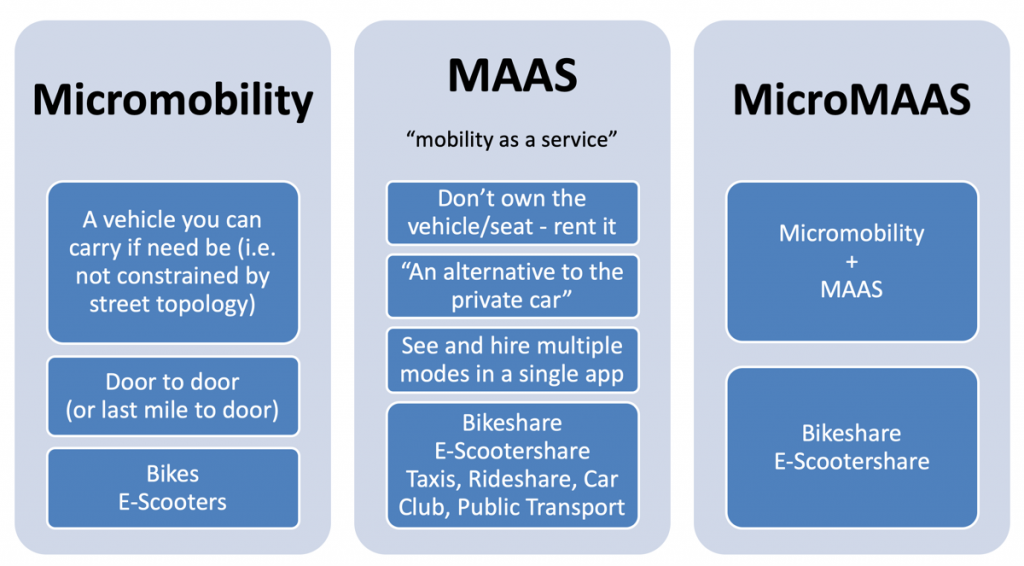
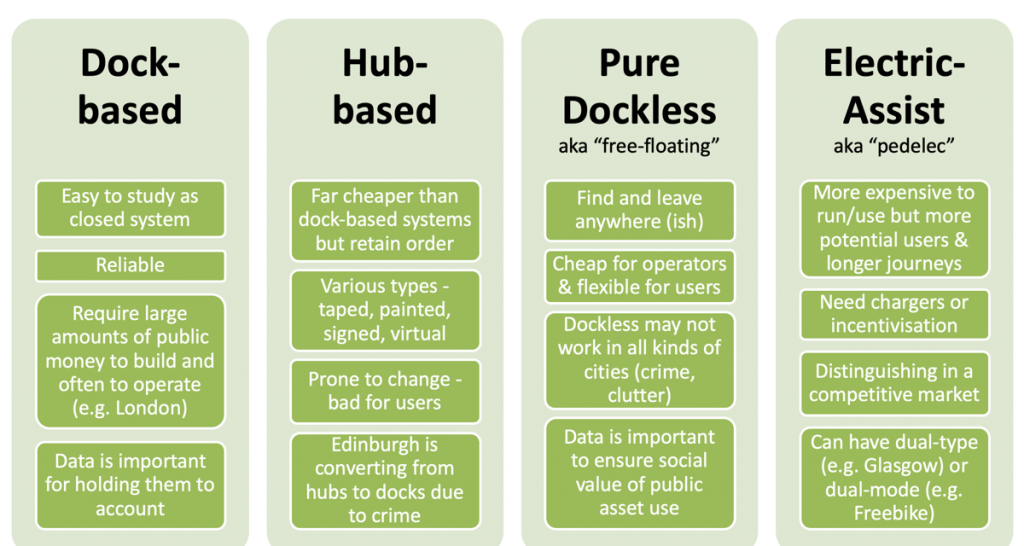
I presented on “MicroMAAS” data – first defining MicroMAAS as mobility share services that you can pick up (i.e. bikeshare and escootershare) and outlining the different types of bikeshare popularly available:
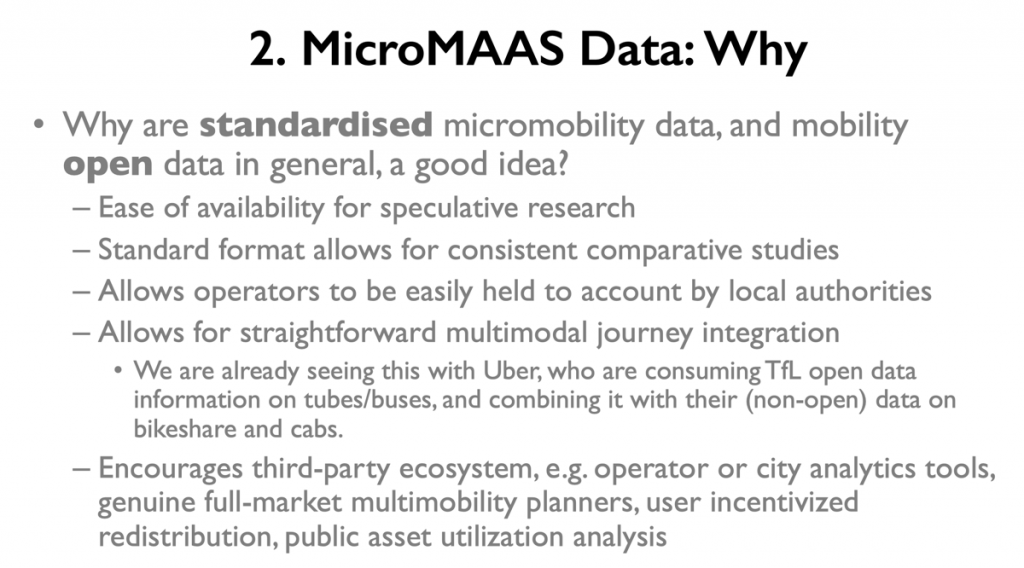
I then talked about the “why” of open/standardised data in the sector:
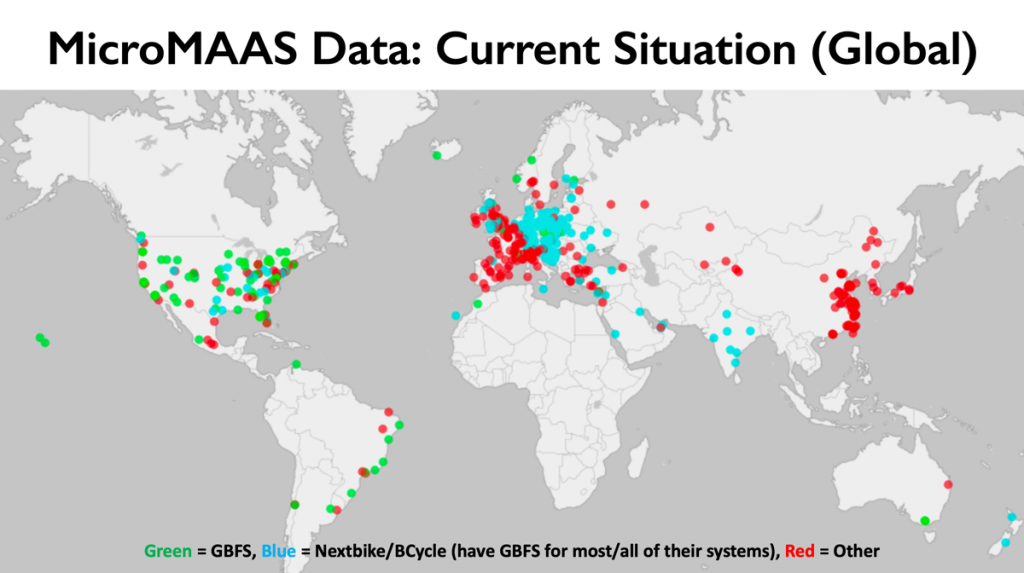
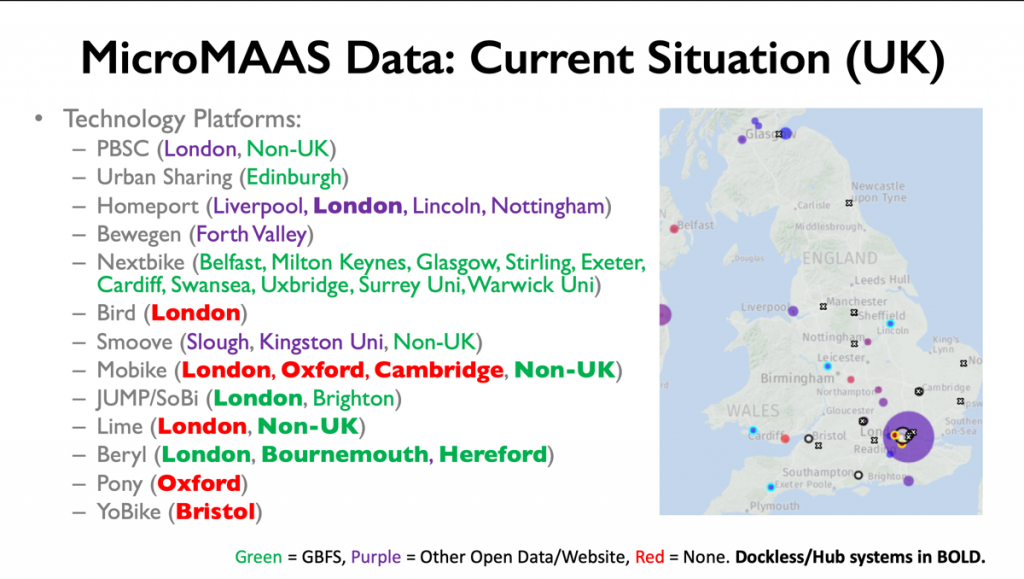
and the “where” – Europe is well behind the US here:
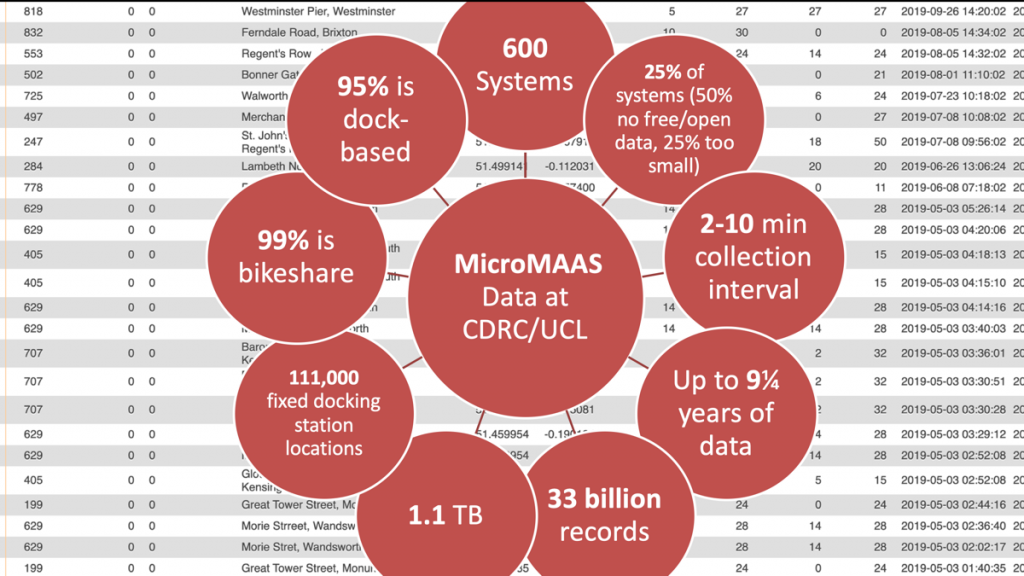
I mentioned CDRC’s excellent and huge collection of largely dock-based bikeshare dock data, available through the CDRC Data Service:
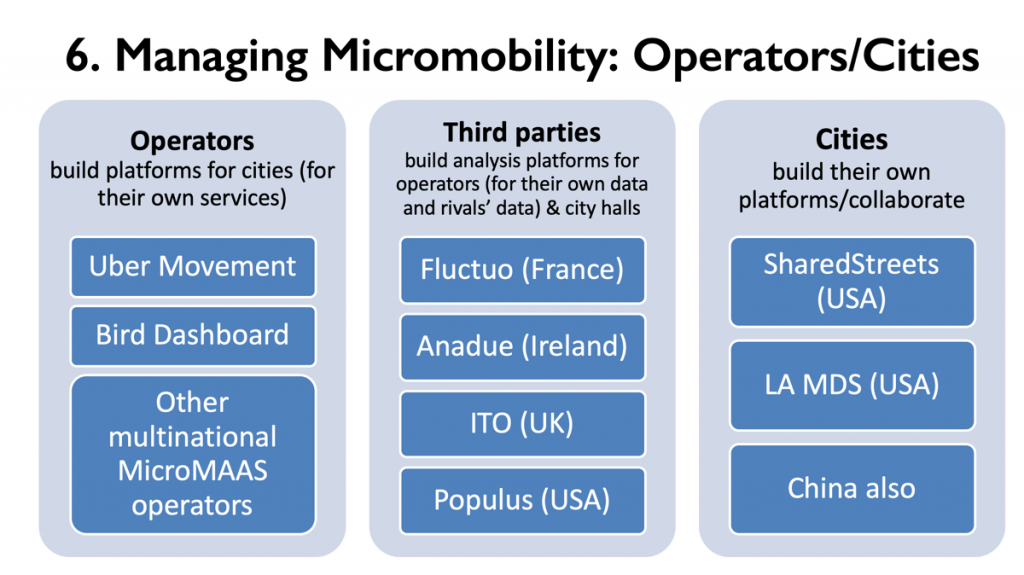
The last part of my talk touched on managing such systems, including key players in analytics platforms:
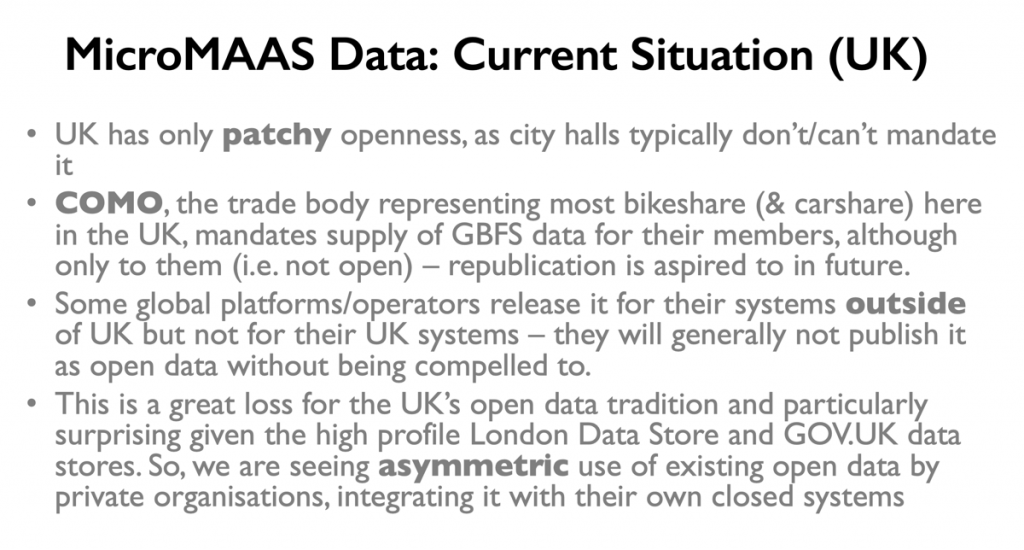
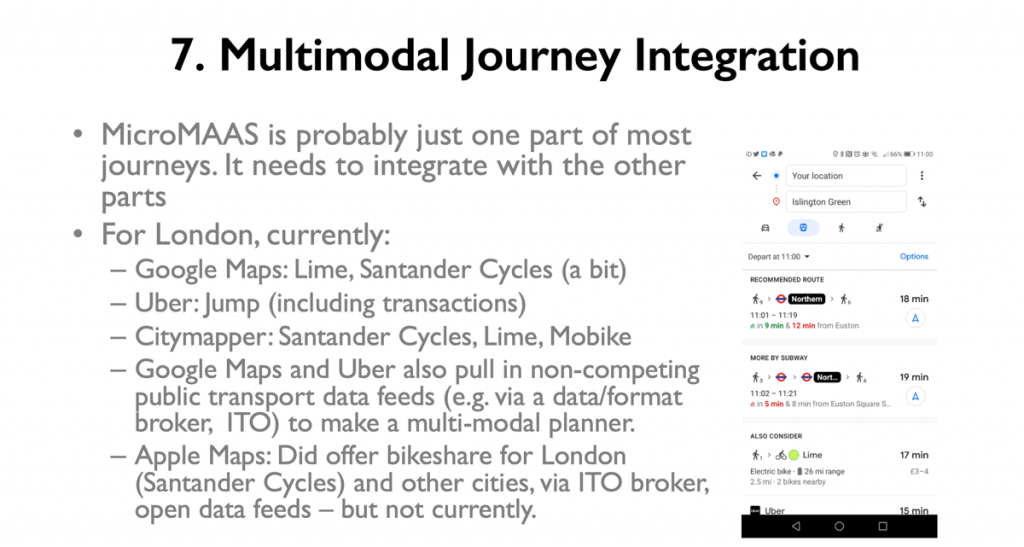
I also outlined and bemoaned and the (little) progress towards fourth generation bikeshare systems where payment is fully integrated into how other transport modes are paid for, rather than being app-siloed. Right now we are in a commercial battle, with providers looking to integrate vertically rather than horizontally – largely due to the weak management of the sector by local authorities here in the UK – who seem happy to take money and less happy to regulate the sector properly and effectively so that MicroMAAS will actually be a net benefit to the wider UK streetscene:
Beryl Update
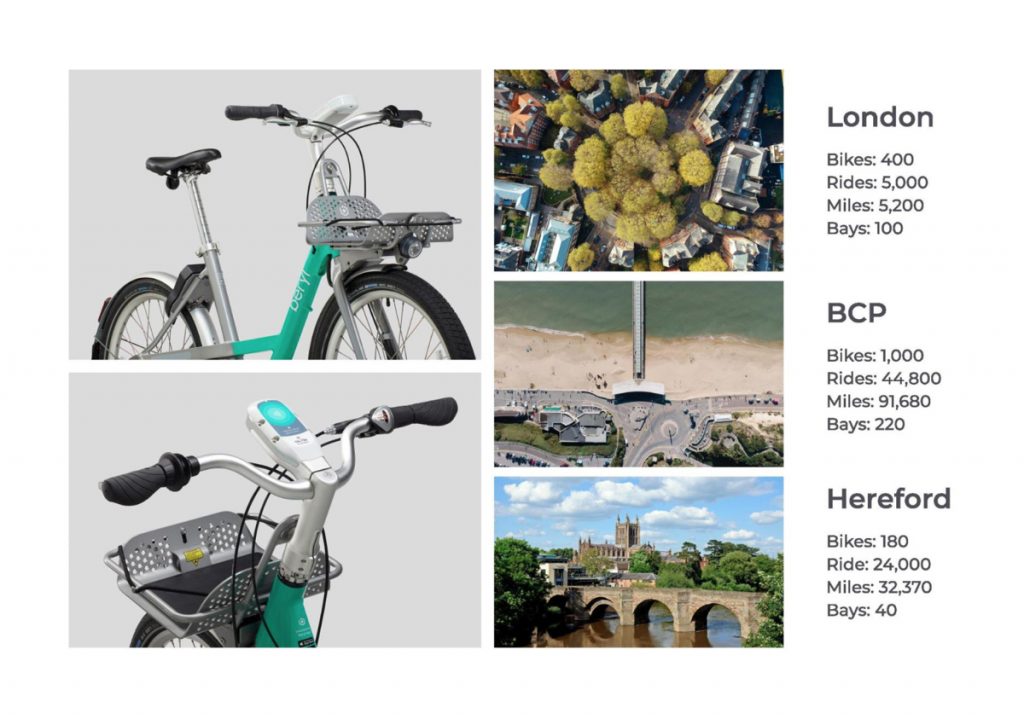
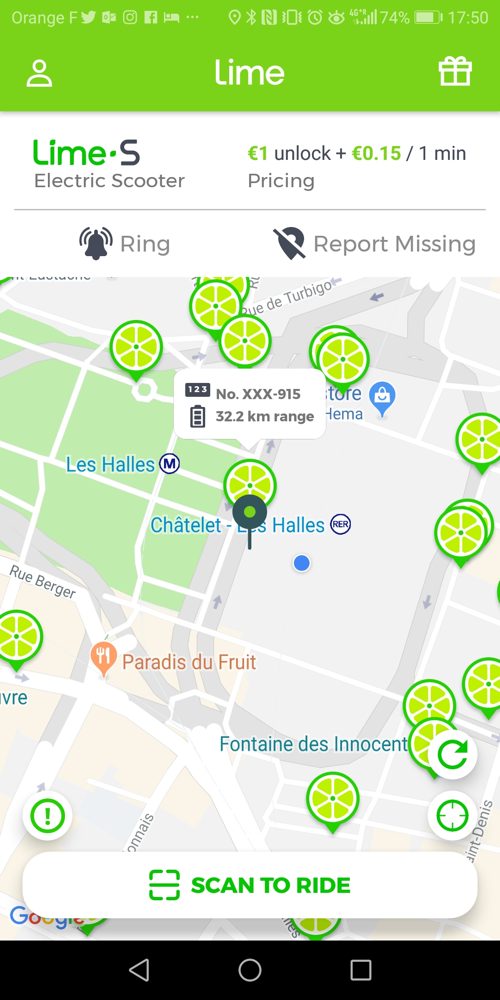
Of the other talks, I was particularly interested in Beryl’s – especially they included some data on their first half-year of operations. UK bikeshare usage data is still rather sparse so it was good to see these numbers in a public presentation. The London operation is very small – they quickly moved out of Enfield after the system was heavily abused and little used there – and the City of London “square mile” only has limited need for journeys within it:
London’s on-street available fleet is typically around 144 (and around 100 currently) rather than the 400 mentioned here. With approx 5 months between launch in July and the early December presentation, this suggests around 30 rides a day or just 0.2 rides/bike/day (as a rule of thumb, for a non-electric system, over 1 is just about OK, over 2 is good and over 3 is really good – for electric you need 2+ due to the extra costs of the bikes and retrieving them to charge). As you can’t really do a point-to-point journey in the City that is longer than a mile and a bit, this would explain the average journey being just over a mile – half that of Bournemouth.
This may improve with their extension to Hackney that is happening now – so far they have moved into Shoreditch and Hoxton in the south of the borough, but in time if they move into parts unserved by Santander Cycles then they become the cheap, manual alternative to Uber’s JUMP here.
However their numbers for Bournemouth and Hereford – the latter helped by a generous public subsidy – are much more positive. Bournemouth launched in mid-June and averages around 300 bikes (although 140 bikes currently) – so 1 t/b/d, and Hereford launched at the end of July, averaging around 160, or 1.3 t/b/d. Bournemouth is suffering from theft though.
JUMP
I’m also hearing good numbers coming out of Uber’s JUMP system in London – so it is possible for commercially-led bikeshare systems to work here in the UK, it just takes a lot of experimentation, effort and investment.
See also Bikesharp, which is my blog exclusively dedicated to the minutiae of the UK bikeshare market.
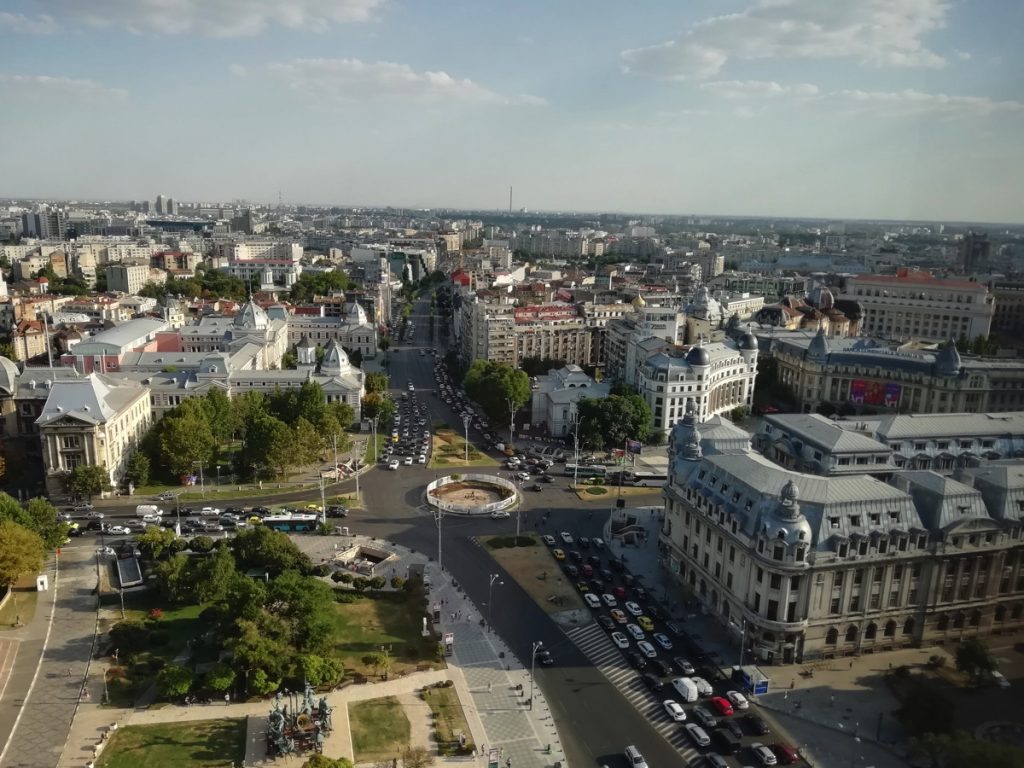
Last week I was at FOSS4G (Free and Open Source Software for Geo) 2019 conference, in Bucharest, Romania. It was the second time I had attended the global conference, the first being back in 2013 in Nottingham. There are also country and region “mini” versions of the conference, including FOSS4G UK which I have also been to a few times. Relatively cheap airfares and hotel costs in Bucharest, along with the conference fee itself being low for early birds, along with the theme focusing on open source geo software that I use heavily (e.g. QGIS and OpenLayers) meant this was an obvious summer conference to go to. As it is the “canonical” conference for the industry, it means that many of the key technologies have core developers attending – and speaking. Hearing insight from the creators – rather than just vendors – is invaluable.
I attended the main conference days on Wednesday, Thursday and Friday. It was a packed event, with 11 simultaneous streams of talks, starting each day at 9am, and with social events in the evenings too. Two smartphone apps for the conference were a must – Attendify was a good interface work out which sessions to go to when. The app is full of annoying quirks, and ironically lacking on the map front, but does have a bookmarking system which was invaluable. Telegram was the other app, as there was a FOSS4G event group chat which was lively and frequently updated. Around a third of the 1000 attendees were on the group chat. Unfortunately I had to find out about both Attendify and Telegram from other attendees – registration didn’t tell me about these. You would have had much less of a conference experience without these apps.
Openlayers 6.
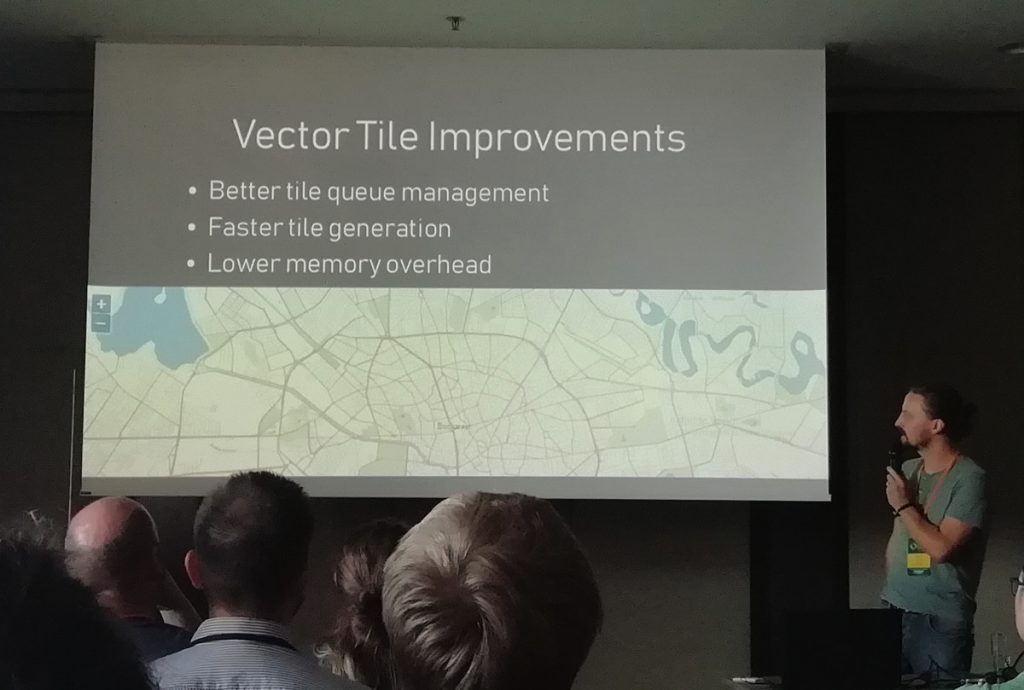
Day 1 – Wednesday – was the best day for me, as it included core developer talks on GDAL, OpenLayers 6 and QGIS.
The GDAL talk included mentions of ndjson (and so ndgeojson), whichI hadn’t heard of before but is being supported in GDAL 3. It also touched on PROJ 6 and TileDB.
The OpenLayers 6 preview gave a good insight into the main optimisations and improvements being made – faster Vector Tiles, high-volume point-based vector rendering and arbitrary HTML elements as part of the map, to name but three. At the 2013 conference, OpenLayers 3 Beta was released – we’ve come a long way.
The QGIS talk previewed some of the work in progress in 3.10 and the next LTS release. QGIS 2 was launched at the 2013 conference – again, we’ve come a long way.
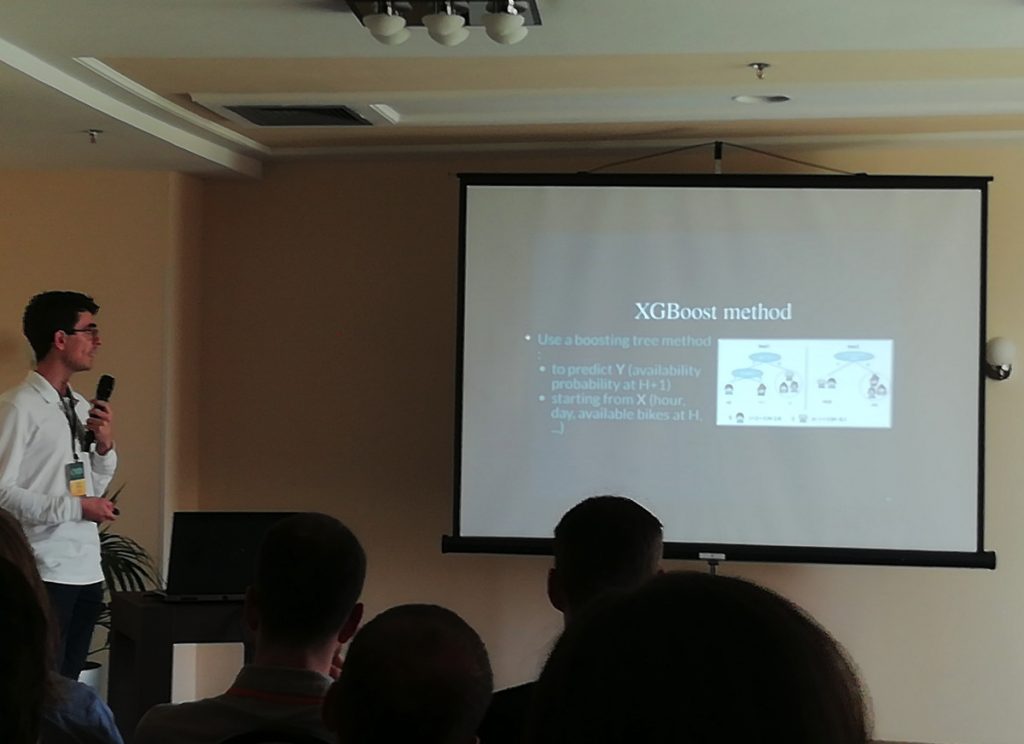
But the biggest surprise for me was one of the first talks – on bikeshare data visualisation, by Oslandia, detailing their python-based web application showing flows. My own Bike Share Map won Best Web Map back at FOSS4G 2013, and since then the industry has evolved a lot, and my map with it. I wasn’t expecting to see much in the way of bikeshare at FOSS4G, it being very much a technology rather than transport conference, so it was a nice surprise.
Bikeshare data clustering using open software.
Day 2 – Thursday – was not quite so unmissable for me, although this may perhaps have been due to the icebreaker event at Bragadiru Palace, following by a long walk back through central Bucharest in the evening heat – stopping off at Caru’ cu Bere, an intricate neo-gothic pub/restaurant that reminded me of the Cittie of Yorke in London.
Anyway I enjoyed the talk on PGRouting although I would have loved to have learnt about the differences between the main routing algos that have recently been added to it.
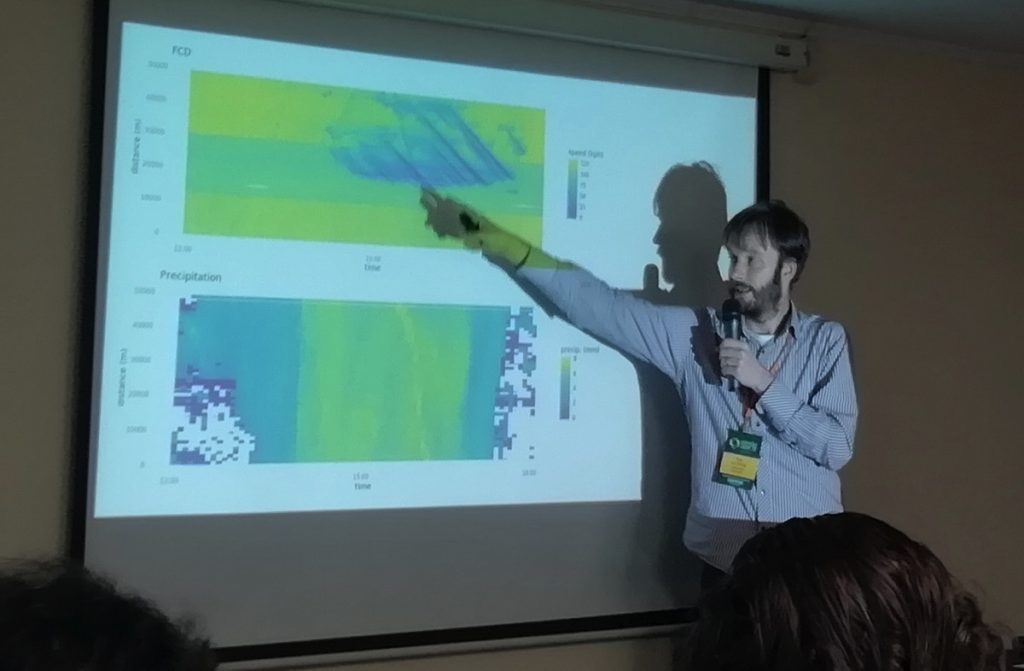
The best talk (for me) of the whole conference was on this day and was one that I hadn’t even been planning on attending. It was “Analyzing floating car data with clickhouse db, postgres and R”. It only had a teeny bit of R in it (I’m a python person) and was a great example of crunching a big dataset (all major road vehicle speeds and weather conditions grid data) using a specialised database, and visualising effectively.
Car speeds in the Netherlands and the effects of weather.
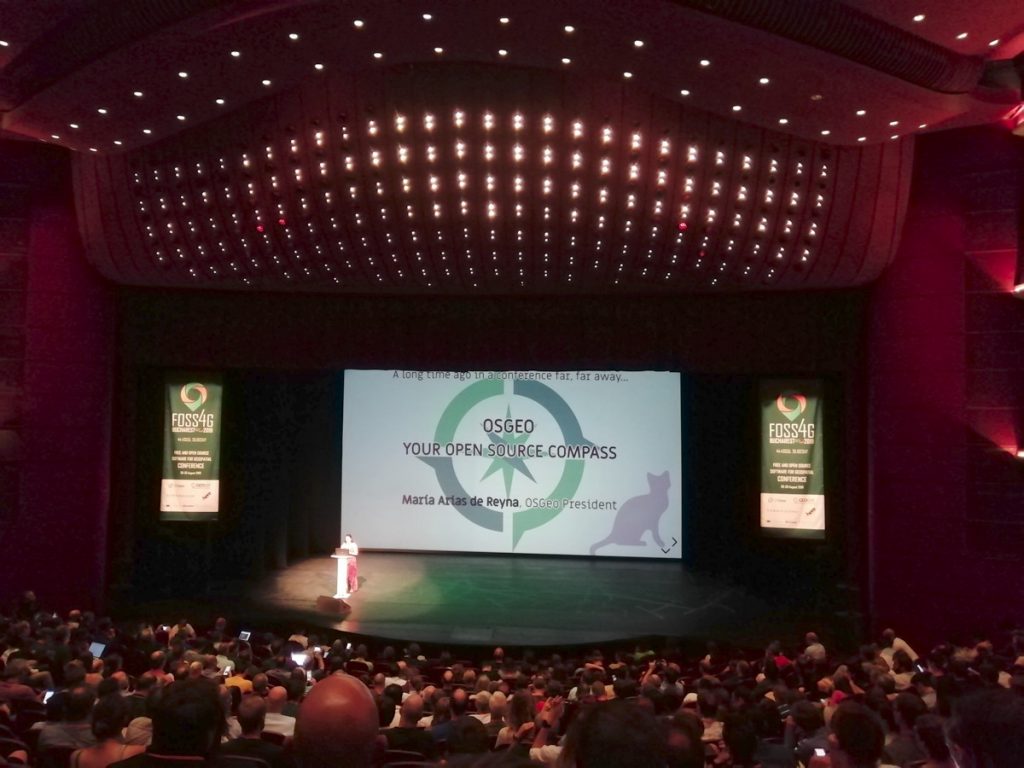
Day 3 – Friday – kicked off with “What’s new in PostGIS” was another unmissable talk – PostGIS’s importance in the FOSS4G community being acknowledged by it being a plenary rather than parallel-session talk, and so hosted in the 1000-seat National Theatre auditorium. Unfortunately this meant it was on at 9am, and so I opted to watch this one on the excellent, high-quality live stream being broadcast by CCC, from my hotel room, before checking out and going to the remainder of the conference. CCC’s production quality and coverage is perhaps one of the best things of the entire conference.
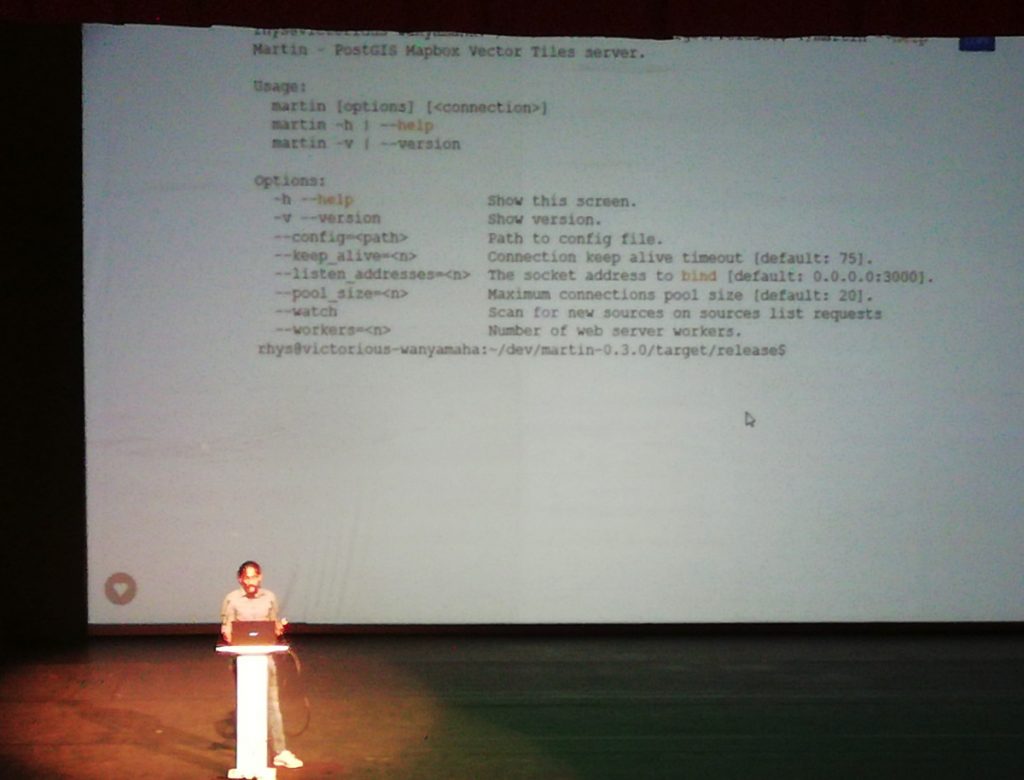
Other good talks on the final day included an integration of OpenLayers with the decidedly non-open-source Power BI platform, and a demonstration of Martin (a PostGIS-based vector tile server written in Rust).
QGIS on the Road sounded promising, but was a little too contrived (using QGIS to plan a bee-keeping hobby) and also too long – it was a triple-length session unexpectedly without breaks and was more of a tutorial. I was hoping there would be a demonstration of QGIS on mobile devices.
Finally a talk on GNOSIS style sheets – I certainly think any consideration of good cartography is a good thing, but feel there are already excellent ways (e.g. SLD, or Mapnik/CartoCSS) of standardising cartographic style sheets on the web.
Martin, a vector tiles server.
As previously, there were some themes that I would have liked to see more of such as on advanced Mapnik usage. There was also little on Leaflet, which was a surprise. Heavy users of the open source geo-toolstack didn’t have a huge presence – e.g. Mapbox. Indeed, Google and ESRI, two non-open vendors, were more visible. Like back in 2003, there is little if anything on D3. I was also surprised to see little mention of MapShaper or Shapely.
The other thing was that the OSGeo AGM sessions, representatives of the many incubator and other supported projects had around 30 seconds each to introduce their work and progress in the last year. I hadn’t heard of many of these, and ideally, every OSGeo incubator and supported project would have a least one 20 minute talk during the main conference itself, as an audience education. Perhaps something for the future conferences.
Opening Plenary session in the impressive National Theatre.
So overall another excellent, well organised conference with many good talks and also excellent community networking opportunities. The facilities were good (even if the hotel changed the names of some of the rooms after the programme went to press!) and there was something for everyone in the community. I don’t know if I’ll make it to FOSS4G Calgary in 2020 – I probably should start writing some open geo software first – but hopefully I will make it to another FOSS4G before too long.
Lime eScooters-for-hire in Bucharest, with the older bikesharing system behind.
Micro-MaaS in Bucharest
A note on Bucharest’s micro-MaaS options – it currently has a third-gen non-electric bikeshare, L’Velo Urban although it covers very little of the city, and requires potential users to go one of two manned booths during working hours to get a pass to operate it. So hardly user-friendly. I saw a grand total of one person using the system during my entire 3 day stay.
The other option is eScooters – Lime and Wolf-E are both present. Lime is surprisingly expensive – the equivalent of 60p to start a journey and then 12p/minute. Nearly as expensive as London, in a city where food, drink, the metro and taxis are far cheaper. Indeed, it’s probably about double the rate of getting an Uber. Despite that, there were loads of people using Lime – I didn’t see anyone using Wolf-E. So, Lime may be on to something – there are plenty of people who are brave enough to scoot on the roads (which are dominated by traffic bombing along a way that London traffic doesn’t) and happy enough to pay for what seems like an expensive option – perhaps because it is the only fast option that doesn’t get held up in the pretty bad traffic the city has (there are not many bus lanes either).
Bucharest itself was a pleasant city to visit. Once I had got used to the traffic, it was quite nice to walk around, particularly in the evening-time when the worst of the heat has passed, and it still felt safe to walk around. It is a city with a recent history, with much graffiti (including on historic buildings), crumbling pavements with mysterious holes, and an oversupply of administrative buildings, a place where the car is king (some pavements are unwalkable due to parking on them) – but also a busy, bustling place full of interesting cafes and bars.
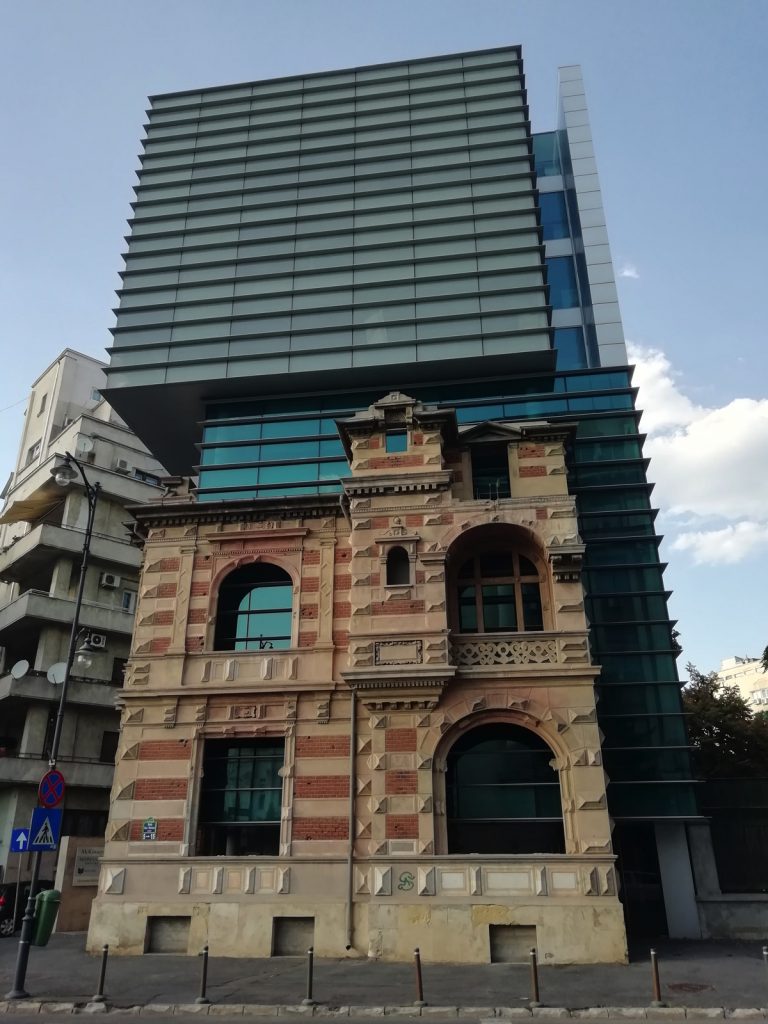
A building within a building in central Bucharest.
I was a guest earlier this week at HERE Techologies at the Consumer Electronics Show (CES) 2019 in Las Vegas, the world’s biggest consumer electronics trade show. Their booth was directly right outside the main entrance to the Convention Centre, the hub of CES, right beside Google’s own huge one. The juxtaposition was interesting, the two companies competing intensely in some areas of location services (e.g. mapping APIs, journey routing and rich global POI databases) while being distinctly different in their approach – Google being very consumer focused with its ubiquitous brand, its location tools being largely smartphone based and advertising/user profile driven while HERE’s European origins are reflected in its strict user anonymisation defaults, its main datasource being car sensor information from cars (e.g. some of the major car companies are the key investors in HERE), and its mainly B2B focus which means that the UI you typically in front of HERE’s location intelligence is typically branded from the car company itself.
HERE’s location marketplace
The car sensor information drives much of the 5 million updates made every day (generally automatically) to its global master map and also means that HERE has a pretty good live traffic data stream of its own. The global master map also contains 160 million+ POIs (points of interest) – it’s a seriously large database – which HERE has collected, collated and bought from a wide variety of sources. The map is a core part of HERE’s overall location platform offering.
HERE’s booth was a hive of activity, with product demos downstairs (themed around “the new reality”) and a small stage, while upstairs, numerous meeting rooms were full all day, presumably with various meetings between HERE executives and at a guess, car companies looking for platforms to power their car/user information systems, city transportation agencies looking for new datasets to understand their city roads more effectively, and other key potential stakeholders in HERE’s location platforms. The the breakout areas were also well used and even a little outdoor cafe/terrace overlooking the main entrance to the convention centre.
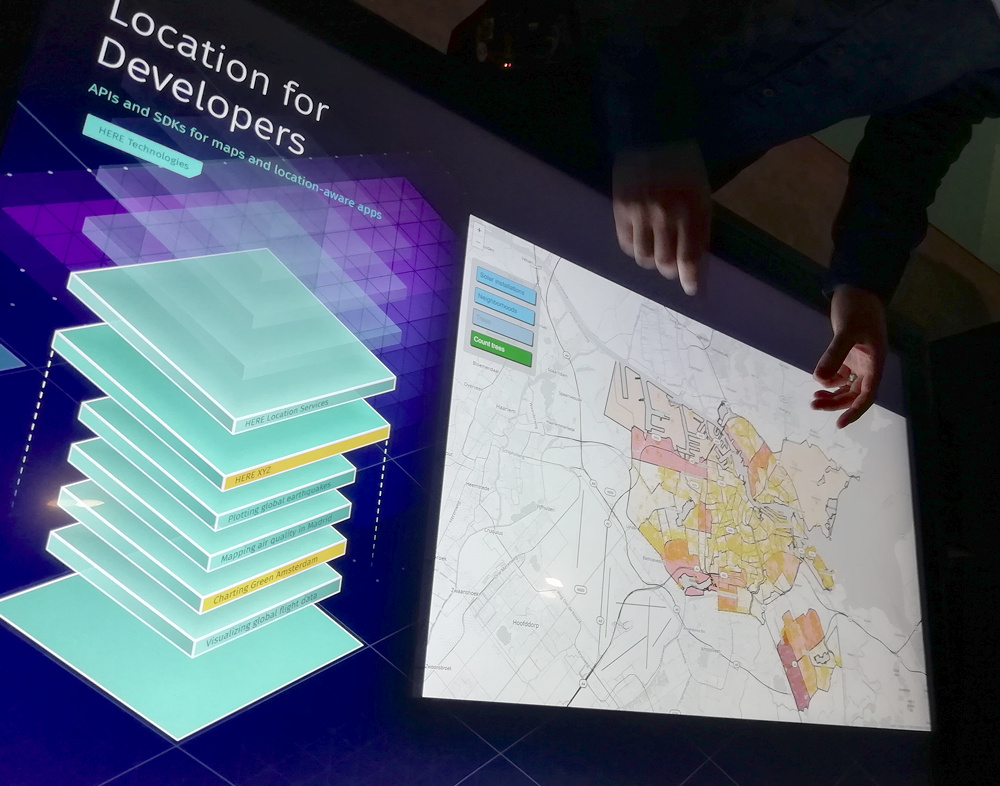
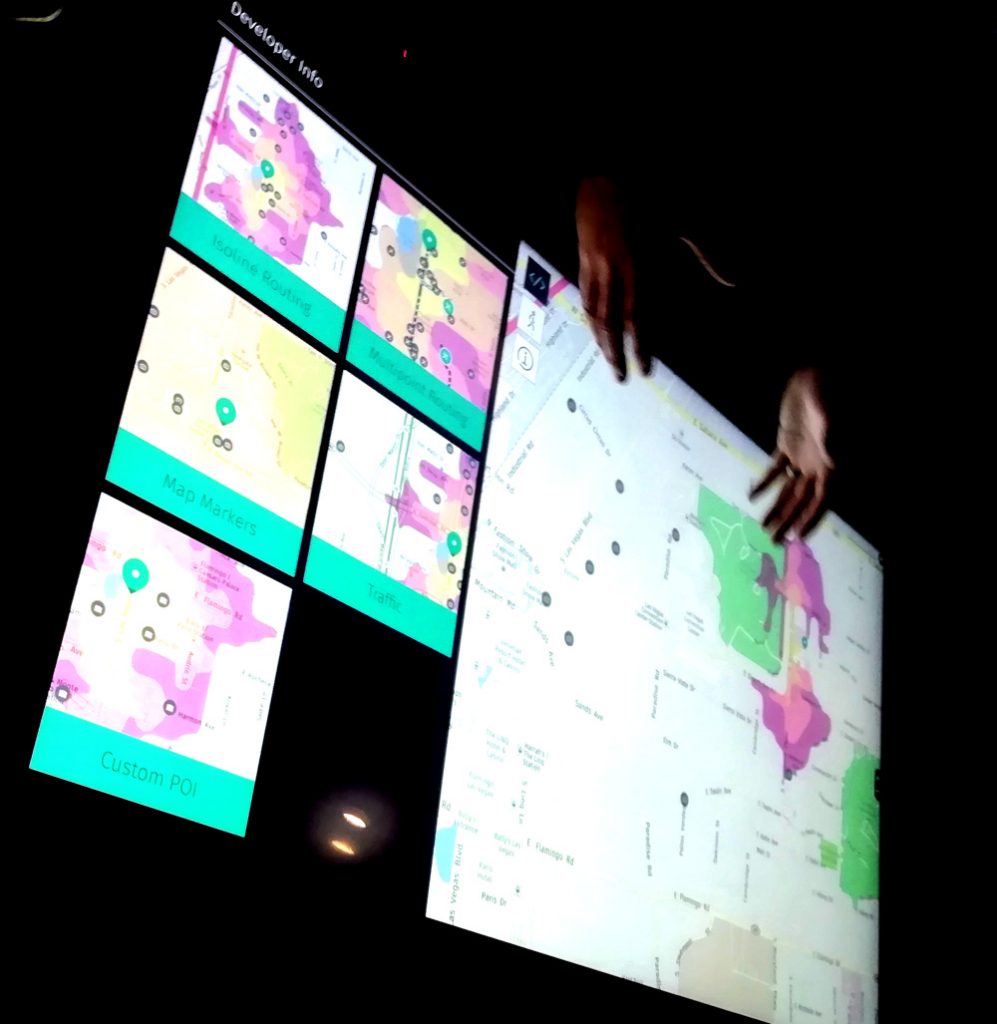
The HERE XYZ developer API.
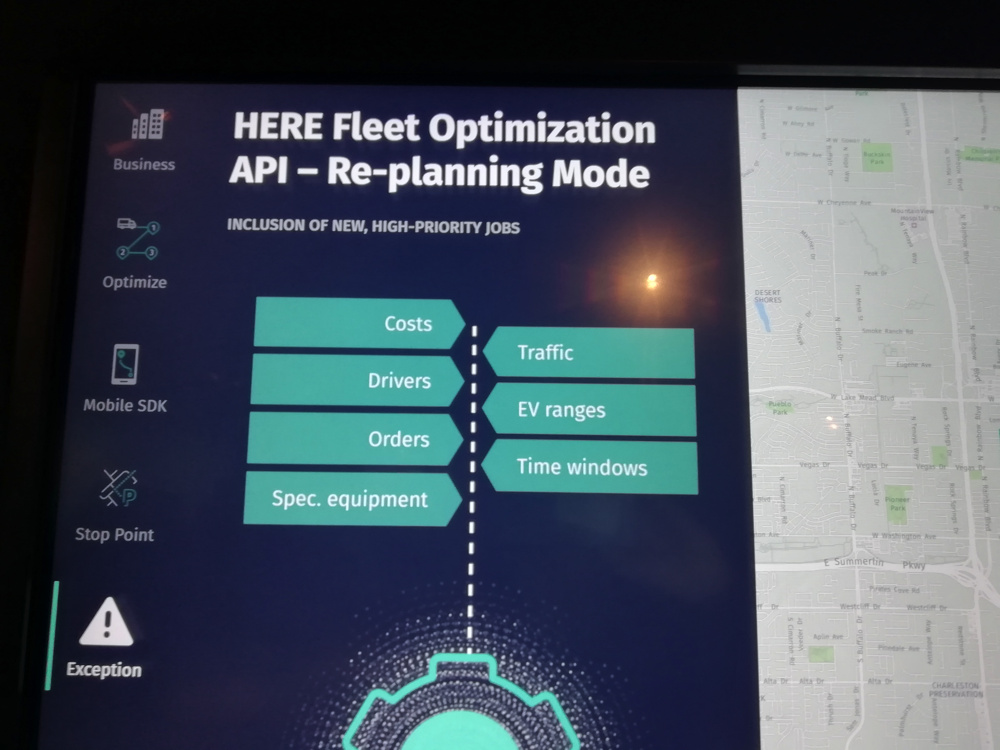
Our group was introduced to a number of people at HERE, including the CEO and various product managers. Of particular interest to me were the Fleet and Developer API talks – the former because of the “enterprise level” travelling-salesman-problem type (actually the vehicle-routing-with-prizes problem) functionality that is a core part of the platform, and the latter because I’ve already used a little bit of the HERE mapping APIs.
Fleet Management (the “travellling salesmen problem” solver)
SoMo
I also chatted to the HERE Mobility team who also had a presence in the HERE booth and also their own display in the main exhibition halls. HERE Mobility, who operate almost as a “start-up” within HERE, have the most obvious “consumer” presence of HERE, and launched their new “SoMo” app, which aims to be an “honest broker” multi-mobility navigation too. SoMo, which is short for Social Mobility, aims to offer various rideshare options from third parties, as well as transit and driving information – it’s key distinction, apart from being a platform for smaller rideshares, is to allow easy pooling of ride opportunities and friends/contacts who also need to journey to the same place.
They have identified a number of scenarios where this is useful, for example, people from a particular neighbourhood who are all planning to go to a music concert in a specific venue in another part of a city. The theory being that fans of the same artist might want to travel together and pool the costs, and find a good value or available service, where the “big two” rideshares Uber and Lyft, who are not on the platform (and indeed are building their own multimodal platforms) may be not present in a particular city or don’t have the necessarily availability or good price point on the ground.
SoMo will likely work best when you have a number of friends/contacts using it, and sufficient coverage of timely services in the cities where the users are. As such, it will live or die by the volumes of people using it, hence their big push to have the new app downloaded as widely as possible.
One HERE announcement at CES that is of immediate to me – my Alexa Echo Dot is finally location aware, worldwide – it was frustrating that it was unable to give me directions or time estimates, while my Google Home Mini was able to – but Amazon and HERE announced a partnership where the HERE location platform (with its routing capability, traffic awareness and huge map and POI database underlying it) provides location information in response to relevant queries to Alexa. This is not through an add-on “skill” (Alexa’s terminology for apps) but is built in to the core of the device’s response framework.
More map layers and location data available through HERE APIs.
Thank you to HERE Technology for inviting me to CES and organising the trip and insight day.
Two Lime escootershare scooters being used on the former highway in Paris beside the River Seine that is now a peaceful, traffic-free route. The scooters are passing a rather well hidden New Velib bikeshare docking station.
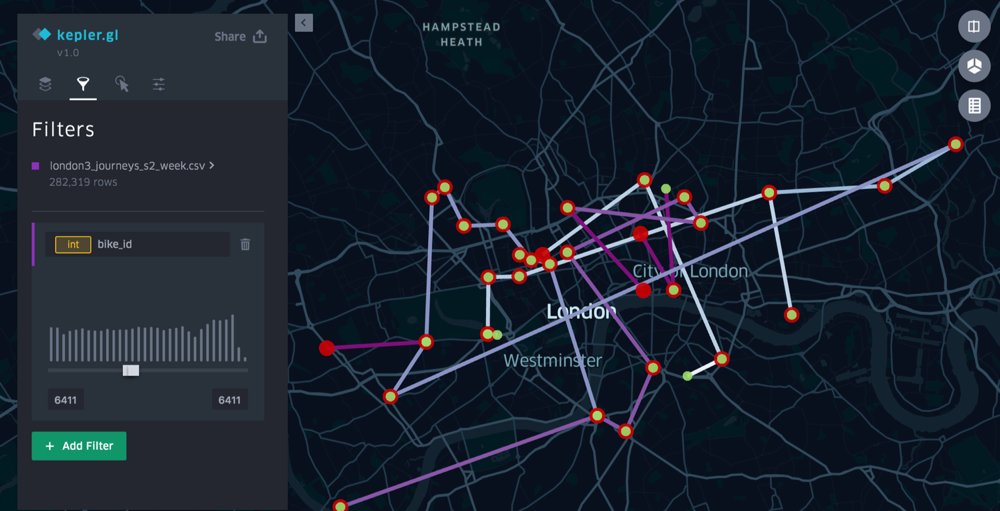
I was in Paris just before Christmas, taking part in a workshop at IFSSTAR (Université Paris-Est) on innovations in flow visualisation – GFlowiz. I talked/demonstrated some old and new ways that I and others have shown commute journeys in the UK on the web, looking both at The Great British Bike to Work and TubeCreature (developed with the HERE mapping platform), as well as some tests, with open bikeshare data, of the new React/WebGL/Deck.gl-based Kepler.gl recently developed by the Uber Engineering for interactively visualising large spatial datasets locally in a web browser. Kepler.gl works well with bikeshare flow datasets of up to around a million journeys, which, as CSVs with lat/lon pairs, can be simply downloaded, dragged and dropped into the web application:
Showing the journey of a single Santander Cycles bikeshare bike over a week in July, using Kepler.gl. Journey starts/finishes are green/red and the lines become more purple as the week progresses.
I enjoyed the other talks in the workshop too, especially the introduction to flowmap.gl by its creator, Ilya Boyandin of Teralytics.
I had a few hours left after the conference to explore the centre of Paris, so I embarked on a long walk from Forum des Halles to Notre Dame, and then up to Gare du Nord. Paris has undergone a bit of a shared/smart mobility revolution on the quiet, since I last visited a couple of years back. Escootershare has taken advantage of the disastrous start to the relaunch of Velib at the beginning of 2018, and France’s more liberal traffic laws than in the UK, with numerous companies launching their operations there. Some dockless bikeshare systems have had a go, although Ofo at least has now disappeared from Paris, and the trend for the rest doesn’t look good either.
Lime escootershare bikes available (according to the app)
So, along my walk, I noted down all the escooter/bikeshare brands in use that I could see, along with the incumbent Velib service. There were also quite a few personally owned (or possibly white-label shares) that I spotted scooting past, which I didn’t note – for scooters at least, these were in total easily outnumbered by the brands.
Escootershares are, at the moment at least, all dockless, rather than being locked in physical stations, and I believe they tend to get taken in by casual workers overnight for recharging. My walk took place between around 6pm (i.e. end of rushhour) and 8:15pm, and I saw plenty being operated even at the end of the survey interval, so I would presume that the escooters are generally collected after this time.
Overall, I was impressed both by the uptake of these devices, and the care in which they were left after use. I saw no sign of any vandalism (although I did mostly stay in the more touristy parts of central Paris) and very few were inappropriately parked. I can’t say for sure that all the ones I marked as parked upright were not blocking pavements or crossing (e.g. tactile strips, dropped kerbs) in such a way that someone in a large wheelchair might have an issue, but on the whole I got the sense that they were not the pavement intrusions or litter that many of the London dockless bikeshares have become.
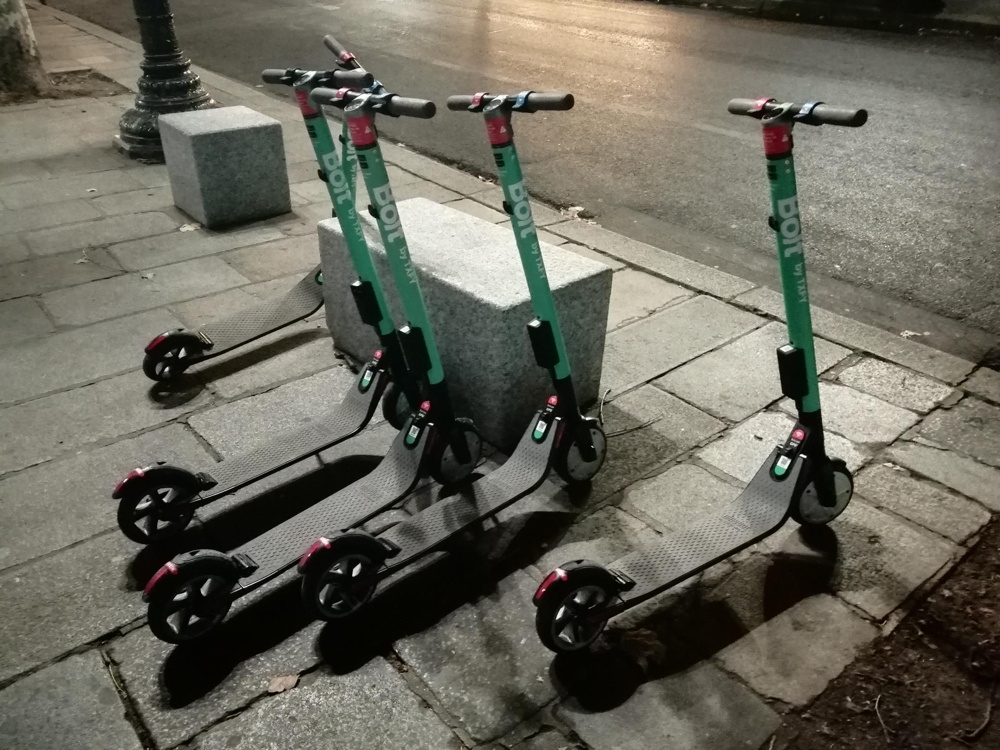
Five “Bolt” escootershare scooters – the only “group” of scooters I saw in Paris.
So in summary, from my unscientific survey, the dockless bikeshares are not really being used at all, the Limes and Birds are being well used, the new Velib is being used but not in the numbers I would have expected, and they are all generally being left tidily. I have no doubt that, in their current configuration/use level and street scene impact, the escootershares are a positive to the city. They are not cluttering the streets, and those that are there are being well used. There are too many operators, for sure, so some consolidation is needed – no one wants 6 share apps on their phone, but Lime and Bird at least have a good level of usage. It is very sad to see the Mobikes lying around unused, and with so few left, but they were a bike that was, initially at least, not properly designed for the European market. You can’t take shortcuts with new mobility solutions if you want them to actually be solutions. Maybe their lower profile approach will allow them to spot the markets where they can thrive, and give them the flexibility to adapt as necessary.
In London, we’ve moved on a bit from the autumn, where both Ofo and Mobike had retrenched considerably from June’s moment of “peak bikeshare”, even though we’re a long way behind Paris, thanks to escooters essentially being illegal both on pavements and public highways.
Mobike has expanded a little bit again, back to Ealing, although their two operating areas in London are very small. The bikes are generally now always in operator-placed groups, and while these are very visible, there are few bikes which are on their own, suggesting little use by actual genuine users. They’ve massively densified the number of bikes available in the areas, however they have attached “£20 fine for leaving bike out of zone” type stickers to all the bikes – and as these zones have changed several times since launch, I can’t blame users for not daring to use the bikes. I would not be surprised if they were seeing less than 1% of the journeys (or 10% of the j/b/d) of Santander Cycles. They also seem to struggle to monitor where their bikes actually are, or what state they are left in, as the few that are out of the operator-placed groups, are often left knocked down, for days at a time. It’s not a good look on London’s pavements, and it’s an effective way to lose the non-riding public’s sympathy unfortunately.
Ofo’s operating area didn’t shrink down as far, but unlike Mobike they haven’t restocked, so there are very few bikes to be seen anywhere in central London or the other parts of the operating area. It’s almost impossible to find one for a journey, now.
Both stolen Ofos and stolen Mobikes are appearing less often. This is probably because there are less available to steal, and the ones that were stolen are probably in very bad condition now. Occasionally you still see a youth on a stolen one, the bike sounding like it’s about to fall apart.
Lime has launched their ebikeshare in west London (Ealing, parts of which still have Mobike, and Brent, which was supposed to have had Mobike too but didn’t launch). You can’t officially therefore take Lime Bikes into central London. I don’t know if the motor cuts out if you do, but quite a few are appearing in central London anyway, and I think you may even be able to start from here (i.e. out-of-zone). Their starting price is very expensive though – £1 + 15p a minute. This means, after 3 minutes, it would have been cheaper taking the bus, tube or train. £1.50 flat rate for half an hour would have been better. But it’s a start, and though they are not escooters, unlike in Paris, the strength of the Paris operation suggests Lime knows something about how to run these.
There is also an escootershare in London! Bird have launched. However, it is only available on a single route in East London, on park land that is not covered by pavement/public road restrictions. You can scoot your “Bird” between Here East, the former London 2012 Olympic media centre which is now a start-up hub that is currently very poorly connected to tubes/trains, and Stratford station, which is incredibly well connected. Again, they are very expensive – £2.50 a ride. There is a free shuttle bus between the two points, too. So, really, it’s acting as a demonstrator. But, you have to start somewhere for escootershare in the UK and this is a start.
Santander Cycles are still not expanding, and unlikely to ever expand with TfL’s new financial woes and insistence on building very expensive permanent powered docking stations with card terminals, in a high density formation. But they did record five consecutive months this summer with over a million journeys each month. Their fleet seems to be in good working order and popular. I still think a redeployment of some docking stations further out, cheaper app-only stations, and an introduction of a Bike Angels style user rebalancing, would enhance things, but the system/contract is I suspect not set up to encourage radical innovations like this.
I look forward to 2019 as a year in which smart mobility technologies will continue to make cities better places. Look out on this blog for some exciting news, soon.
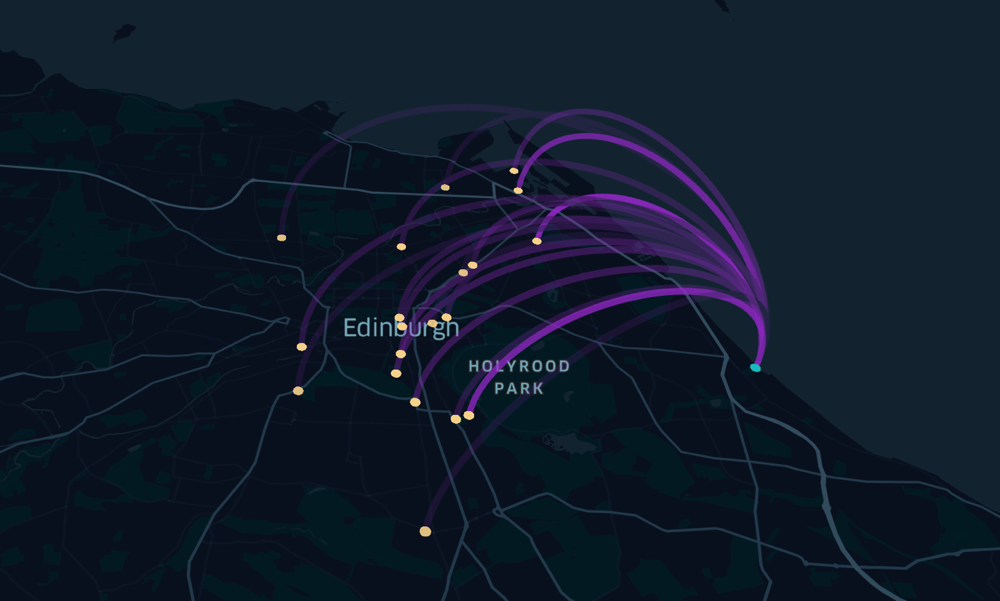
Journeys from/to a Just Eat Cycles docking station in early December, in the east of Edinburgh. Visualised in Kepler.gl. Translucency is being used to indicate multiple journeys between the same two stations.
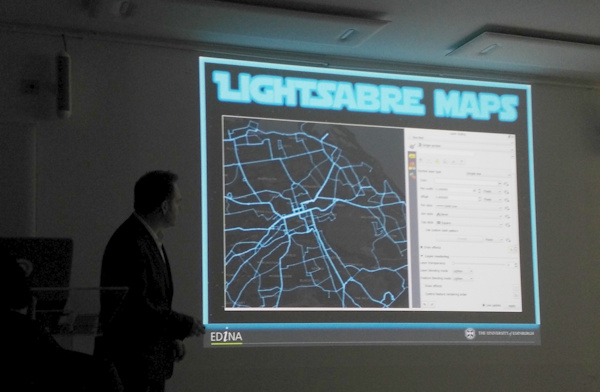
I attended and presented at the FOSS4G UK conference in central London, in early March. I was scheduled to present in the cartography track, near the end of the conference, and it ended up being an excellent session, the other speakers being Charley Glynn, digital cartographer extraordinaire from the Ordnance Survey, who talked on “The Importance of Design in Geo” and outlined the release of the GeoDataViz Toolkit, Tom Armitage on “Lightsaber Maps” who demonstrated lots of colour compositing variants and techniques (and who also took the photo at the top which I’ve stolen for this post):
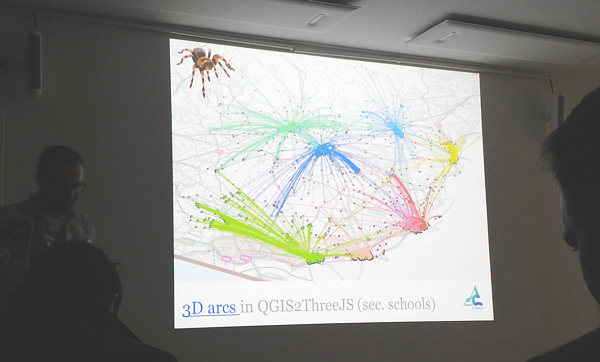
…and finally Ross McDonald took visualising school catchment areas and flows to an impressive extreme, ending with Blender-rendered spider maps:
My talk was originally going to be titled “Advanced Digital Cartography with OpenLayers 4” but in the end I realised that my talk, while presenting what would be “advanced” techniques to most audiences, would be at a relatively simple level for the attendees at FOSS4G UK, after all it is a technology conference. So, I tweaked the tittle to “Better…”. The main focus was on a list of techniques that I had used with (mainly) OpenLayers 4, while building CDRC Maps, Bike Share Map, TubeCreature and other map-based websites. I’m not a code contributor to the OpenLayers project, but I have been consistently impressed recently with the level of development going on in the project, and the rate at which new features are being added, and was keen to highlight and demonstrate some of these to the audience. I also squeezed on a bonus section at the end about improving bike share operating area maps in London. Niche, yes, but I think the audience appreciated it.
My slides (converted to Google Slides):
Some notes:
My OpenLayers 2/Leaflet/OpenLayers 3+4 graphic near the beginning was to illustrate the direction of development – OpenLayers 2 being full-featured but hard to work with, Leaflet coming in as a more modern and clean replacement, and then OpenLayers 3 (and 4 – just a minor difference between the two) again being an almost complete rewrite of OpenLayers 2. Right now, there’s a huge amount of OpenLayers 4 development, it has momentum behind it, perhaps even exceeding that of Leaflet now.
Example 2 is from SIMD – and there are other ways to achieve this in OpenLayers 4.
Examples 5, 6 and 9 are from TubeCreature, my web map mashup of various London tube (and GB rail) open datasets.
Regarding exmaple 6, someone commented shortly after my presentation that there is a better, more efficient way to apply OpenLayers styles to multiple elements, negating my technique of creating dedicated mini-maps to act as key elements.
Example 7 is from Bike Share Map, it’s a bit of a cheat as the clever bit is in JSTS (a JS port of the Java Topology Suite) which handily comes with an OpenLayers parser/formatter.
Example 8, which is my London’s New Political Colour, a map of the London local elections, is definitely a cheat as the code is not using the OpenLayers API, and in any case the map concerned is still on OpenLayers 2. However it would work fine on OpenLayers 4 too, particularly as colour values can be specified in OpenLayers as simply as rgba(0, 128, 255, 0.5).
Finally, I mention cleaning the “geofences” of the various London bikeshare operators. I chose Urbo, who run dockless bikeshare in North-East London, and demonstrated using Shapely (in Python) to tidy the geofence polygons, before showing the result on the (OpenLayers-powered) Bike Share Map. The all-system London map is also available.
FOSS4G UK was a good meeting of the “geostack” community in London and the UK/Europe, it had a nice balance of career technologists, geospatial professionals, a few academics, geo startups and people who just like hacking with spatial data, and it was a shame that it was over so quickly. Thanks to the organising team for putting together a great two days.
I presented at the BikePlus Future of Bike Share Conference in Manchester in late September, as part of a panel session on social benefits of public Bike Share Data. I framed my presentation in the context of open data, whereby operators or technology providers of bikeshare systems, and/or municipalities containing them, release data on the systems on an open data basis, allowing unrestricted analysis and reuse of the data. This is distinct from controlled access to the data, where typically an operator provides data to a local council in exchange for the authority’s blessing/cooperation/support.
The main part of the talk was in five sections, each outlining a social benefit of public data for bikeshare:
Academic research, including themes such as urban mobility, multi-modal journeys, health outcomes
Creating “app” ecosystems around a bikeshare – making greater and better use of often publicly financed systems, by the public.
Effective targeting of cycling infrastructure – understanding where the users go so that infrastructure investments are beneficial.
Improved public visibility – Press coverage and helping with public acceptance of a private business using publically owned assets (i.e. pavement space).
Better management – novel visualisations of fleet and activity, and enabling easy experimentation of new redistribution strategies devised by specialists.
The final part of the presentation was a research and data summary from my perspective, and a wishlist. In particular, I mentioned and enthused on GBFS, an emerging, operator-led standard format for bikeshare data, which will likely be useful for integrating bikeshare with independent multi-city journey planners (e.g. Google Maps, CityMapper) – and useful for me too in managing data feeds from over 250 cities currently, in Bike Share Map.
My presentation can be viewed here:
The conference also included a led ride around some of Manchester’s key cycle infrastructure, including the Oxford Road segregated lanes. The bikeshare bikes provided for the ride were dockless bikes supplied by Ofo (who run UK systems in Cambridge and Hackney, London, as well as various other locations around the world) and Urbo (a new Irish start-up who are adopting the Chinese dockless model and bringing their bikes to Waltham Forest, also in London, launching at the end of October).
Below is a presentation that combines my talks last Thursday and Friday at the Smart Mobility forums in central Mexico City, organised by ITDP Mexico and funded by the Foreign and Commonwealth Office’s Prosperity Fund (respresented by the British Embassy in Mexico). The Thursday presentation focused on the third-party app ecosystem that exists around bikesharing in London and elsewhere, while the Friday presentation included more examples of private sector innovation using open data:
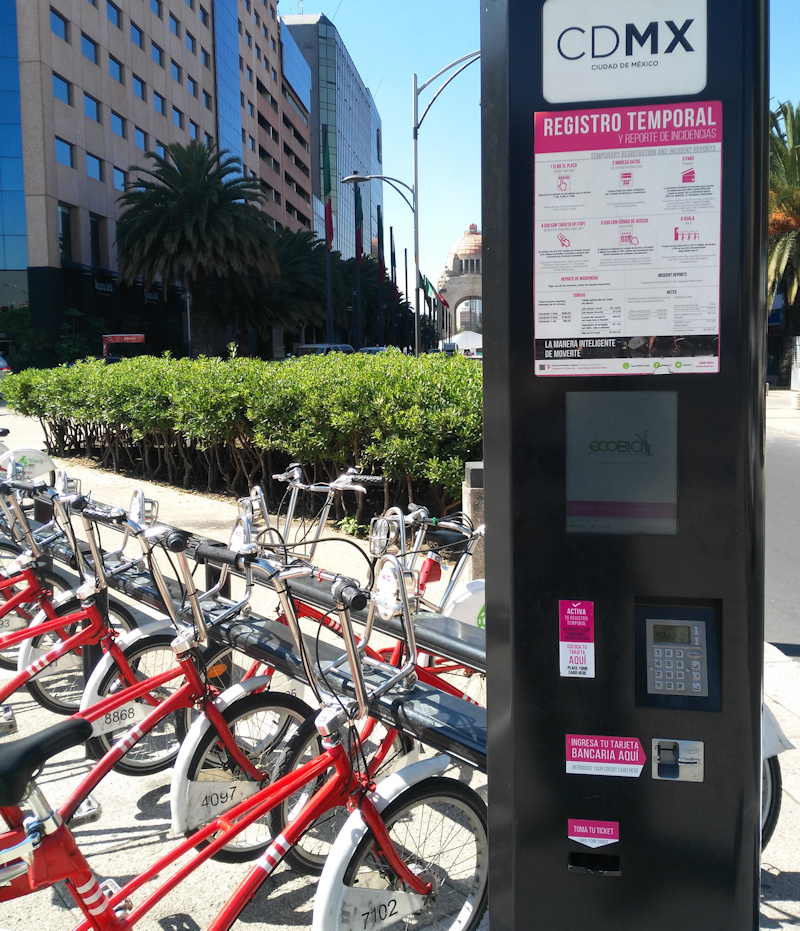
My week in Mexico City also included a visit to CIC at IPN (the computational research centre city’s main polytechnic) where I was introduced to a product building visualisations of ECO-BICI data to help create more effective strategies for redistribution. I also visited LabCDMX, a research group and ideas hub to study Mexico City that has been created by the city government, to give a couple of talks in their rooftop on visualising London transit and a summary of web mapping technologies. The organisers also squeezed in a couple of short TV interviews, including Milenio Noticias (23 minutes in). The week ended with a tour of the ECO-BICI operations, repair, management and redistribution warehouse, located centrally and a hive of activity. This included a look at their big-screen redistribution map and vehicle routing system.
November is shaping up to be a very busy month for me, in terms of giving talks – I will have presented 13 times by the end of the month. I appreciate that lecturers might not agree that this is a particular busy month! Anyway, here’s a list of them:
1 November – CDRC Maps: Introduction and Impact (10m) Audience: ESRC/Moore-Sloan Meeting
3 November – Guest Lecture & Practical: Web Mapping (60m + 2h) Audience: Second Year Geography Undergraduates at UCL
9 November – Research Lab Update: Worldnames & CDRC Maps (3m) Audience: Jack Dangermond Keynote Lecture at UCL
11 November – London: Visualising the Moving City (30m) Audience: EU COST Action London meeting
15 November – CDRC Maps: Introduction (5m) Audience: Academic visitors from South Korea
17 November – London: Visualising the Moving City (60m) Audience: Geospatial Seminar Series (UCL CEGE)
22 November – Data visualisation for Bikeshare Systems (60m) Audience: CIC-IPN staff and students (Mexico City)
22 November – Web Mapping (60m) Audience: CIC-IPN students (Mexico City)
23 November – London: Visualising the Moving City (60m) Audience: Public officials and students (Mexico City)
23 November – Data visualisation design workshop (60m) Audience: ITDP staff (Mexico City)
24 November – Third-party App Ecosystems using Open Data (45m) Audience: Public officials (Mexico City)
25 November – Open Data and Innovation for the Private Sector (60m) Audience: Small businesses (Mexico City)
28 November – CDRC Maps: Introduction (5m) Audience: Academic visitors from Japan
I have also contributed material for a further talk given by a colleague – an introduction to geodemographics in the UK, for the Brazil governmental statistical service.
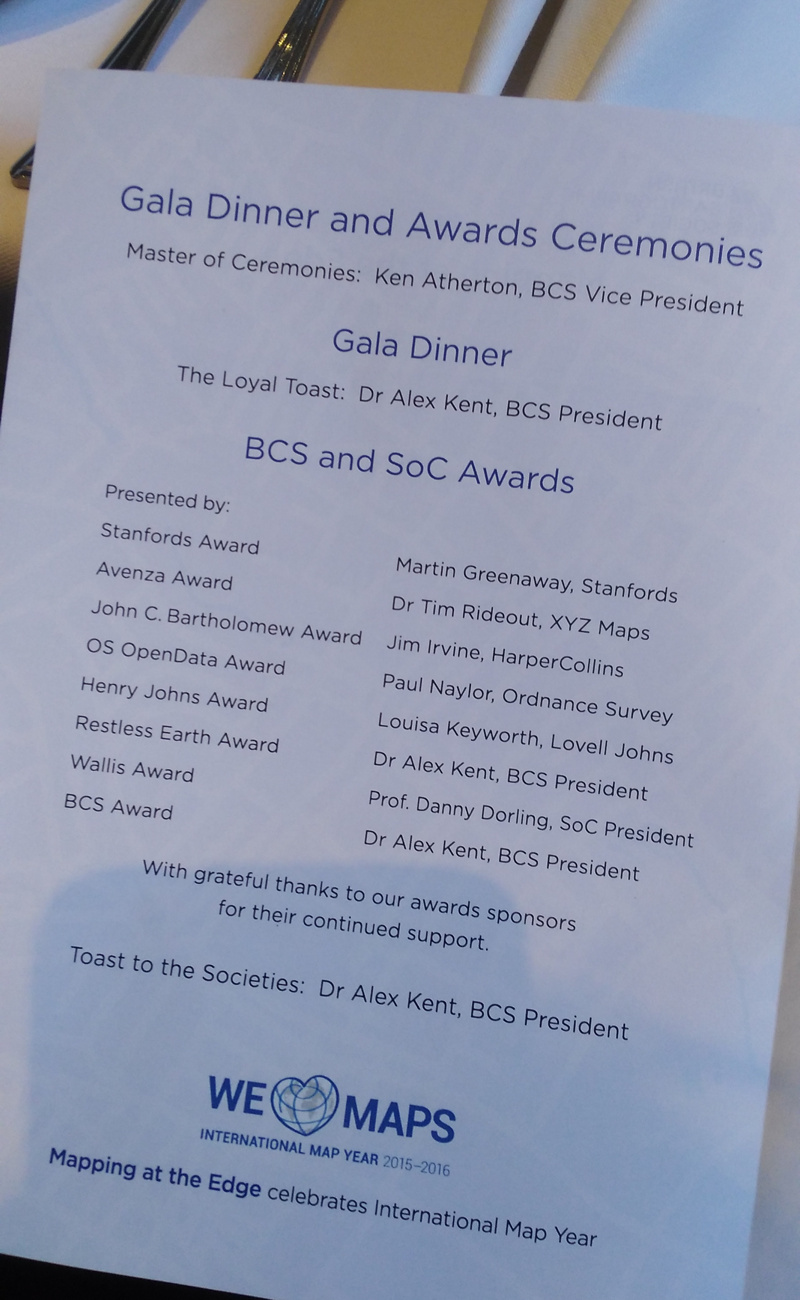
The British Cartography Society and Society of Cartographers* once again combined their two annual conferences together, for a two-day meet in Cheltenham in early September. After last year’s win for the DataShine website, I was there in a more passive capability, although my colleague Dr Cheshire, who collected a trio of prizes last year, presented on why cartographers should learn to code too – see his talk summary.
I like the BCS conference format – it’s quite a small conference, so there’s only two streams, unlike many trade-focused conferences the trade exhibits don’t dominate the space, instead the talks themselves are the main focus. The residential nature of the conference also promotes a relaxed feel. Stand-out talks for me included Ross McDonald‘s excellent summary of new features in QGIS 2.14, Dr Cheshire’s talk about cartographers needing to code, and finally a walkthrough on creating an impressive relief map using Blender 3D, from Steven Bernard of the FT.
A highlight was the awards ceremony – and not just because of last year’s win. Every Person in Scotland Mapped won the Ordnance Survey Open Data award. This simple but effective visualisation assigns each person in Scotland to a dot in a housing block, as represented in OS OpenMap Local, filtering out non-residential buildings. It combines population density information from the census, with area information for each block.
There is an accompanying exhibition, showing the various entrants for the awards – this is a highlight for me, because it’s great to see many novel printed maps in the same place, many showing innovative ideas. You can’t beat a good large-print map. I particularly liked the GIS-powered reimagining of two classic Ordnance Survey mapping styles with modern datasets, by Charley Glynn of the OS – there’s a 19th century London style brought up to date, but my favourite is a reworking of the 1960s OS “Quarter Inch” style with the strong colours for mountains. It always looked good in Scotland, and Charley has produced a version with modern data for the West Highlands – see the extract above. You can buy it from the OS shop online.
I would love to see this idea expanded to cover the whole of the UK – a key of course is to have it all automatically generated. The human cartographer’s input is still required for label positioning etc – the “last 10%” of the effort is still manual.
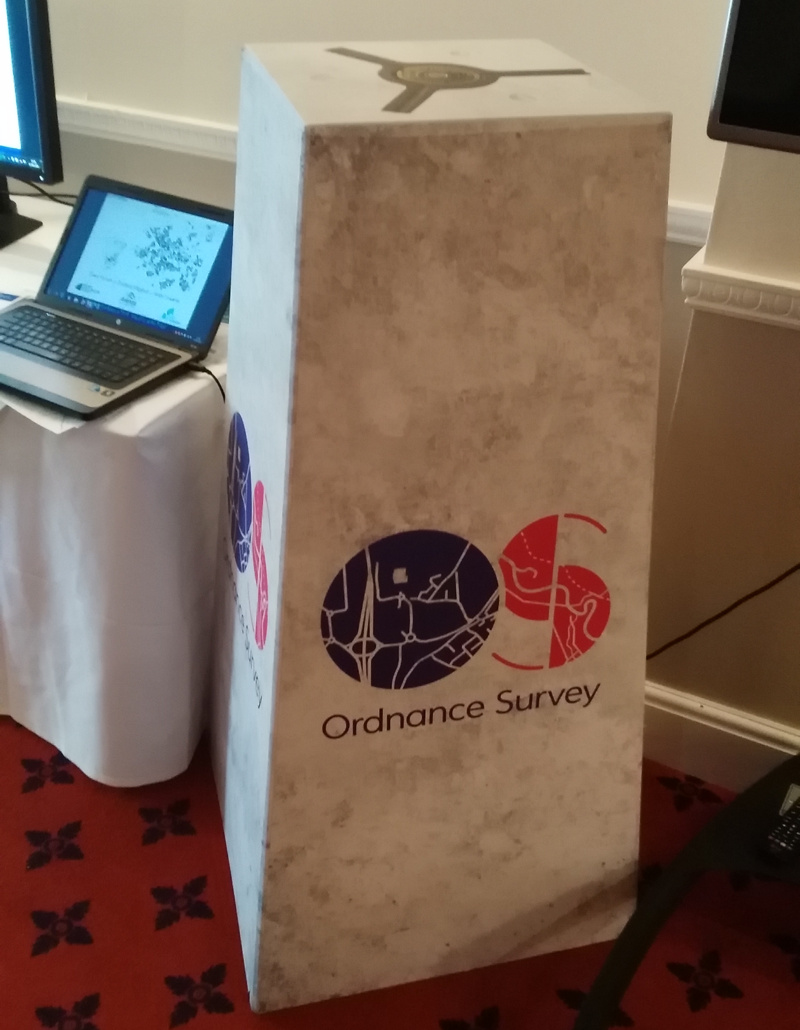
I also liked the pop-up trig point at the OS stand:
* It is a curiosity that there are two national bodies representing cartographers in the UK, especially considering that the field is quite small anyway. The BCS is larger and more industry focused, while SoC is smaller and more academia focused. It’s great to see both bodies coordinating their annual conference to be the same event, as happened last year and this year – long may it continue.
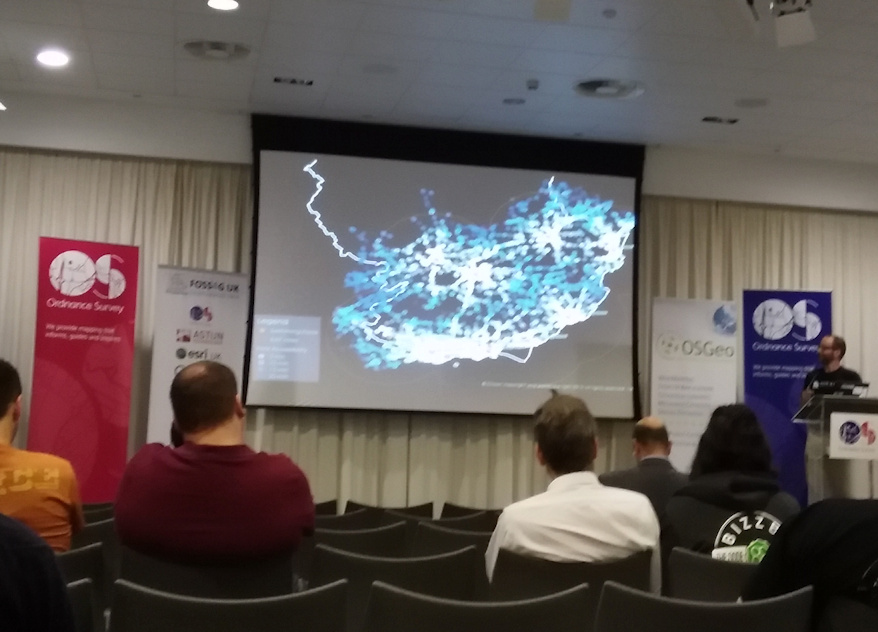
I was at FOSS4G UK 2016 which took place at the new Ordnance Survey buildings in Southampton, a few weeks ago. FOSS4G is short for “Free and Open Source Software for Geospatial”, and the conference focuses on some of the key free GIS software such as QGIS and PostGIS. This was a UK-focused event, following on from the global FOSS4G in Nottingham in 2013, which I was also at. (The next FOSS4G is in Germany in August.)
The OS is a little hard to get to if you aren’t driving there – I ended up cycling right through Southampton from the central station. Once on site though, it’s a lovely new venue, light and airy inside, with the floors and desks of OS cartographers and digital information managers sweeping away to one side of the central atrium, while the conference took place in a couple of large rooms on the other side. Breakout was overlooking the atrium (above). Around 180 people attended, split into two conference streams.
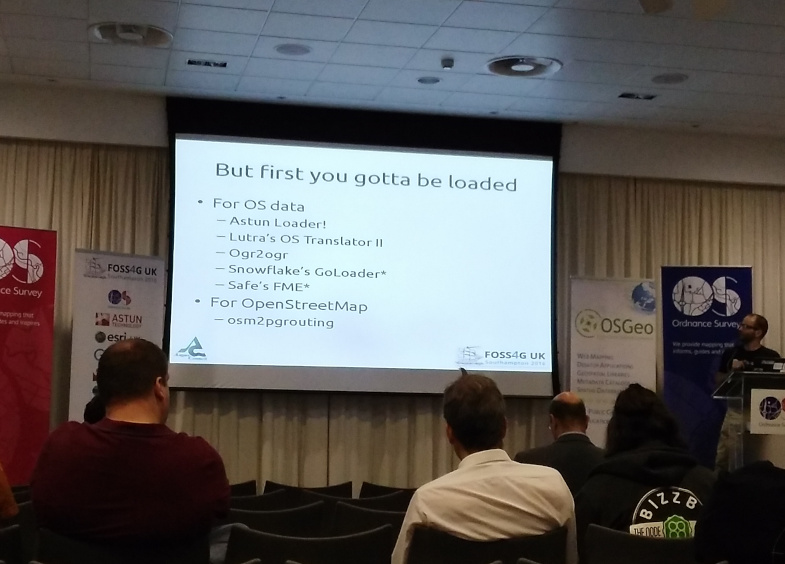
Highlights included:
Above: A nice demo of pgRouting usage from Angus Council who’ve switched to open source for asset access mapping. Open and effective code and mapping in a practical, real world context.
Above: The software used for the Angus Council asset project.
Above: Add Ordnance Survey Landranger-style hill chevrons to your GIS-created digital maps with this nice bit of code. I love these kinds of talks/demos, which you typically only get at these enthusiast/community-driven meetings like FOSS4G UK. Really interesting bits of code or hacks, demonstrated by the creator who did it just because they thought it would be cool.
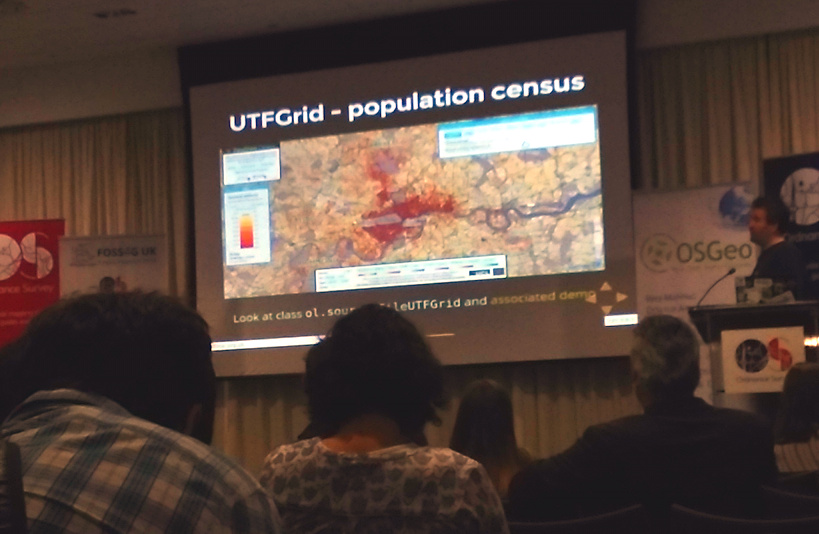
Above: I was pleased also to see DataShine getting a mention, specifically its use of OpenLayers UTFGrid for the attribute mouseovers. The talk was by a FOSS/OpenLayers consultant who’s written a book about the mapping platform, which powers most of my web maps. It’s always flattering to get mentions like this, especially as the speaker was probably unaware I was in the audience!
Outside in the atrium there was a mini-exhibition by the talk sponsors, including, intriguingly, ESRI UK, who are presumably keeping an eye on the FOSS4G community, their core business being far from open source (software), even if they have been very keen on demonstrating their products operating on open data.
FOSS4G UK was an interesting and useful couple of days, pulling together the professional and enthusiast geospatial community in the UK to see what’s happening in the space, and a good opportunity to network.
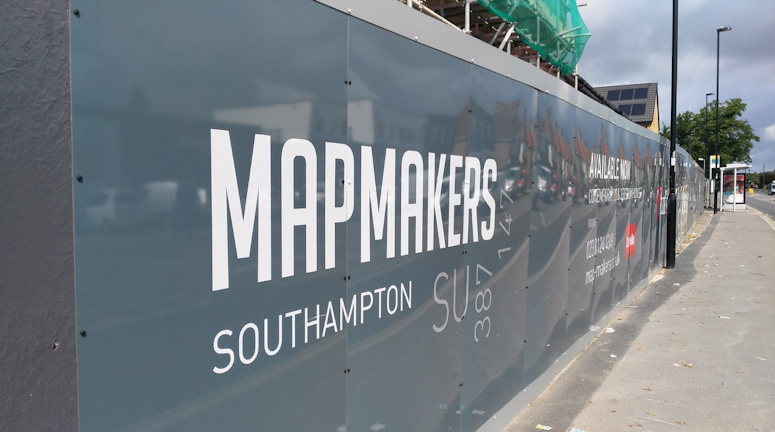
Above: “MapMakers”, a housing development next to the old Ordnance Survey office, which is on the way to the new one from the station. The inclusion of the OS grid reference is a nice touch.