Many of London’s tube stations act as a focal point for the community they serve, and some times even give end up giving the area it’s name (Angel and Northwood Hills being two examples – one named after a pub/tea-house and one the winning entry in a competition). But some are just wrong and need to be renamed!
Here’s my list of offenders – I’ve looked at the Tube network itself, so this list includes a few tube stations that are beyond the London boundary:
Watford – should be West Watford to reflect it only serves the suburb in the west part of this large town and in no way is near the centre (try Watford High Street for that).
Harrow & Wealdstone – is very definitely in, and so should be, Wealdstone, and it’s quite far from Harrow itself. Speaking of Harrow:
Harrow-on-the-Hill is very definitely at the bottom of the hill, which is its own distinct area. So, Harrow would be a much better name.
Turnham Green is far from Turnham Green (which is closer to Chiswick Park station). Ideally it would be called Chiswick but you’d maybe have to change the National Rail station of the same name too – maybe that could be Chiswick South?
Euston Square needs to get changed back to Gower Street. It’s on Gower Street and Warren Street is much closer to Euston Square.
Mansion House is nowhere near Mansion House and would better be called Bow Lane.
Hillingdon should be North Hillingdon. Hillingdon village is a long way to the south.
Honorary mentions (not a tube station but on the tube map):
West Drayton is actually in the urban centre of Yiewsley with West Drayton itself being some way to the south.
Hayes & Harlington should be Hayes as Harlington is some distance away, and on the other side of the M4 too.
Carpenter’s Park should be South Oxhey as this is much larger than the (older) development on the other side.
Bushey should be Oxhey – it did used to be called Bushey & Oxhey, but Bushey, while being much bigger, is a long way up the hill, while Oxhey village is adjacent.
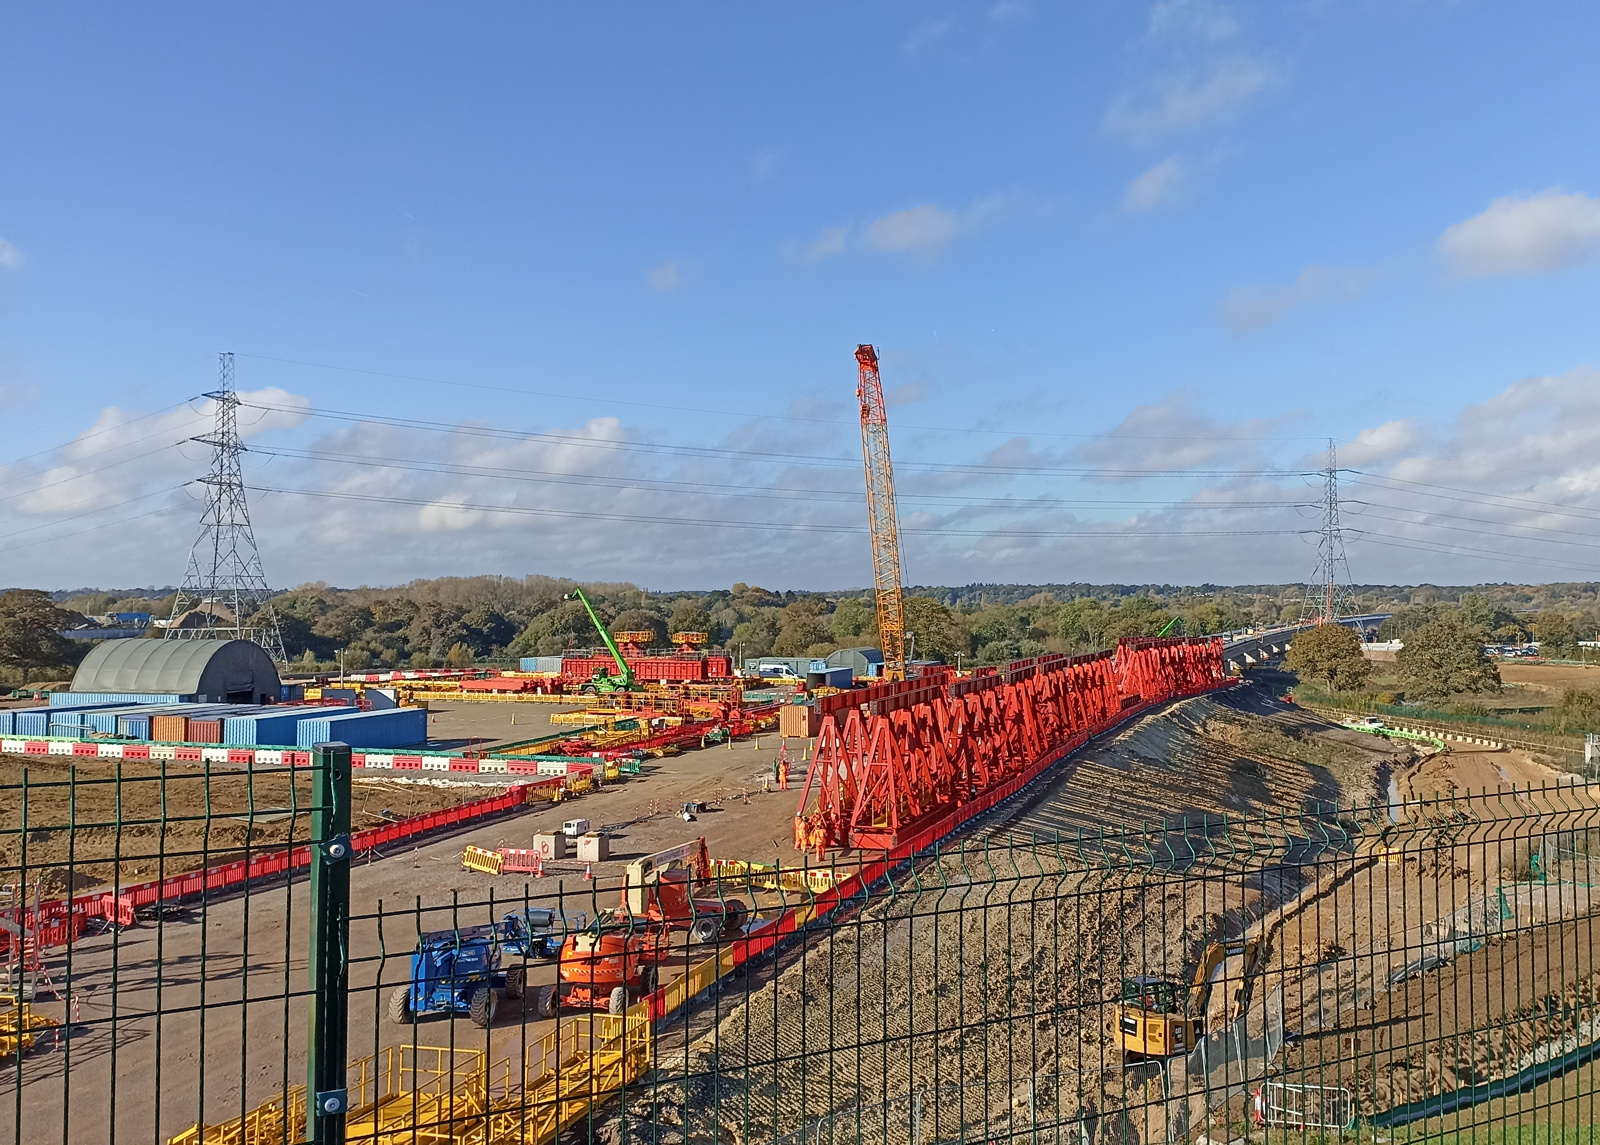
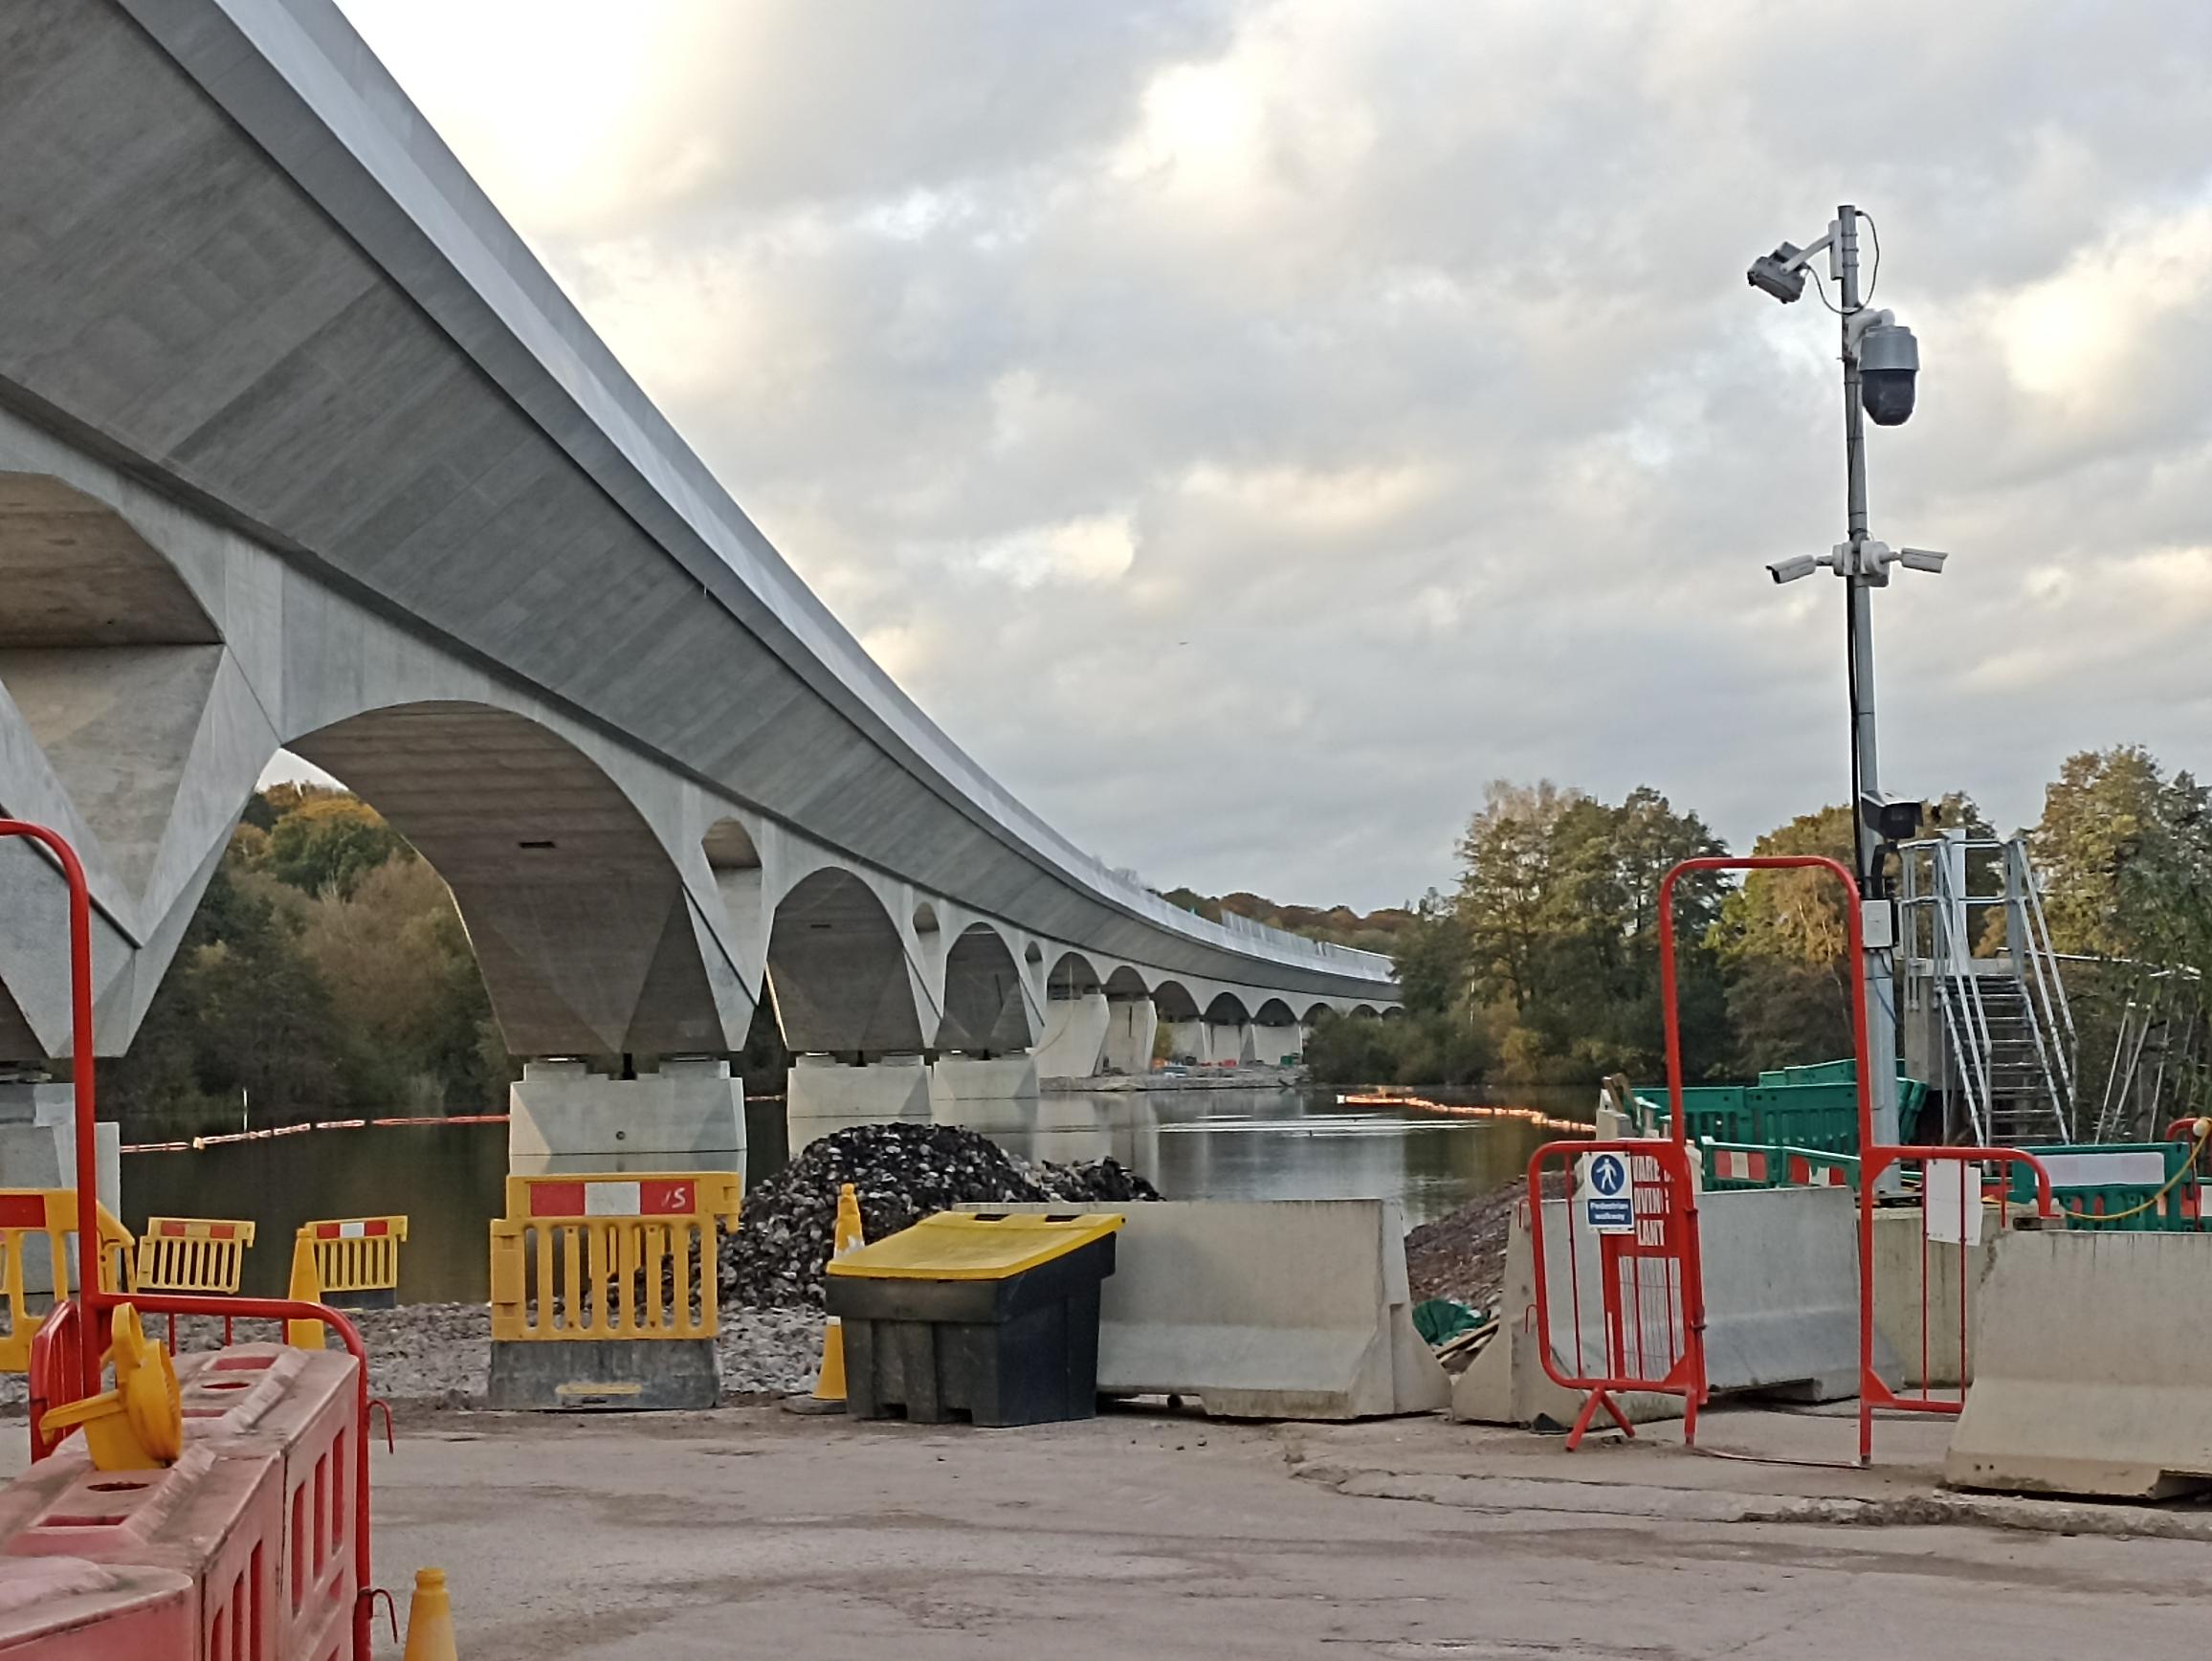
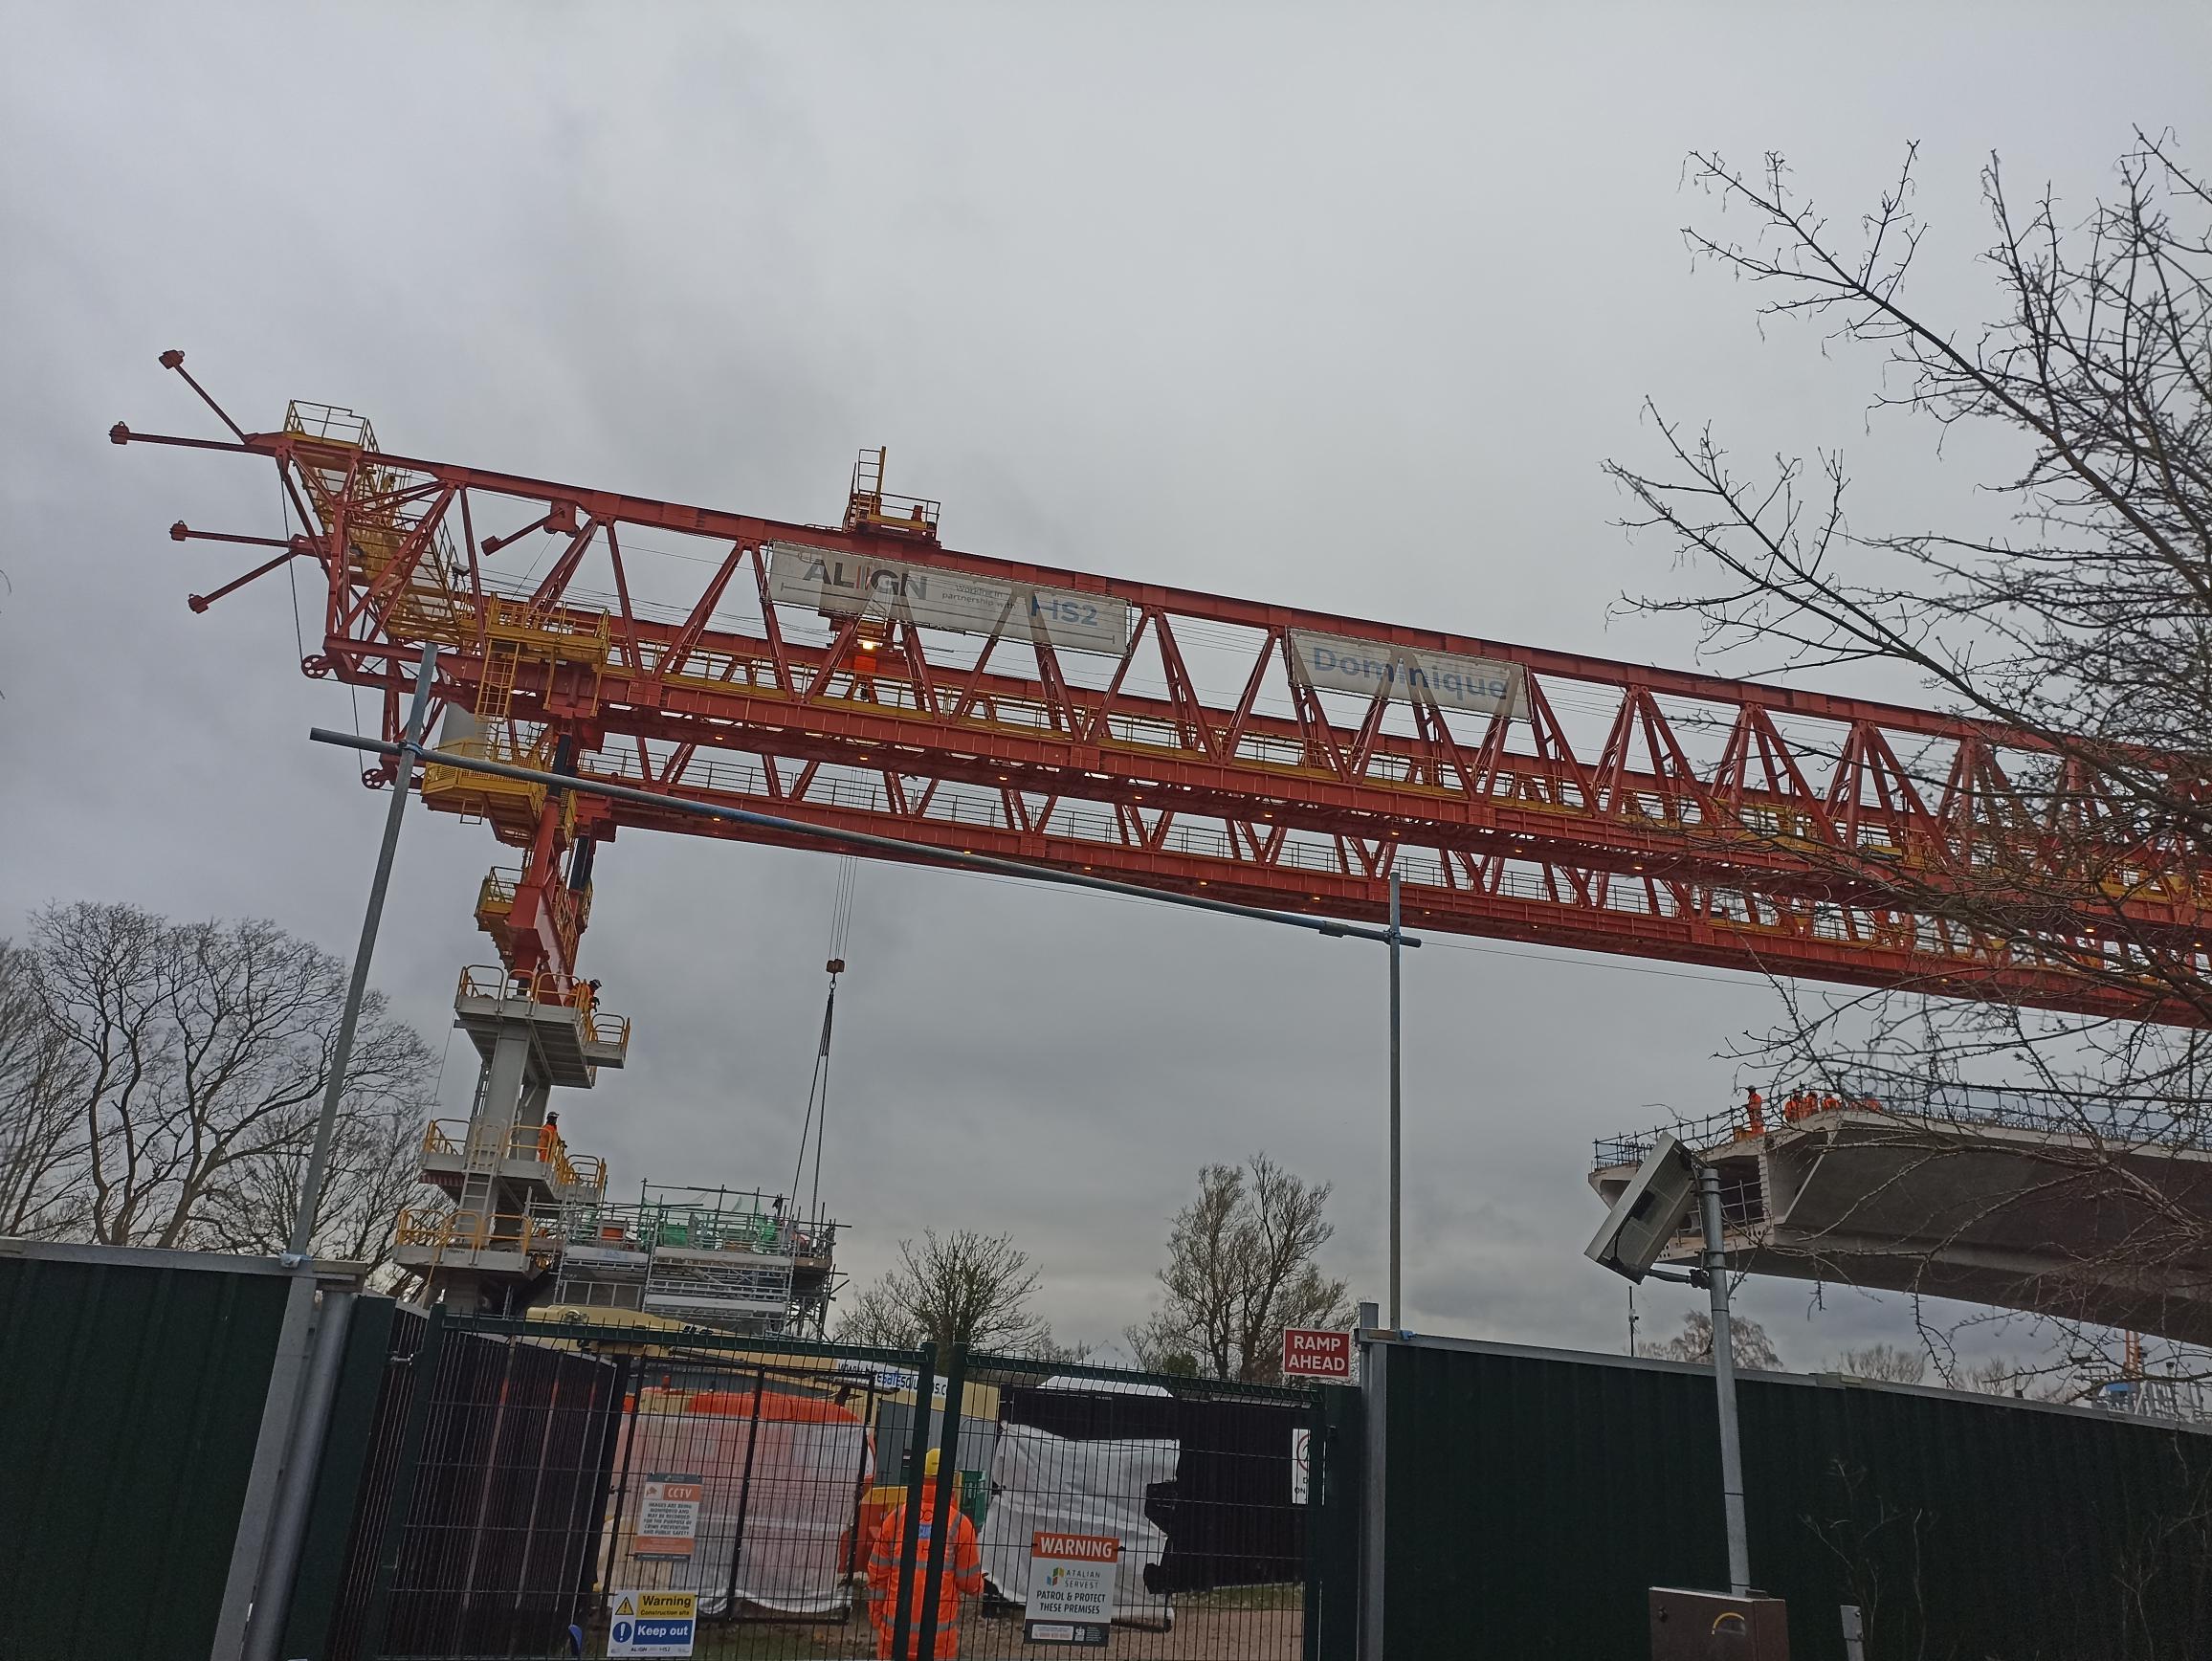
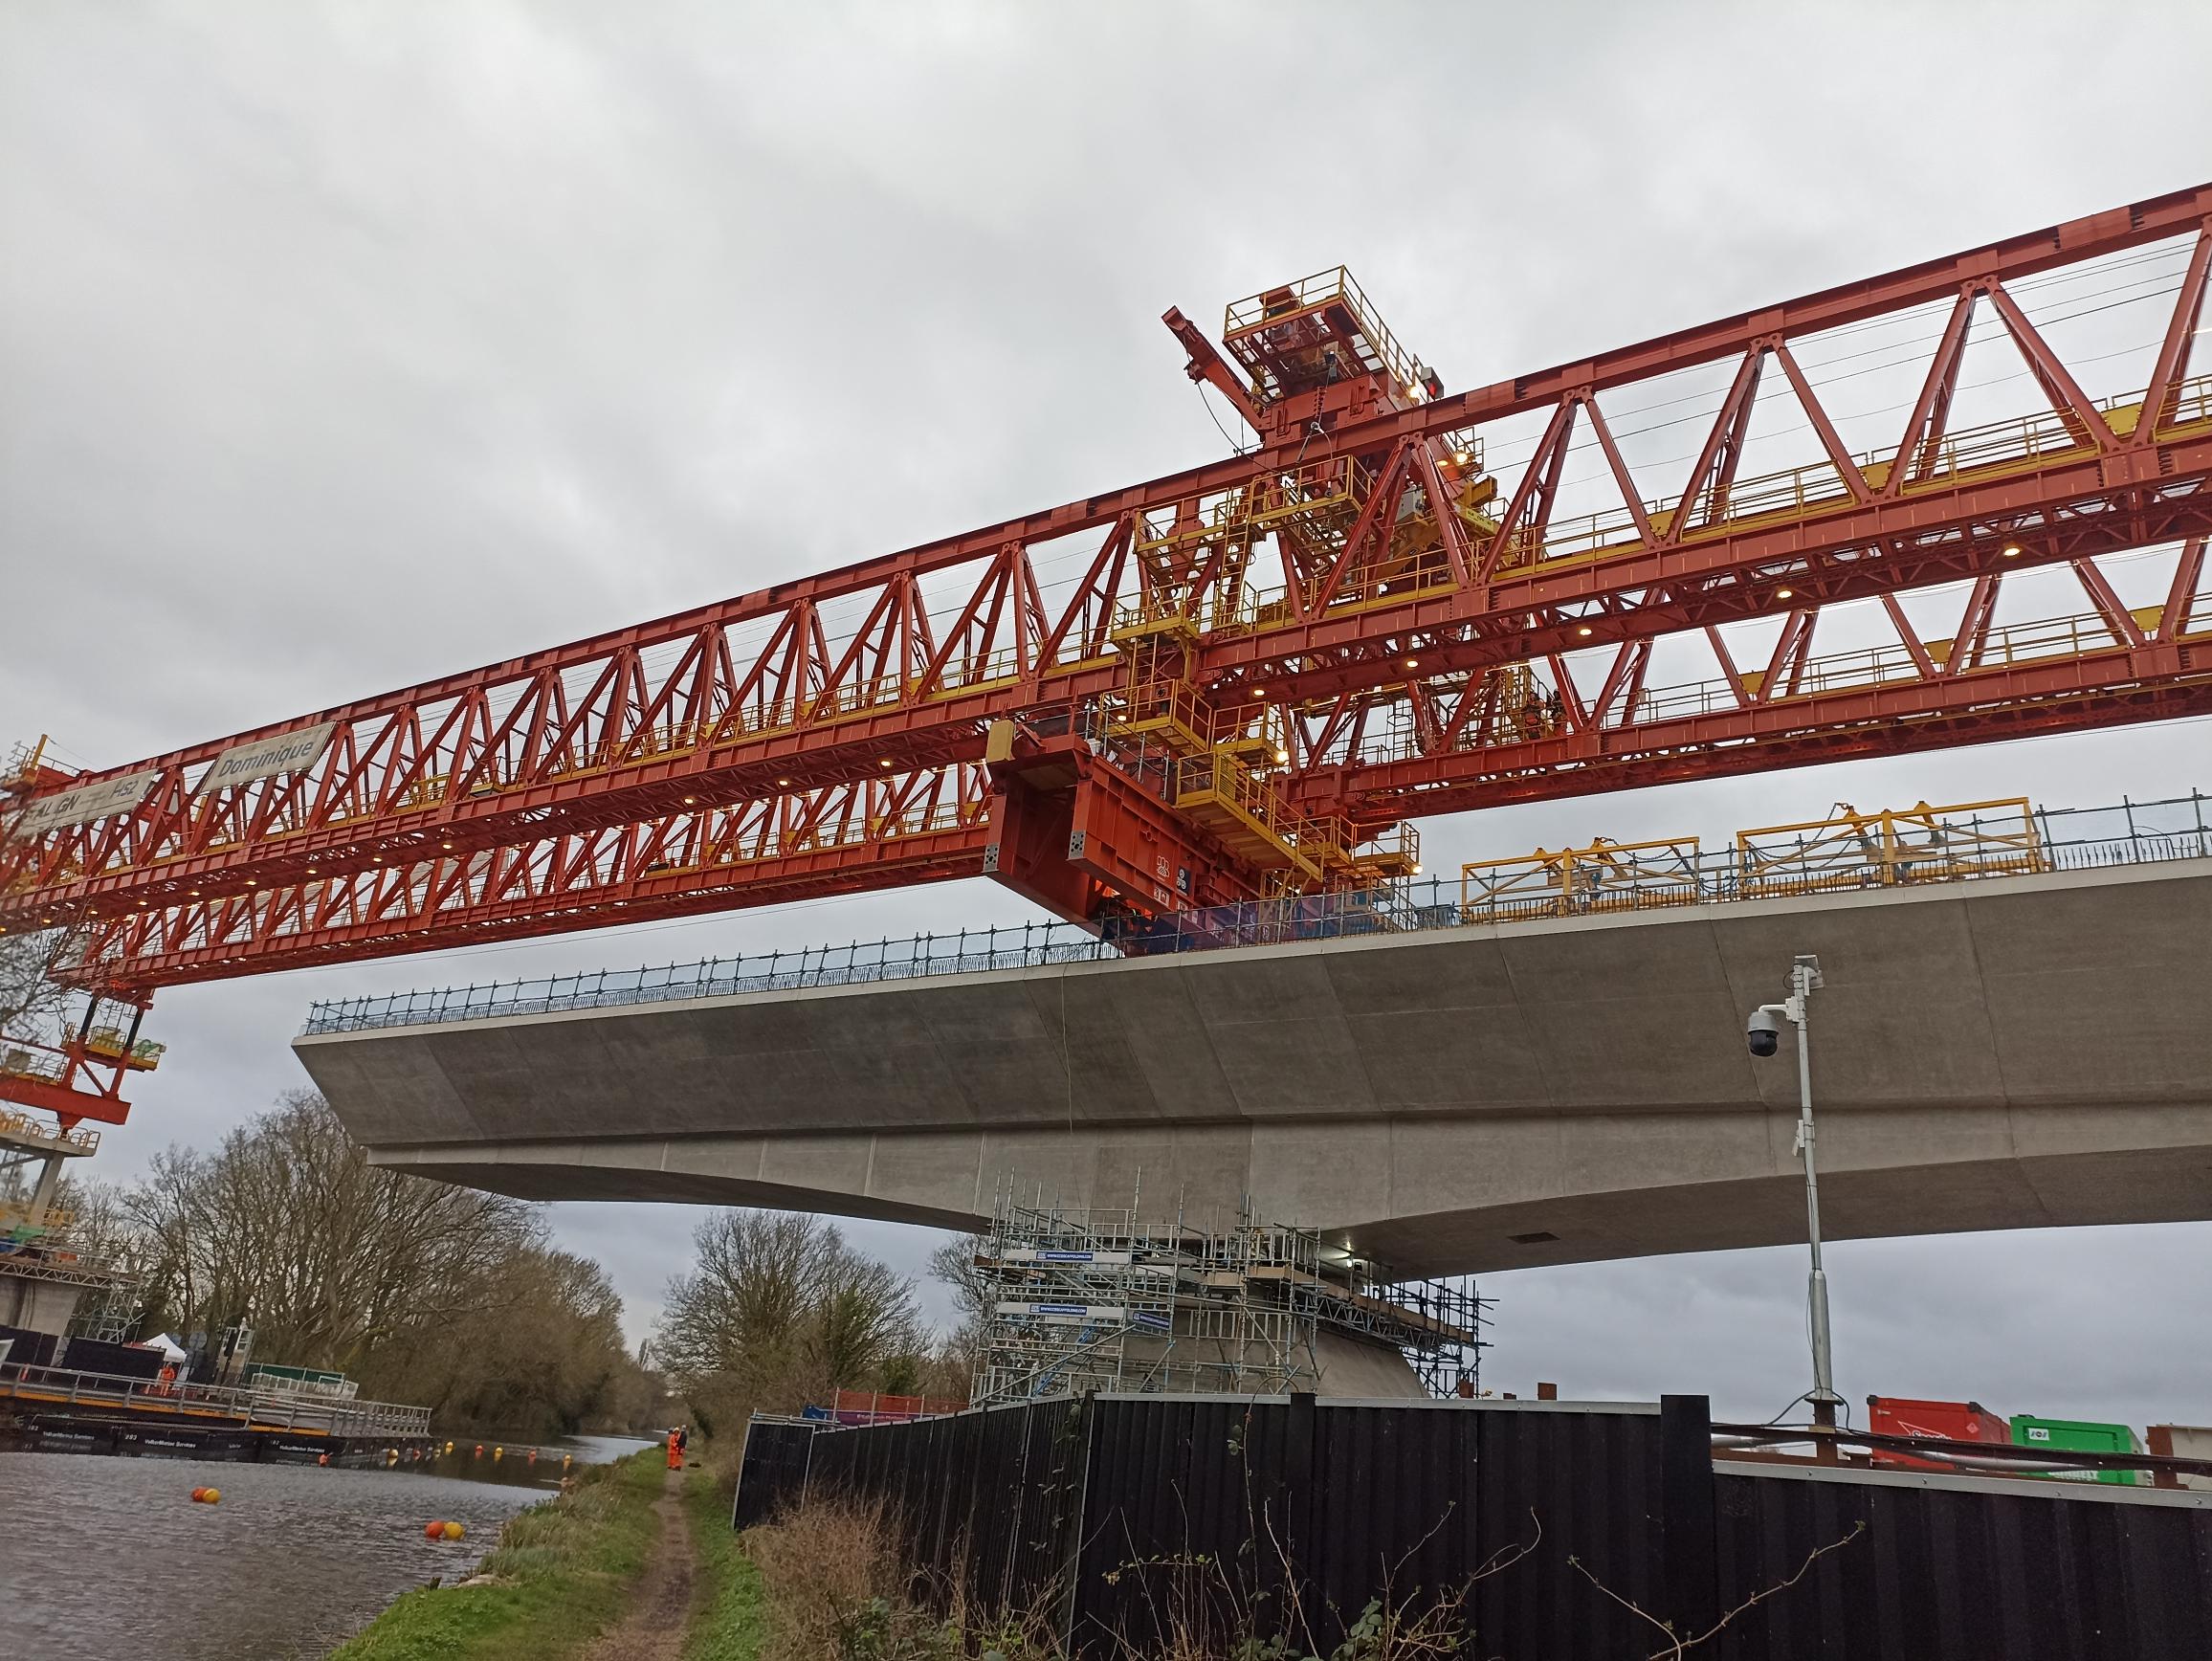
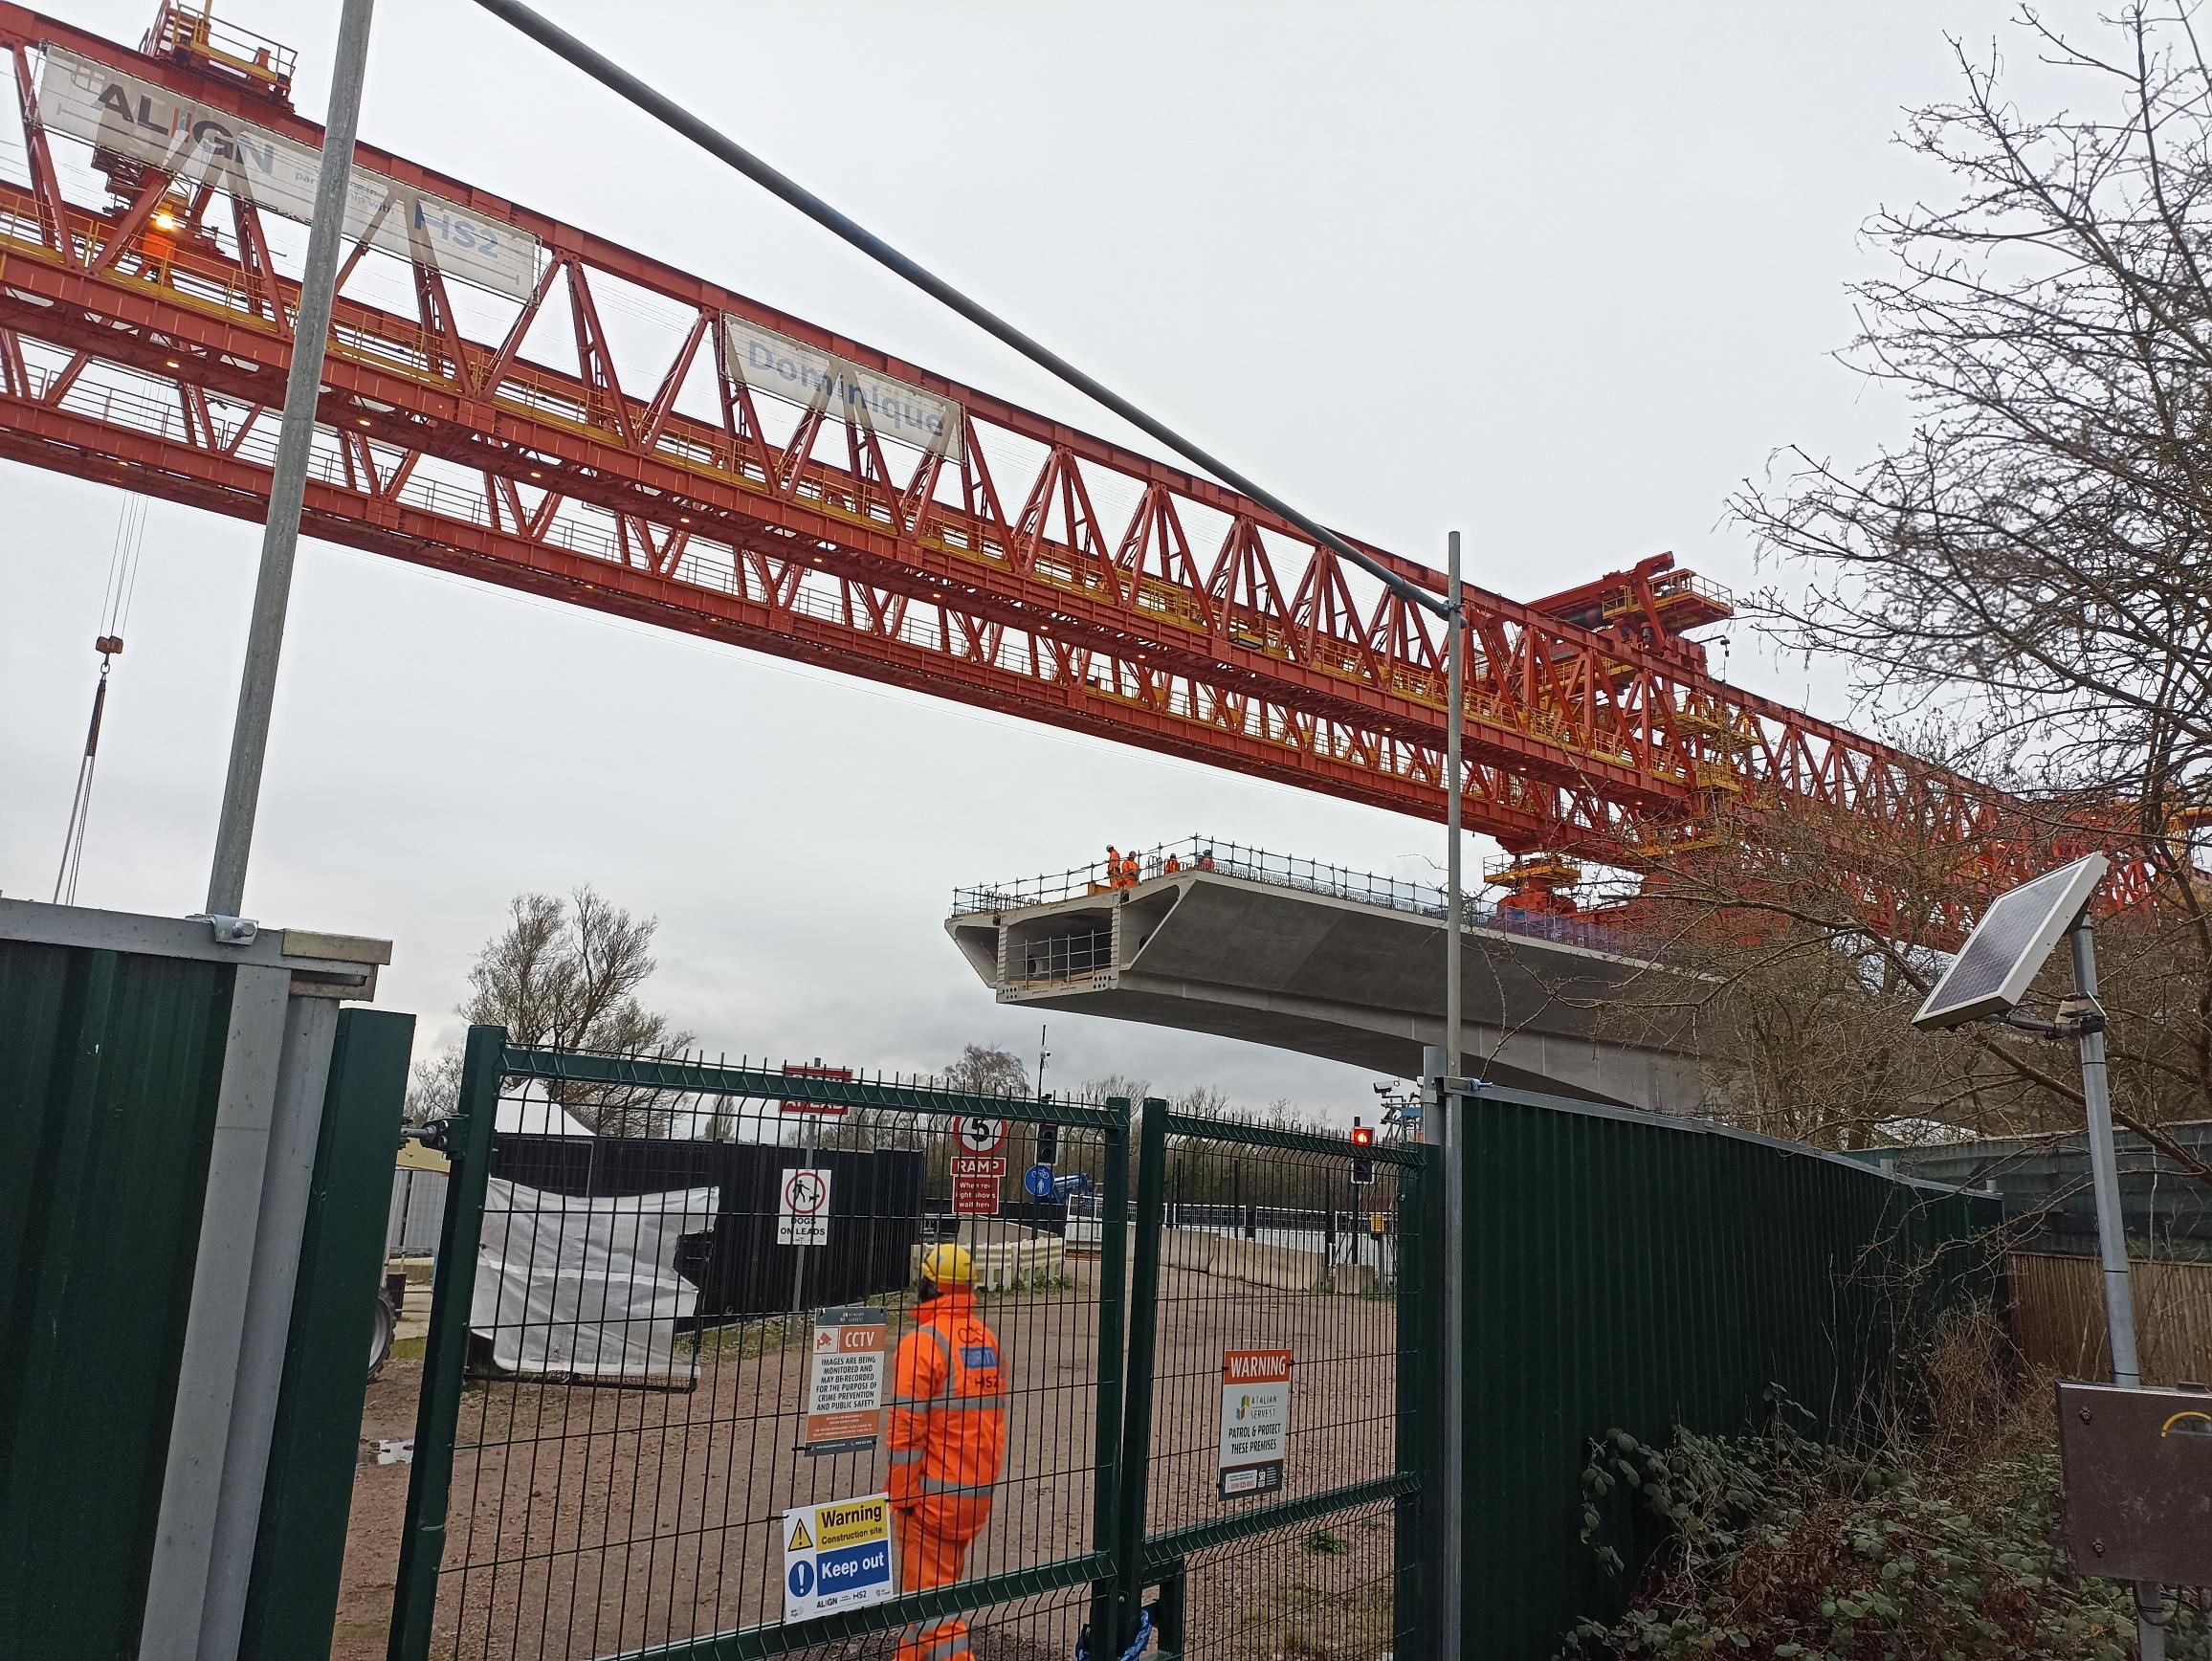
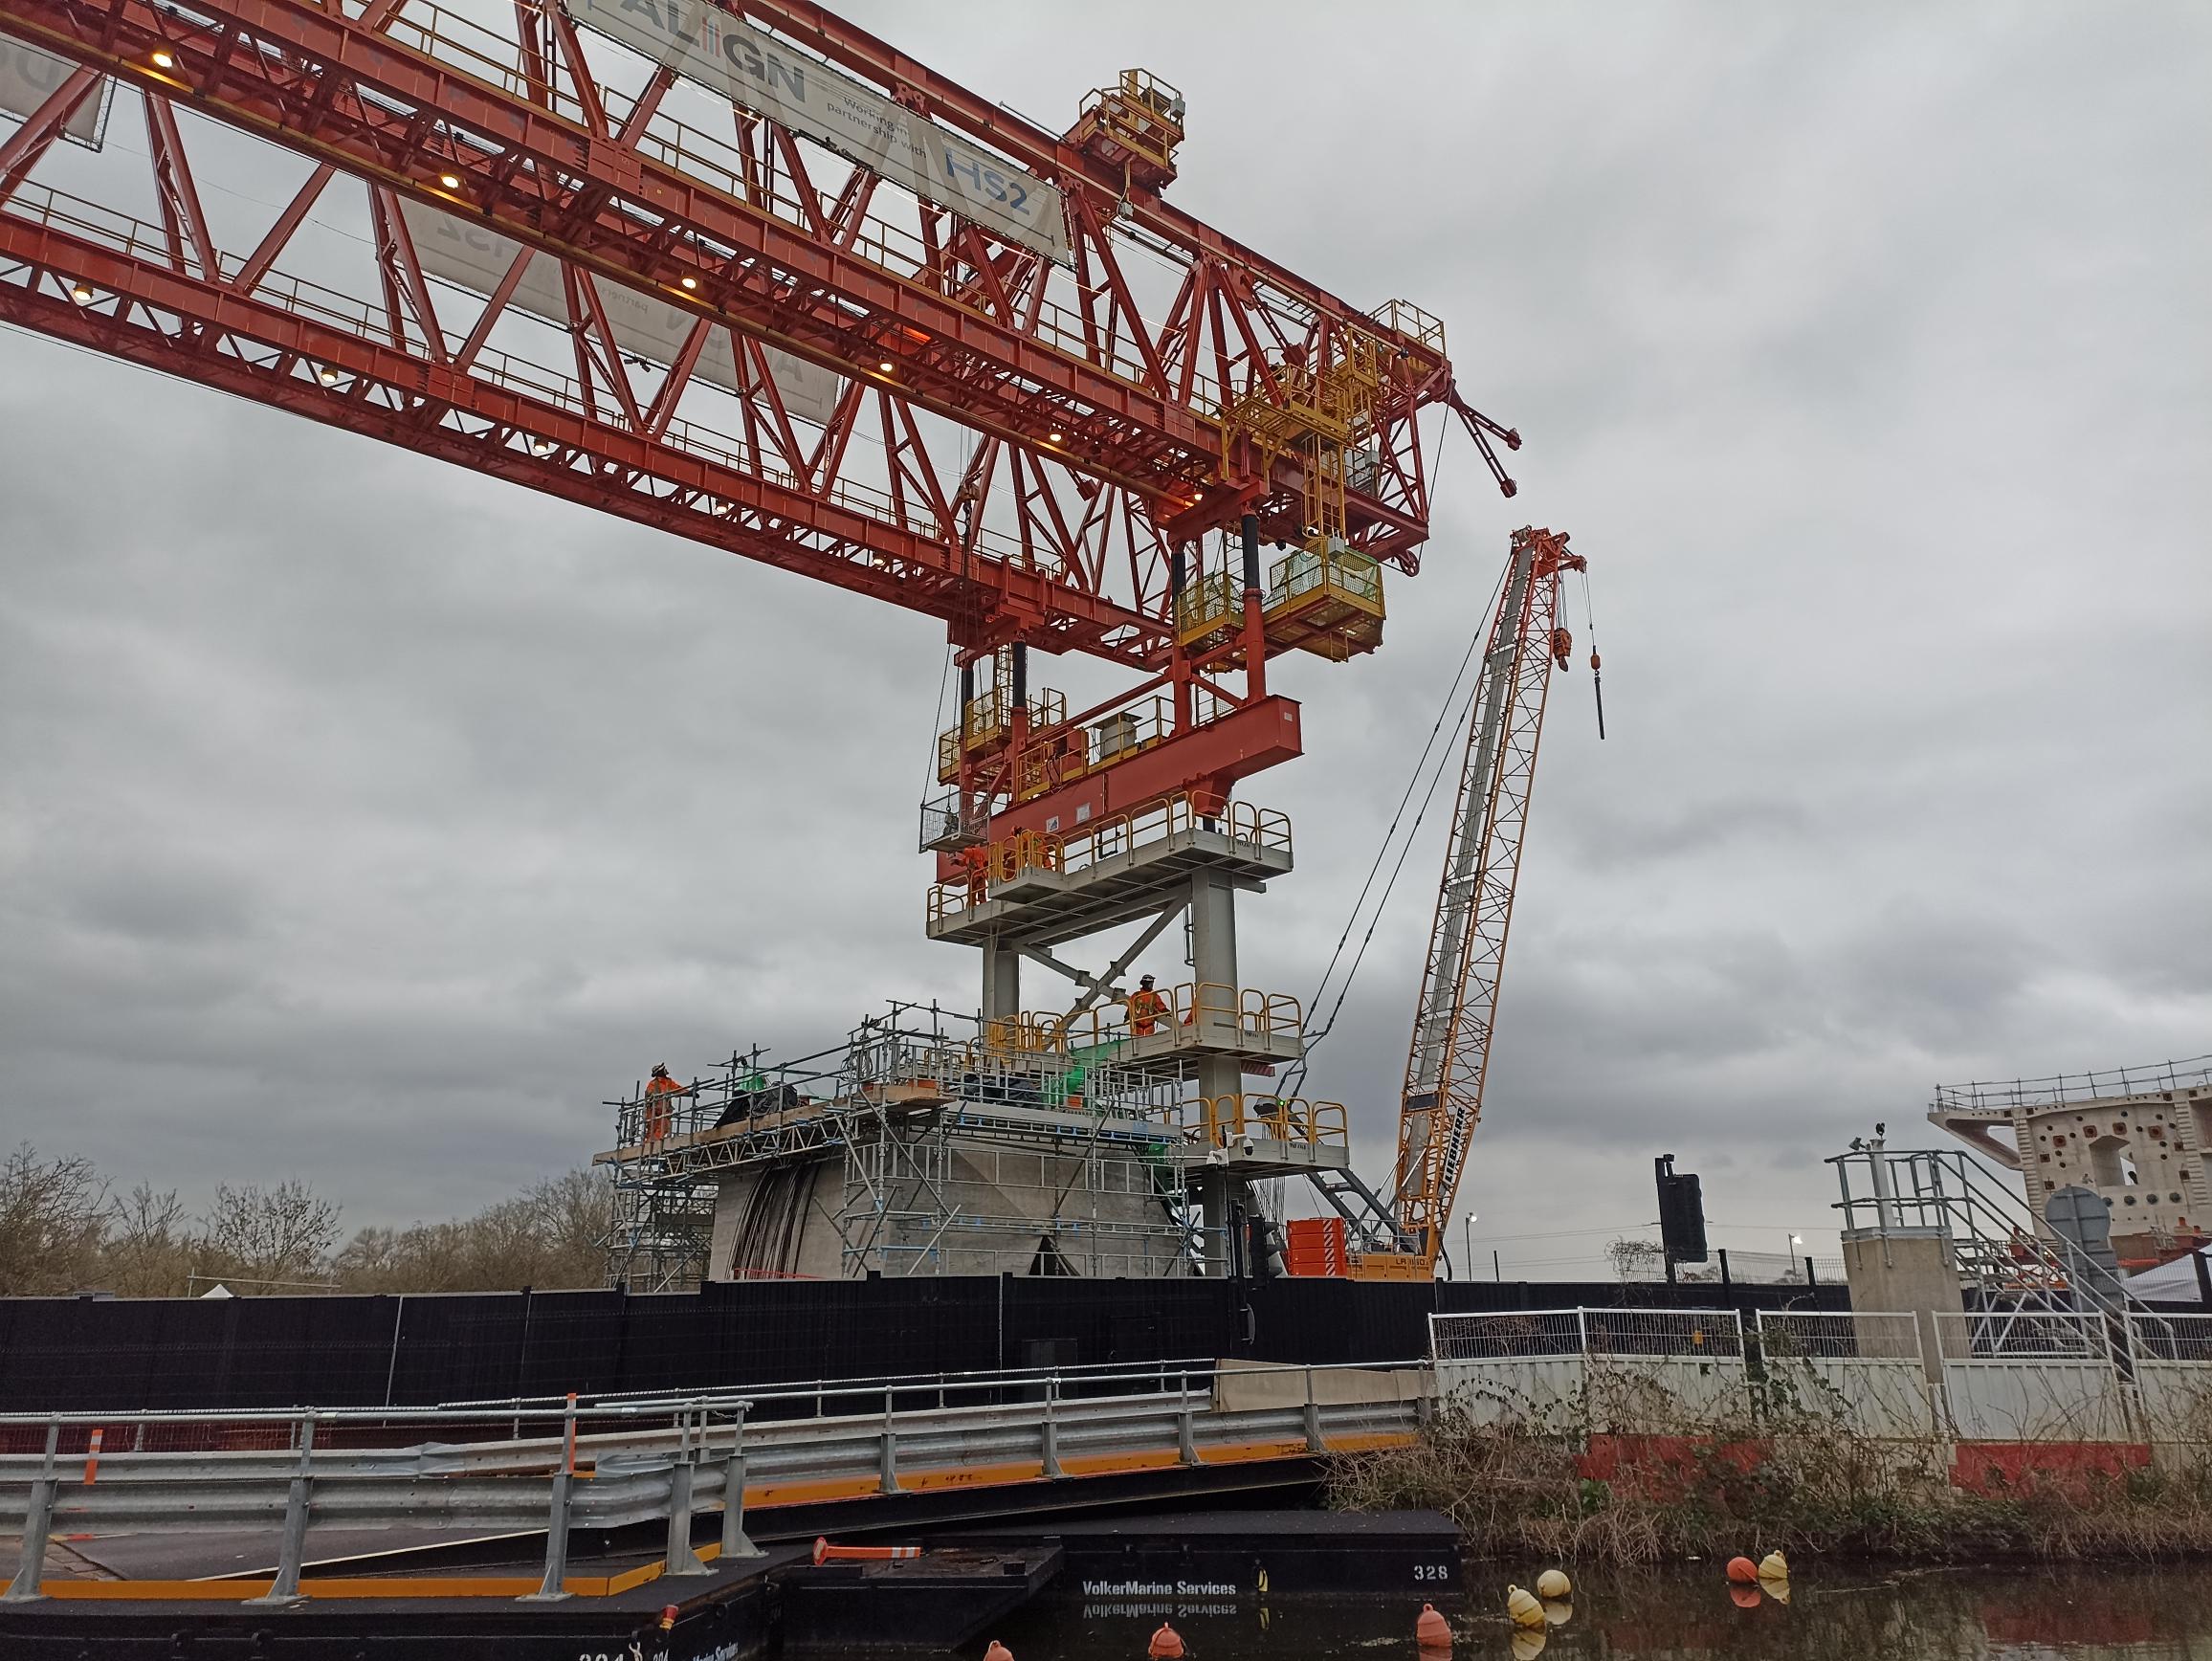
Following on from its crossing of the Grand Union Canal this spring, the huge viaduct is finally built. The giant red “launching girder” which spent a couple of years crawling across the Colne Valley building the viaduct below itself, lies in pieces at the end of its journey, being packed up into shipping containers ready for its next project. The viaduct itself is having the pontoon sections of its haul road removed, while its parapet is also being added and other finishing works are taking place.
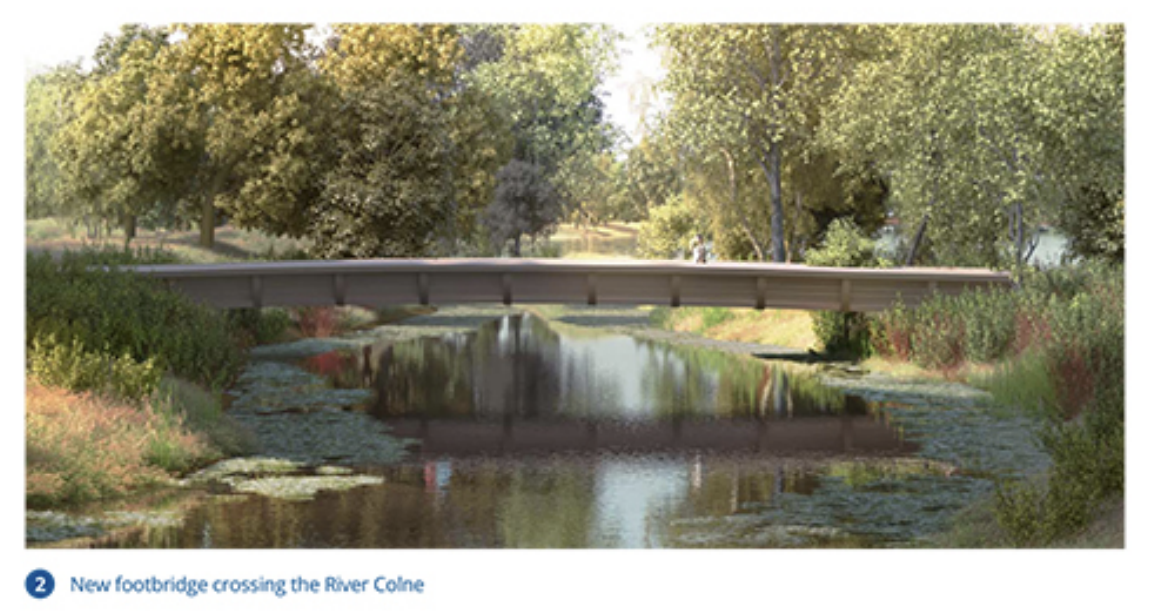
Quite soon, hopefully, there will be closer public access to more of its footprint, such as in Broadwater Lakes Natures Reserve, where a footbridge is promised to cross the River Colne beside where the viaduct does the same, although there is no sign of that being built yet.
From the HS2 website: The planned new River Colne footbridge, which will cross the river just a few metres upstream from the Colne Valley Viaduct itself.
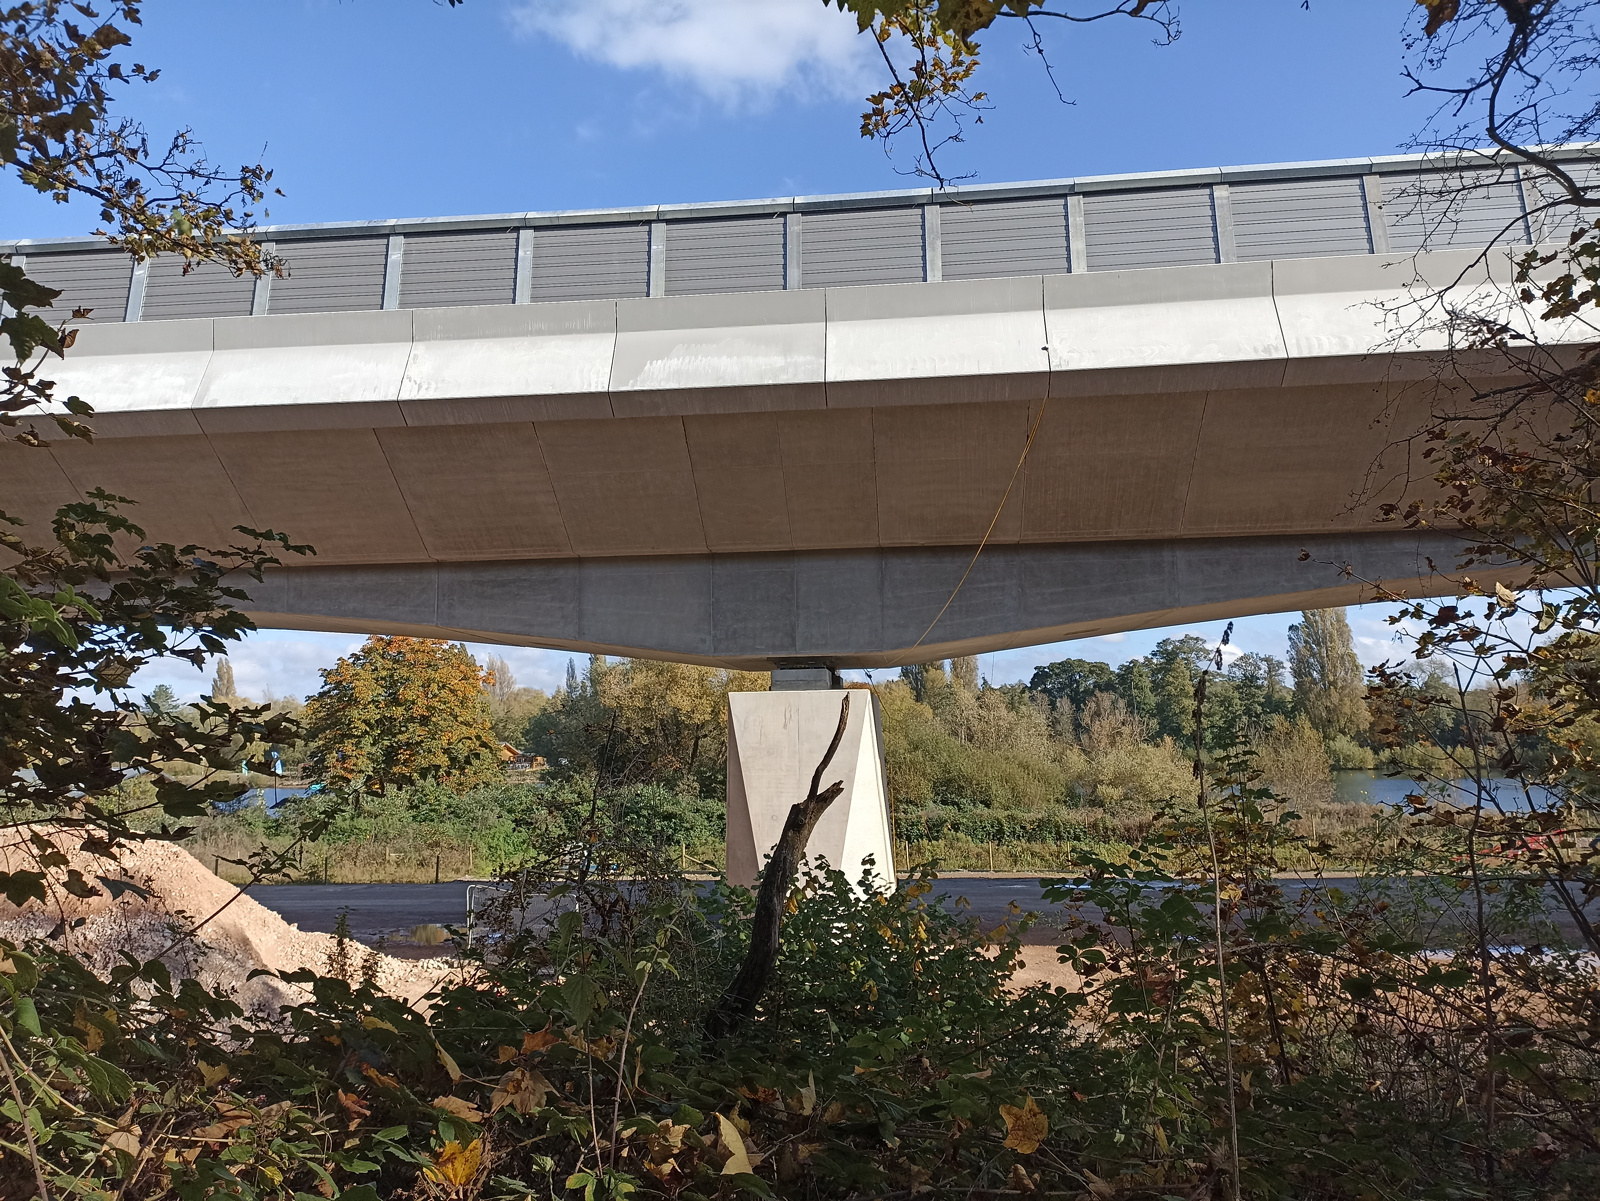
At a later stage, railway works will come along and add tracks, signaling and overhead power – for now, the viaduct itself becomes the “haul road” for the HS2 project across the valley, as tunnels at either end of the viaduct get completed themselves.
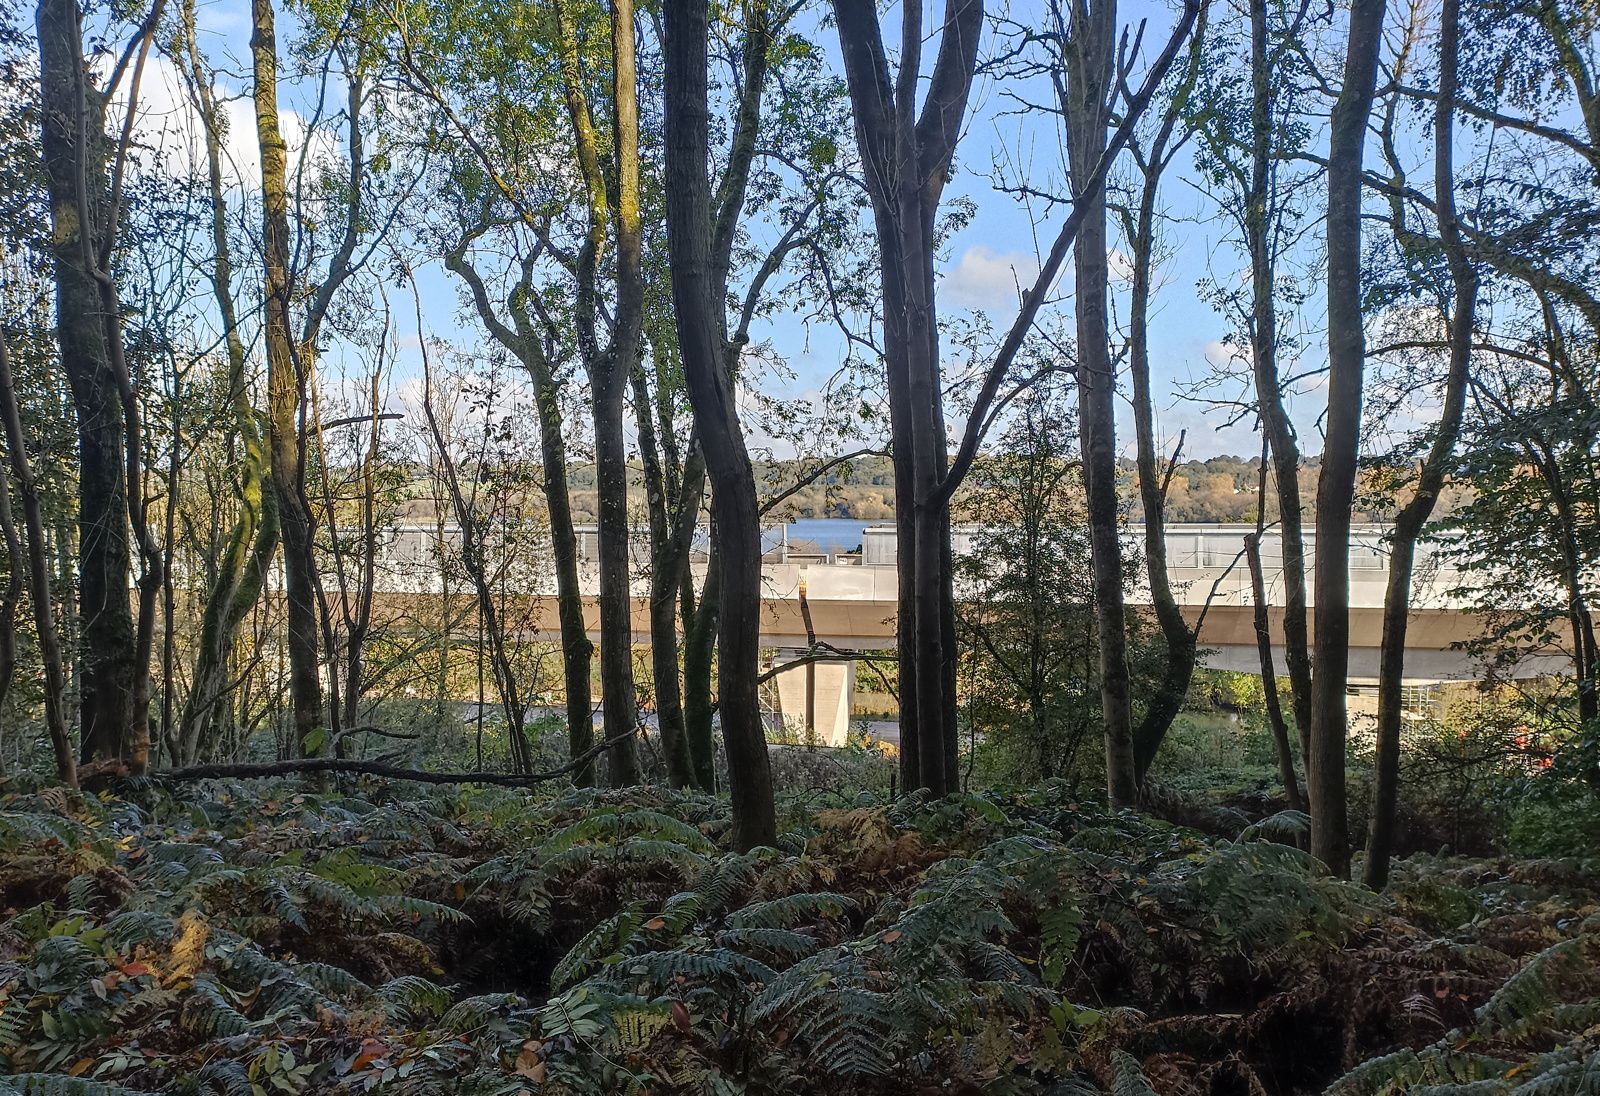
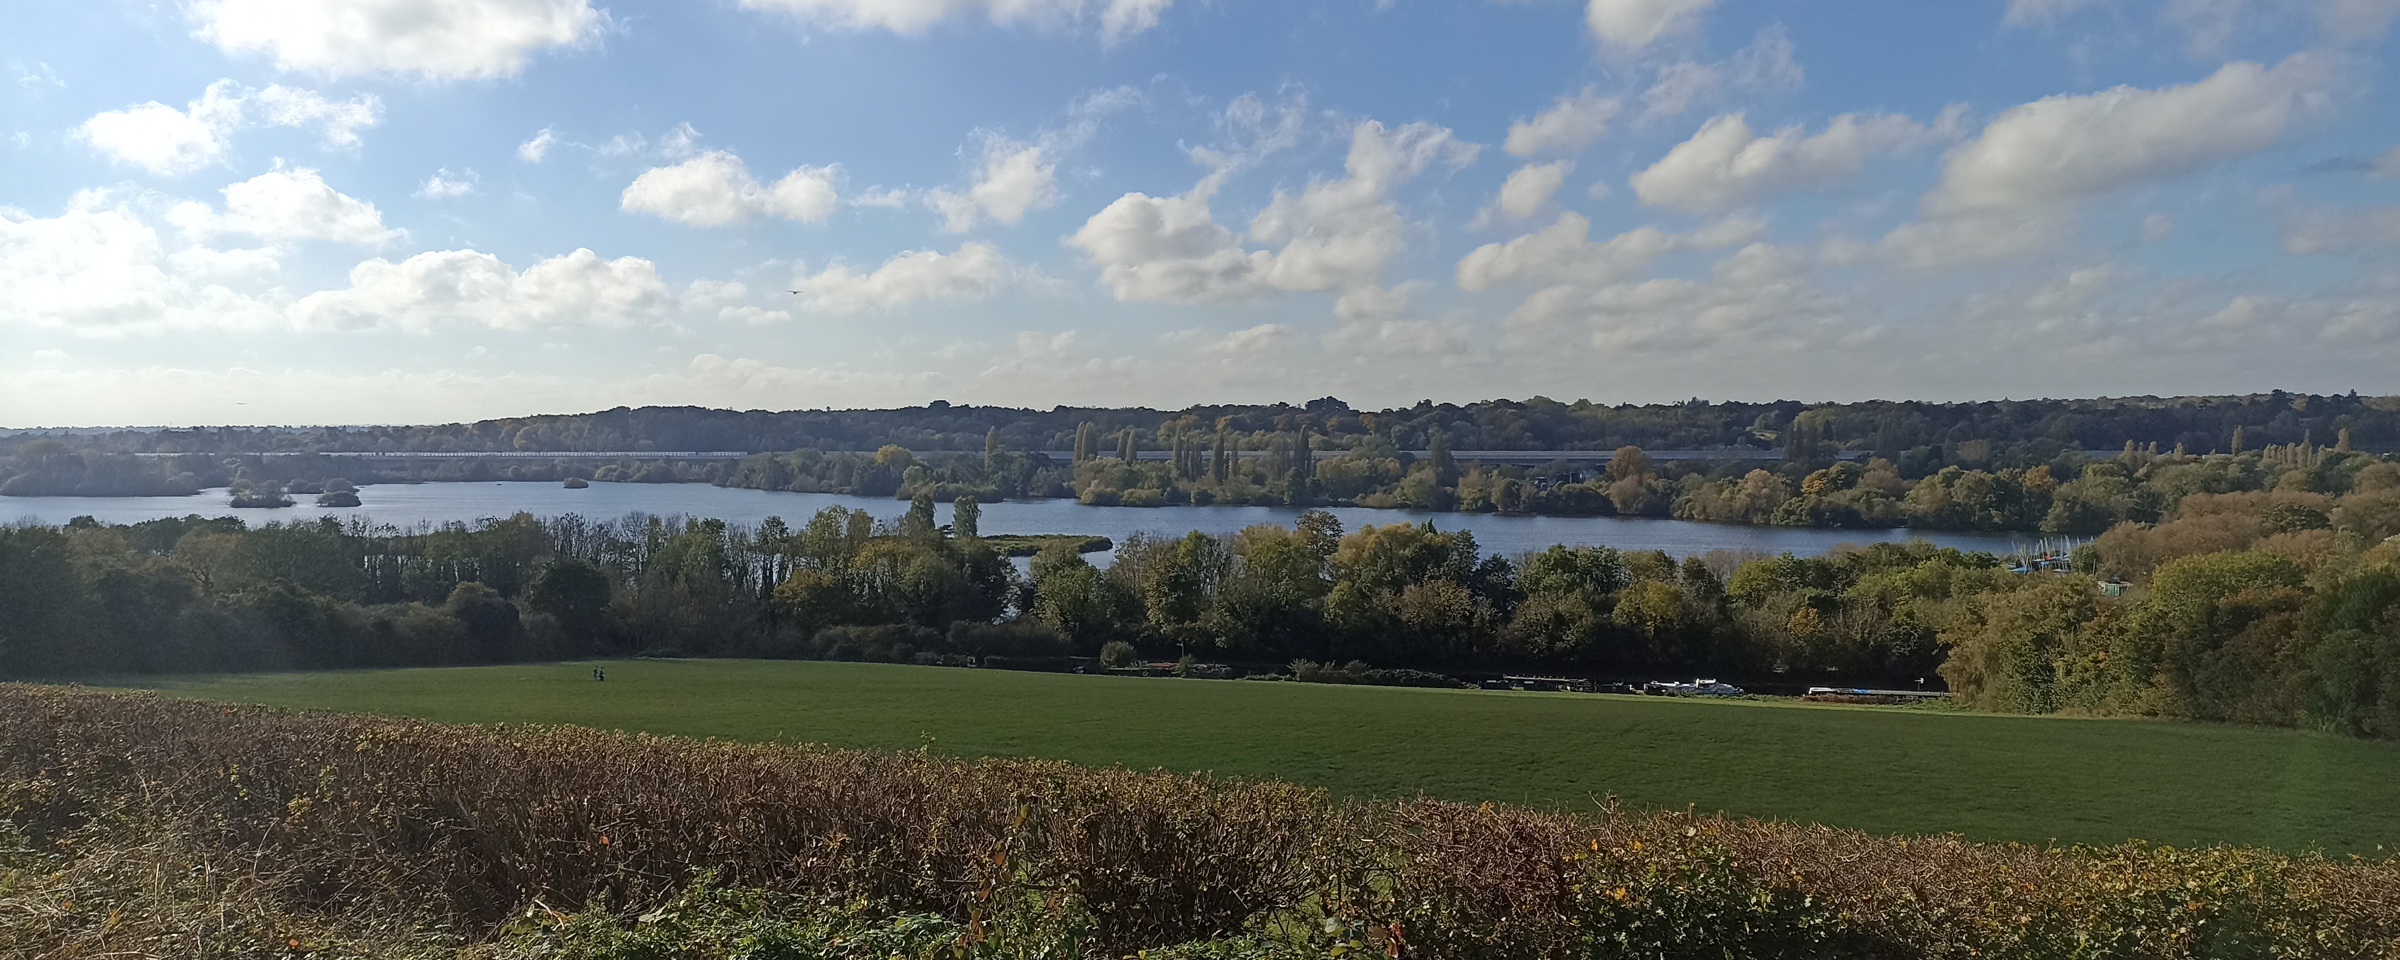
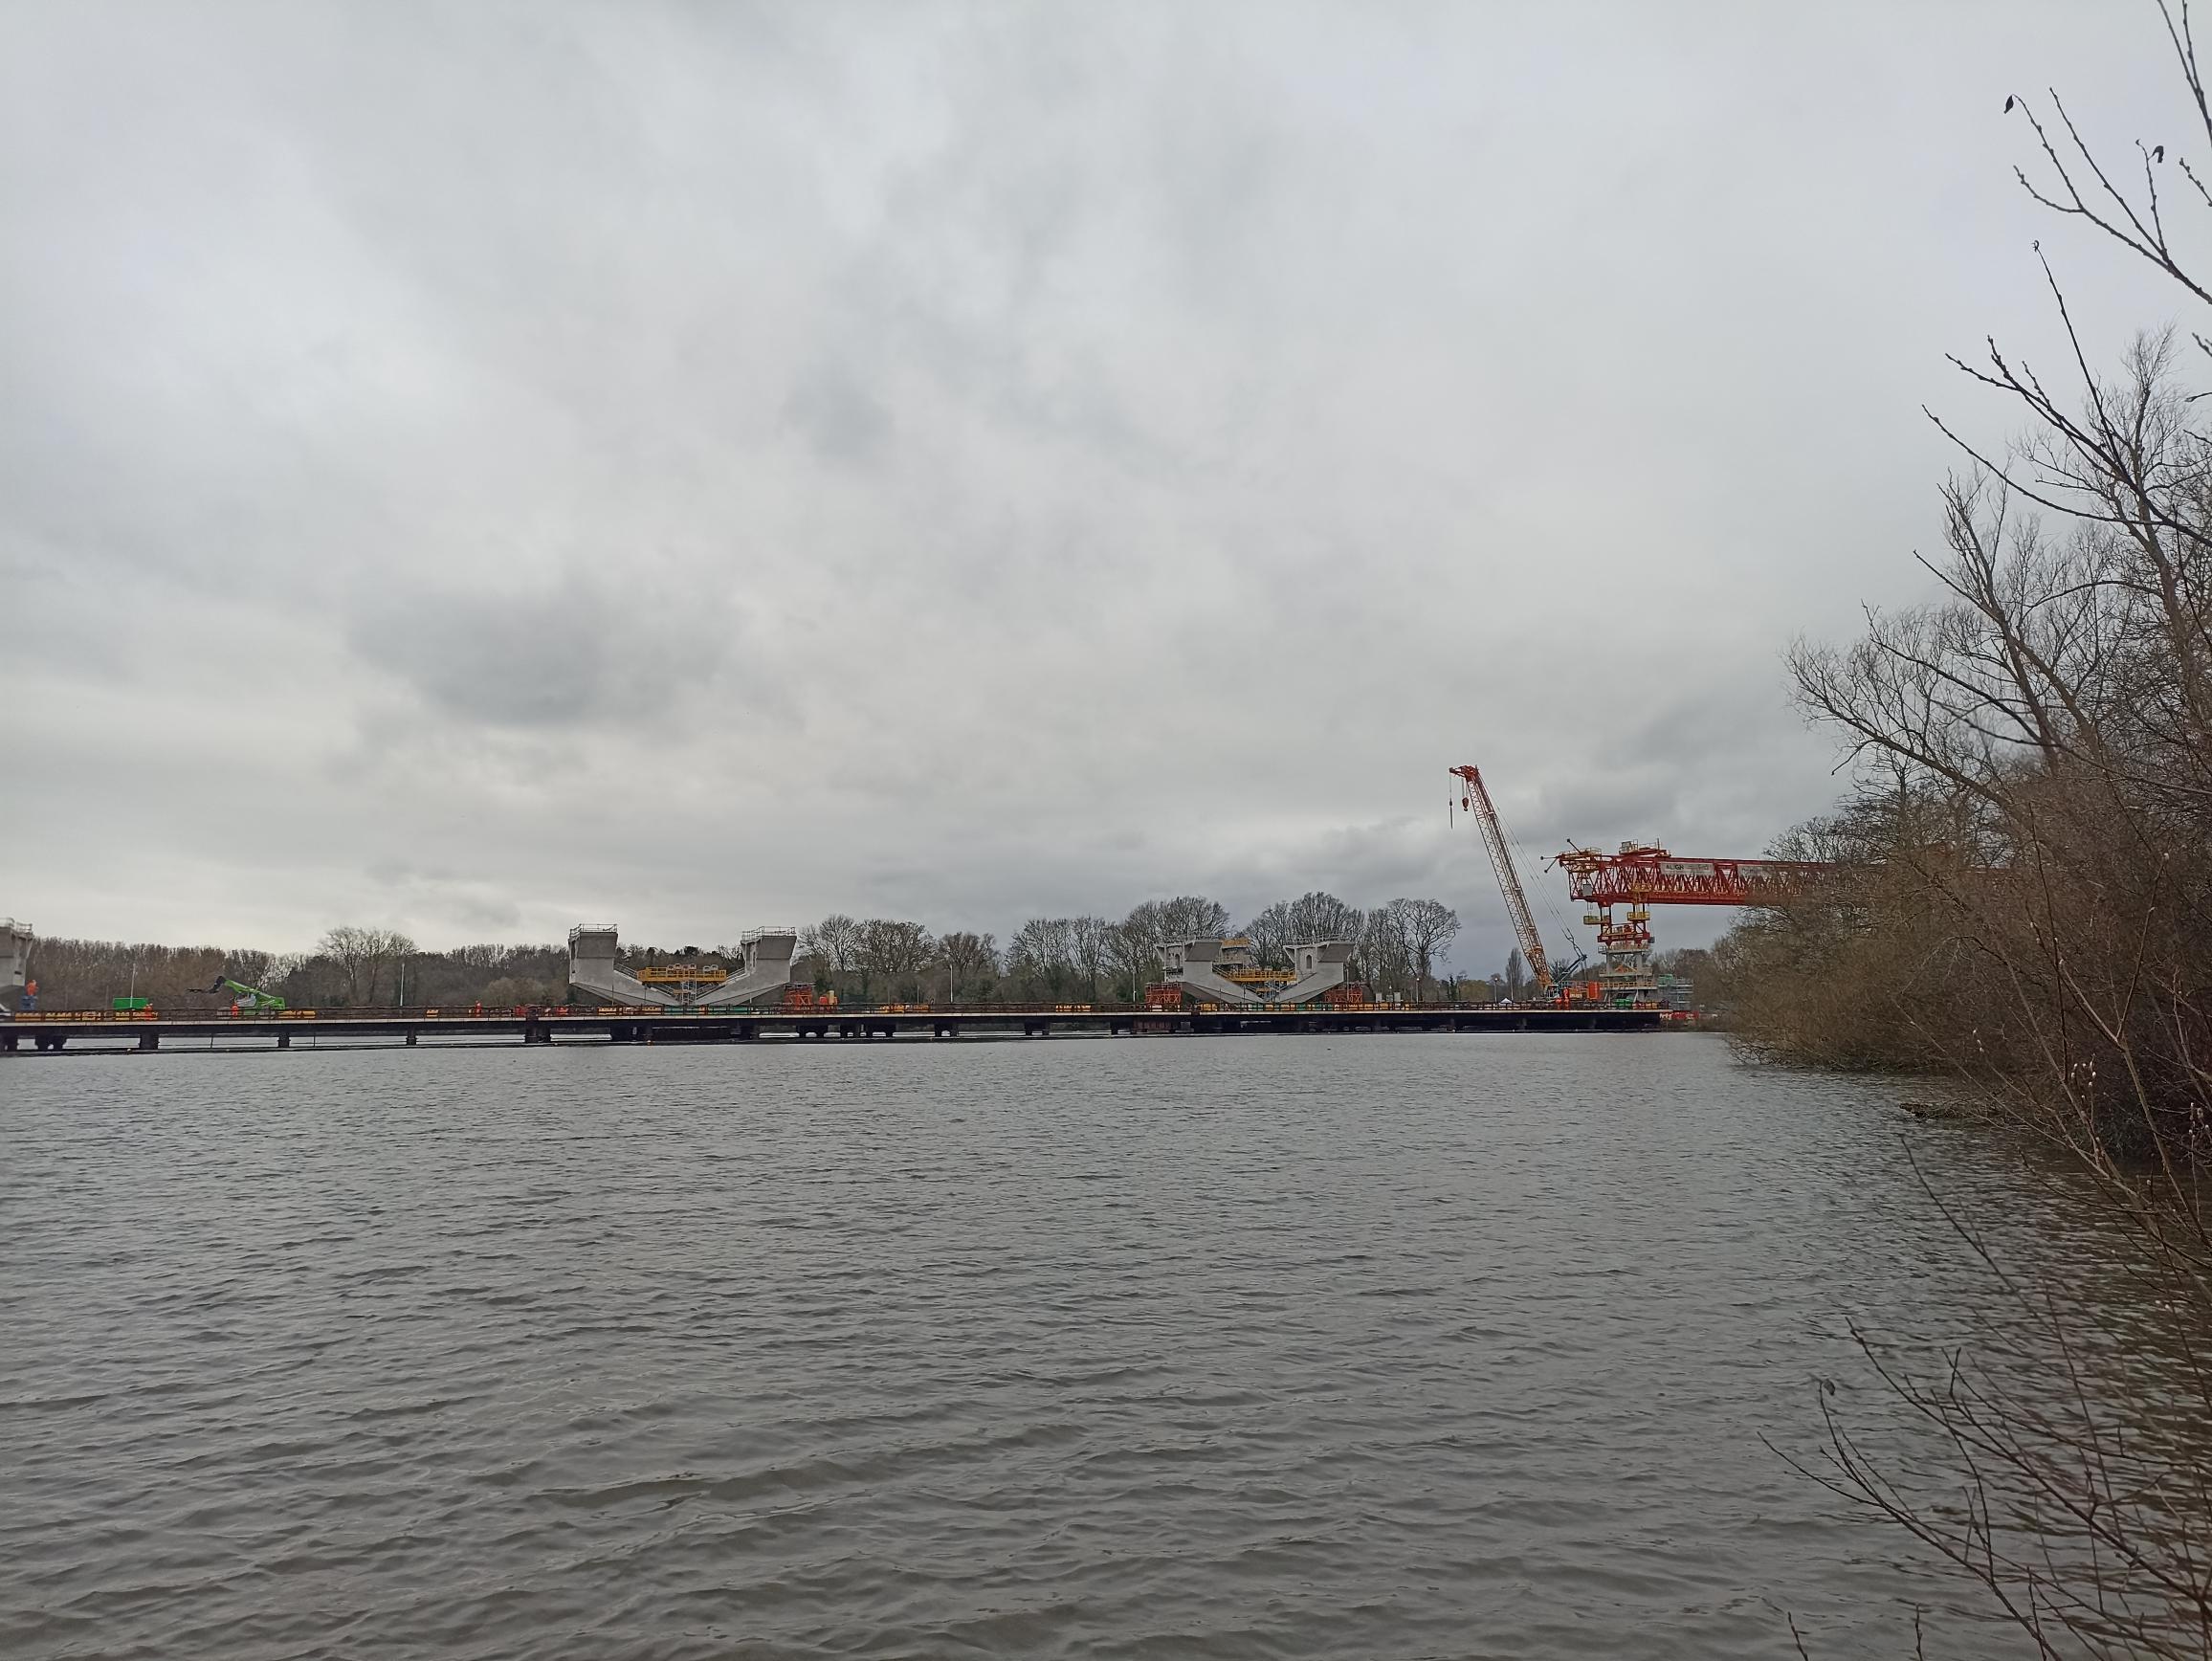
I was struck by the relatively low profile of the bridge and its small footprint – in contrast with the impact a major road bridge might have. The viaduct is rather graceful in places as it sweeps across the valley in a gentle curve. Construction impact on either side is being minimised and eventually it should blend in, just a blade of concrete floating above the apparently natural (albeit flooded historic gravel pits) landscape.
Now that the line of cranes has gone, that wonderful, naturalistic view from The Old Orchard pub car-park is largely restored, with just a thin concrete line stretching right across. In time, tree growth will soften this further.
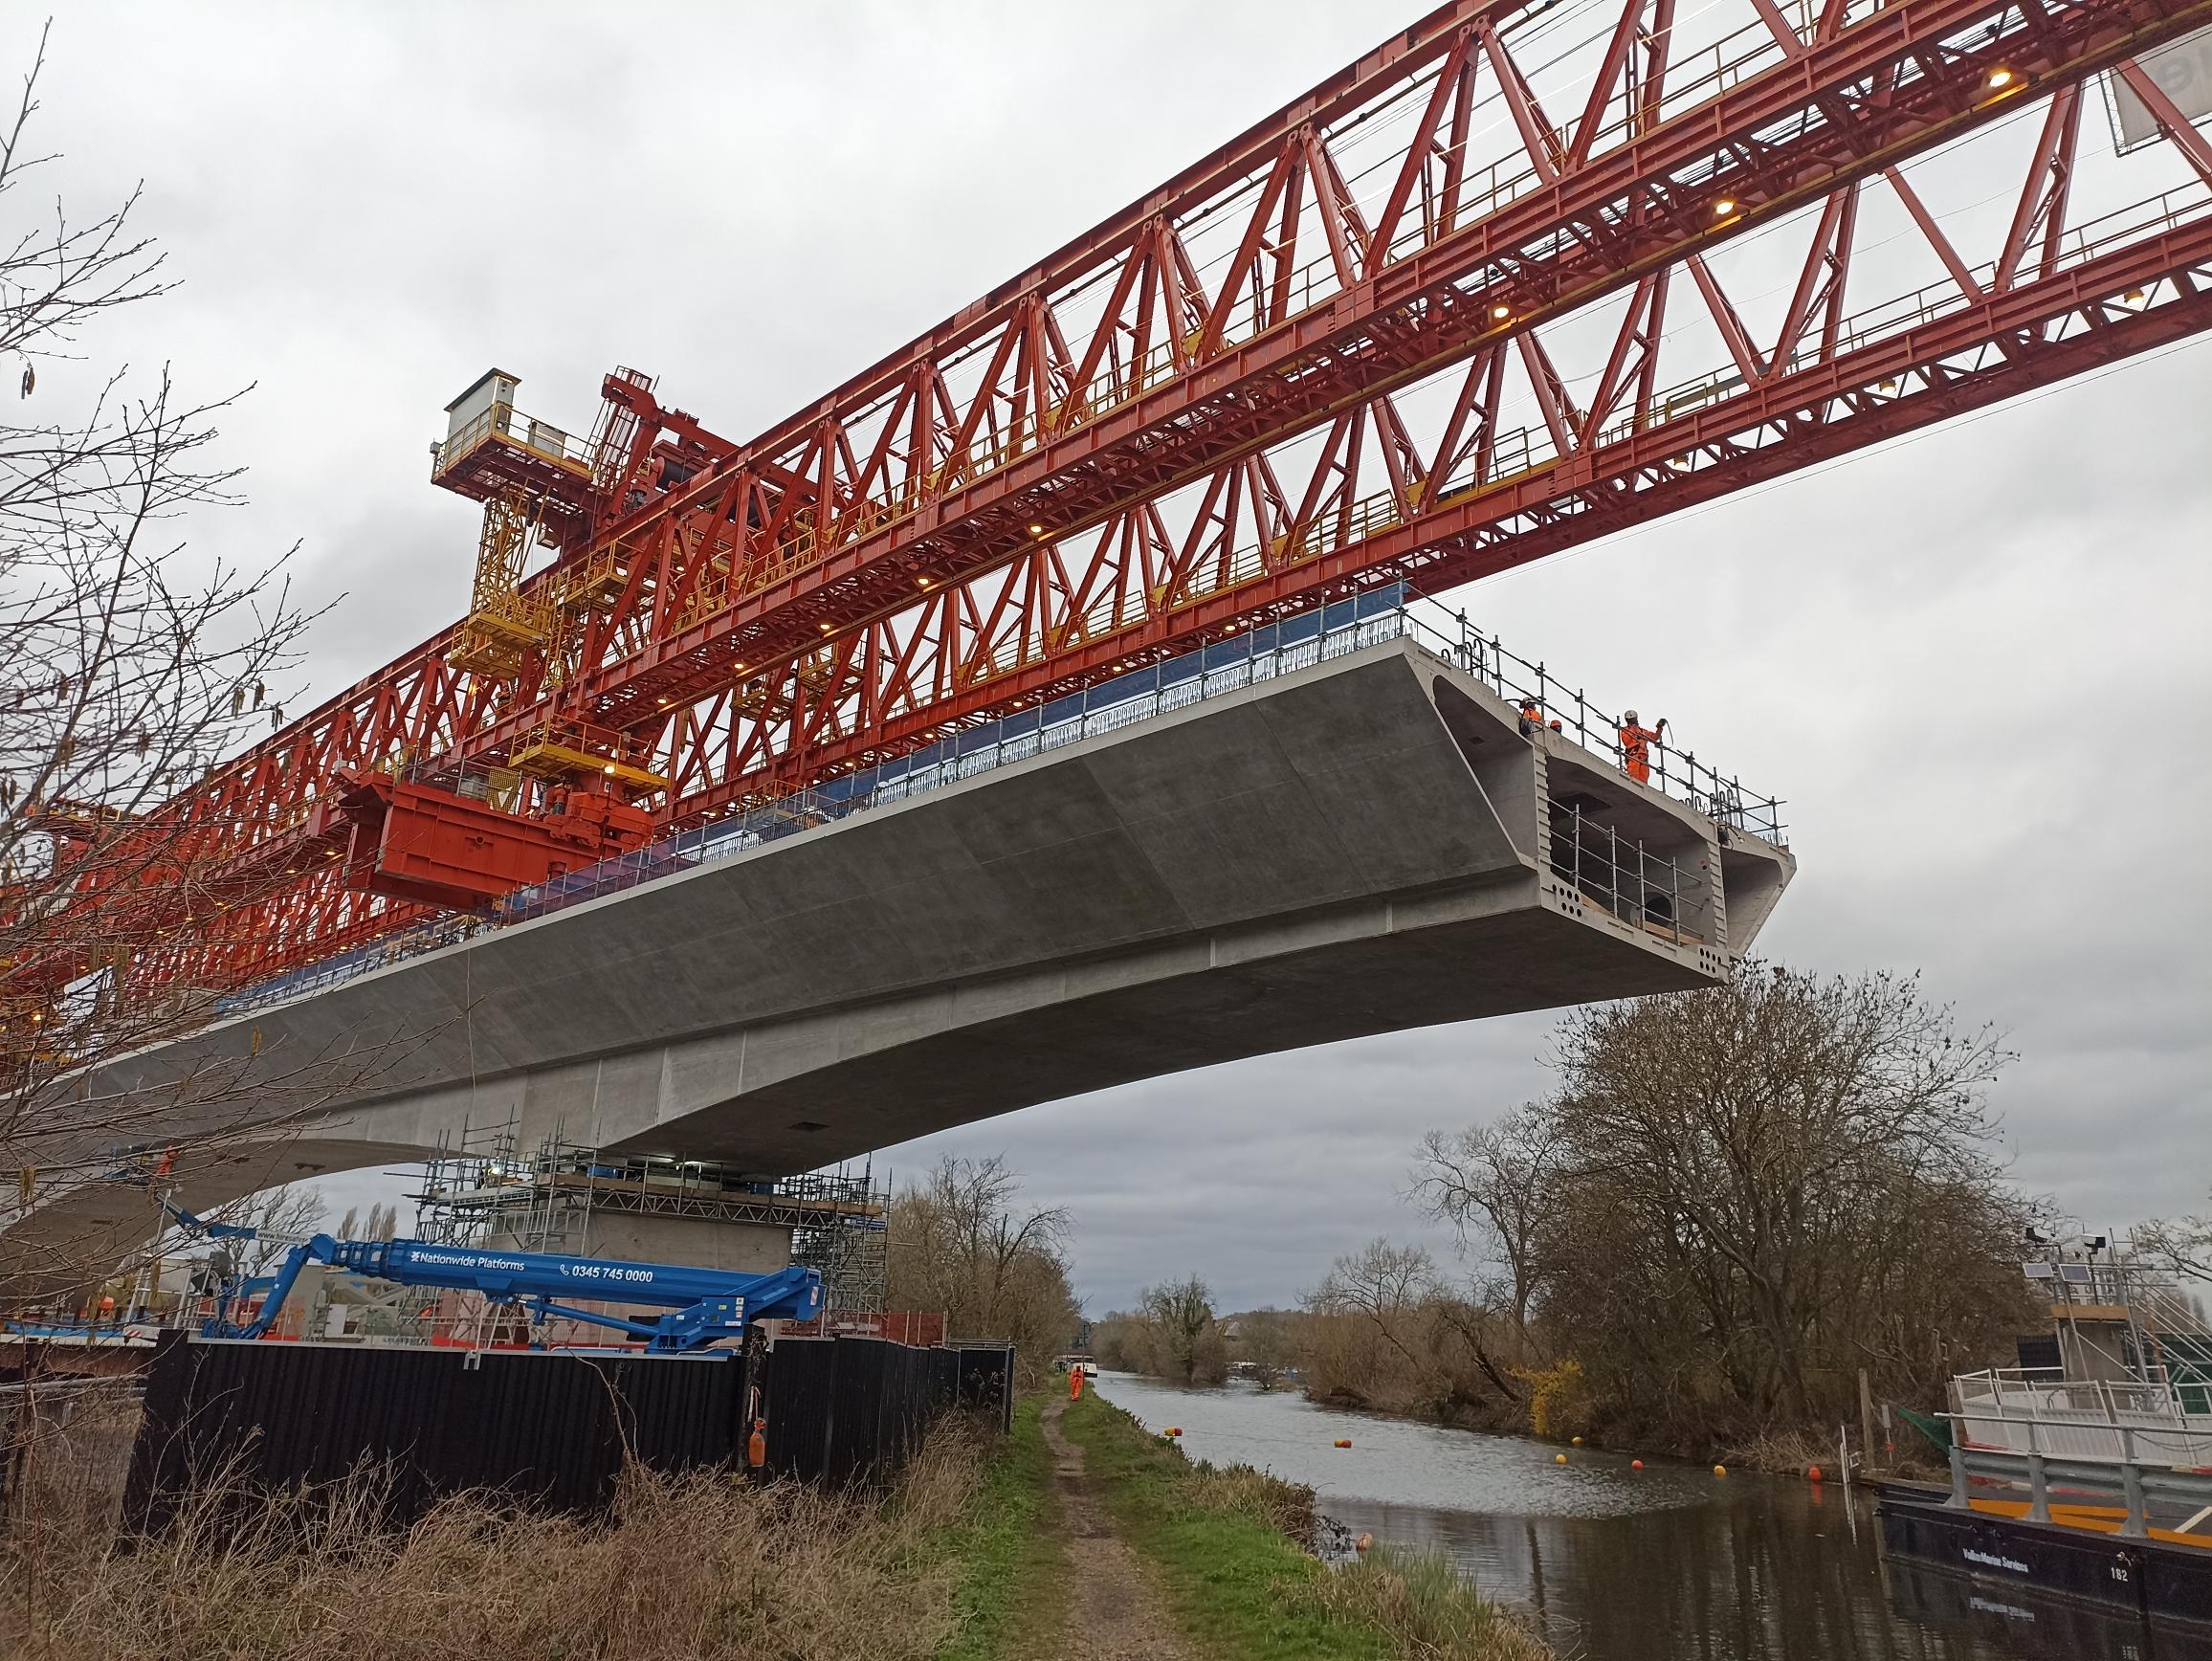
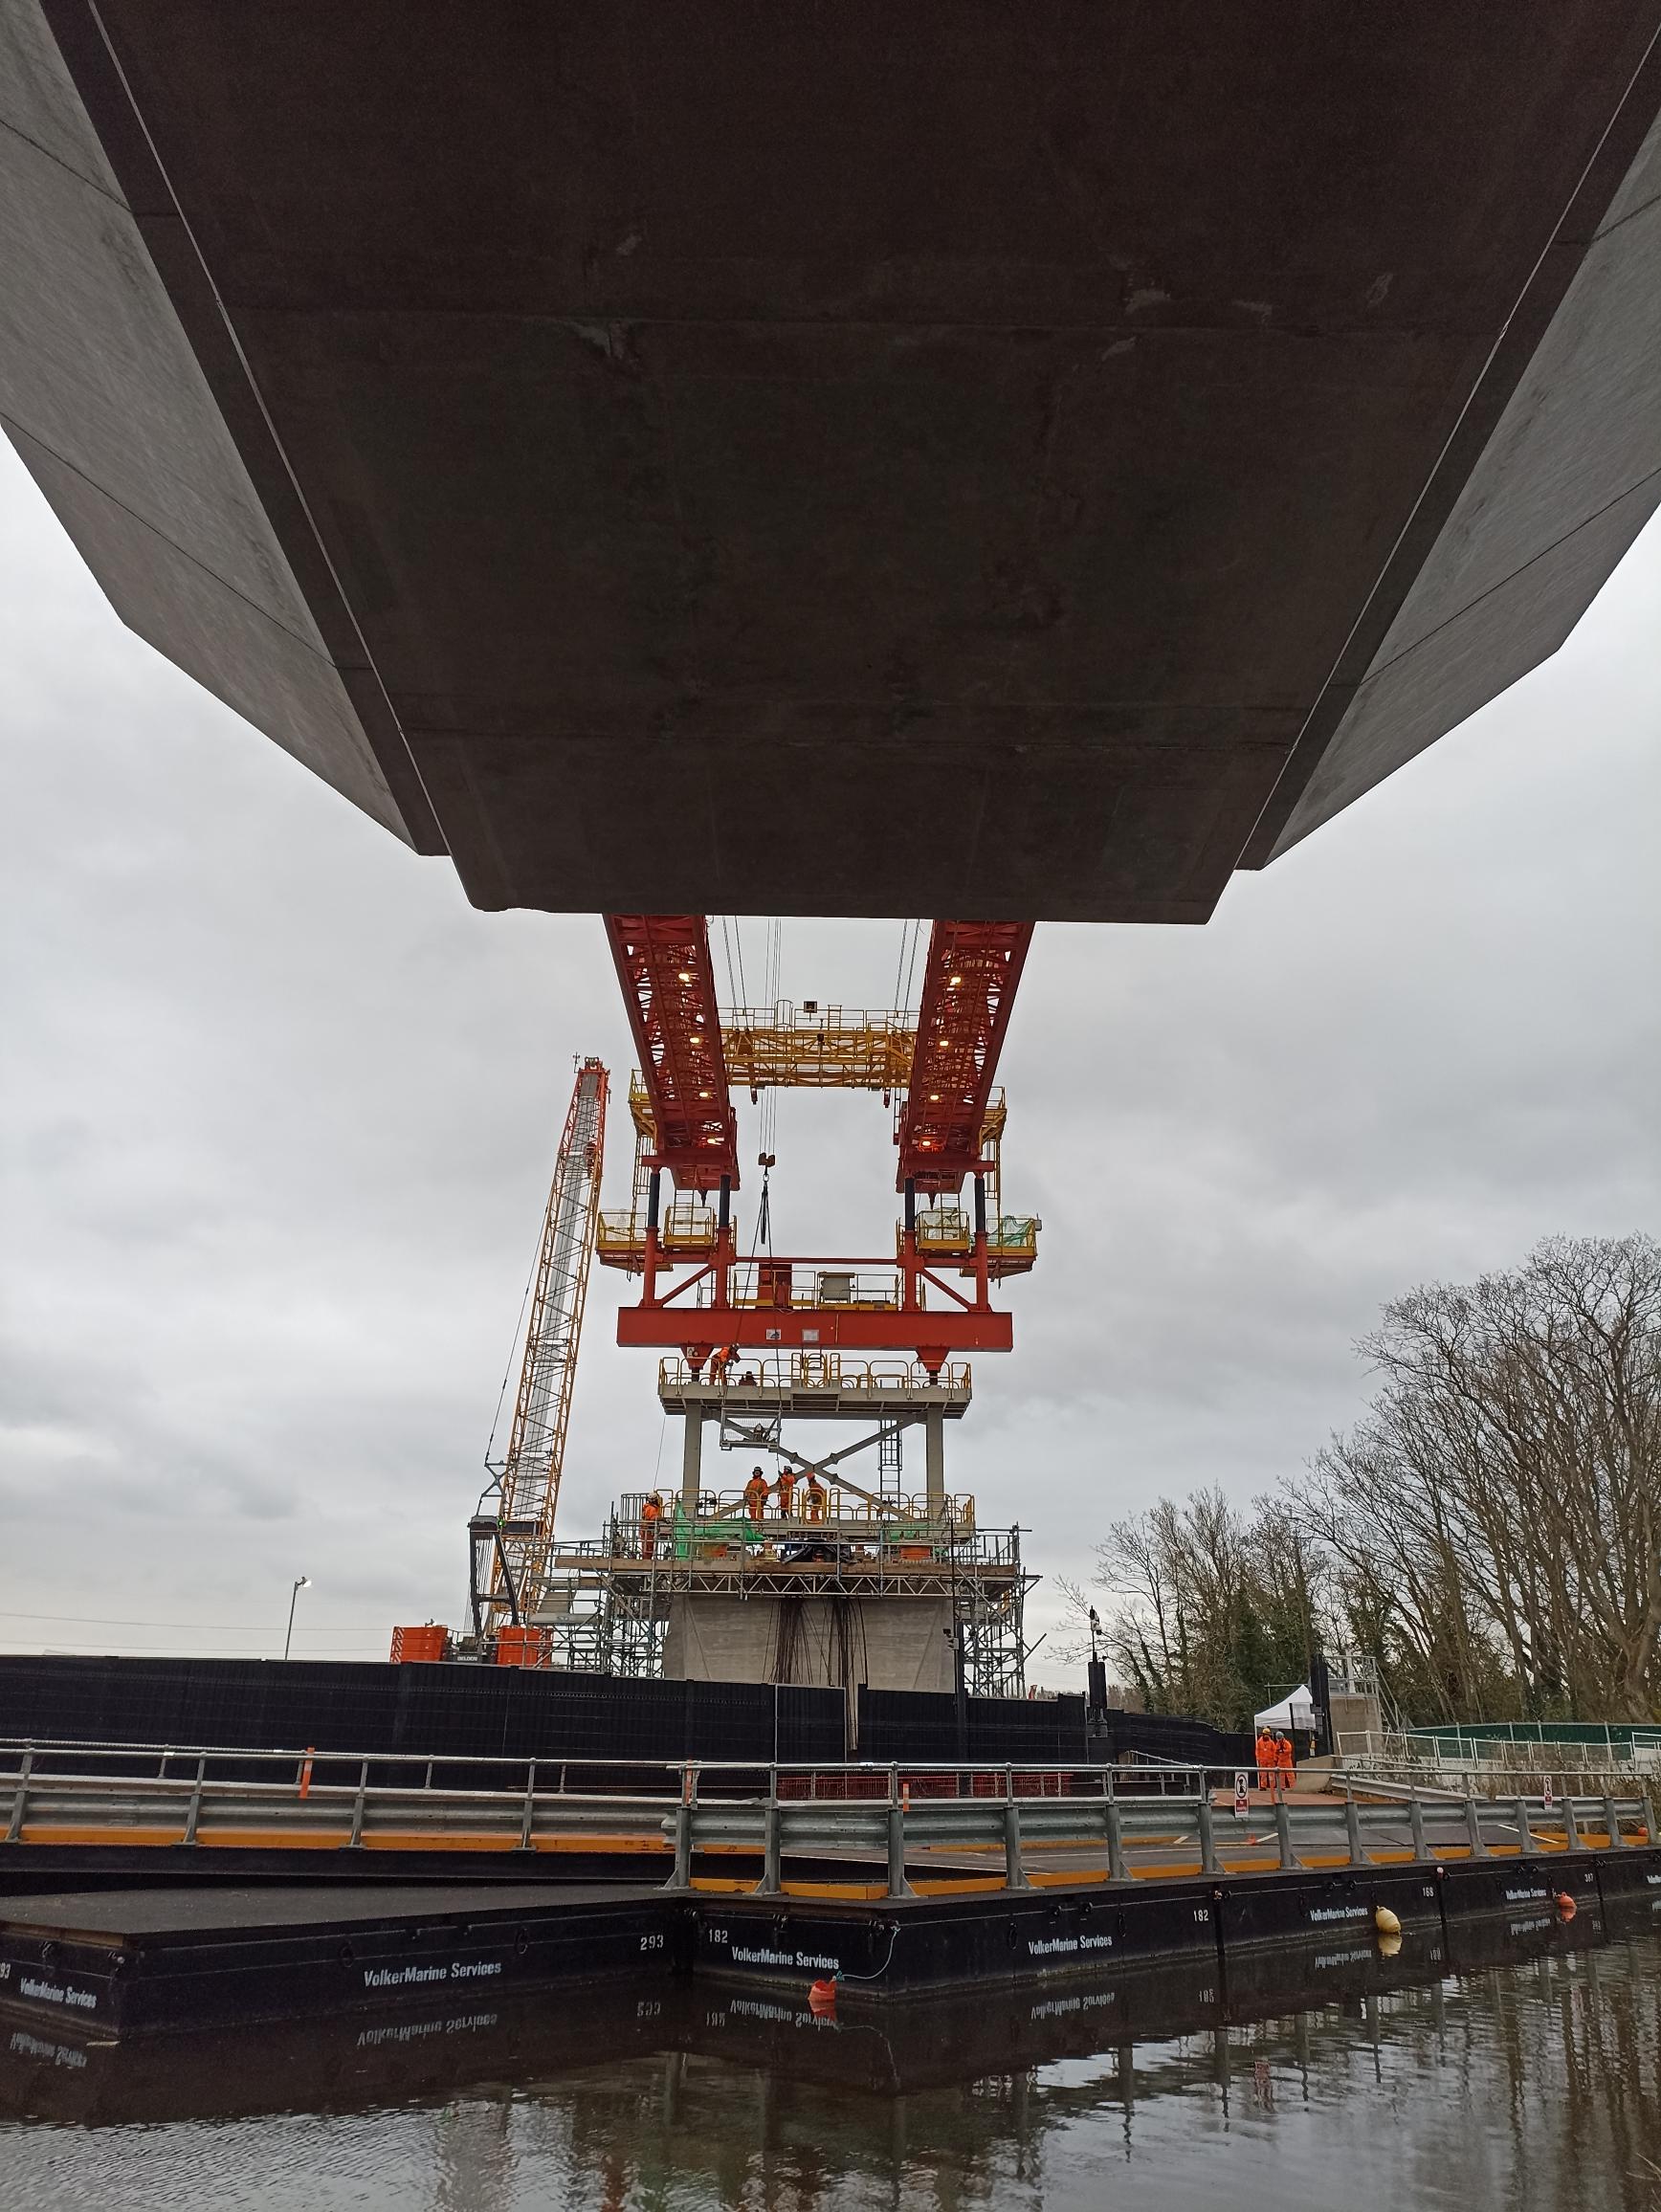
A quick visit to the Grand Union Canal between Harefield and Denham, at the point where the Colne Valley Viaduct, part of the HS2 railway, crosses it.
The construction of the two-mile-long viaduct has been creeping towards the canal for the last two years, and new the red construction girder has slid across the canal itself, and is installing the concrete segments of the permanent structure below.
The construction means that the east bank (which is part of the London LOOP walk) is closed for a couple of weeks, while the towpath on the west bank has now reopened, but closes for 20-30 minutes several times a day for each concrete segment to pass over. The canal itself has been closed all winter to boaters but is tentatively going to start opening from tomorrow, daytime only.
Back in 2018, I did a London Borough Challenge – visit all 32 London Boroughs, plus the City of London, in as short a time as possible.
I made things hard for myself. I decided that my proof was taking a photograph, within each borough and of the name of the borough (e.g. street signs, salt-bins, libraries etc) – this involved some length treks around some boroughs to find such a name. I didn’t particularly plan the challenge, but just started near where I lived. I also did it at the weekend, where public transport options can be reduced, and started quite late in the day, with no food taken and only one drink bought.
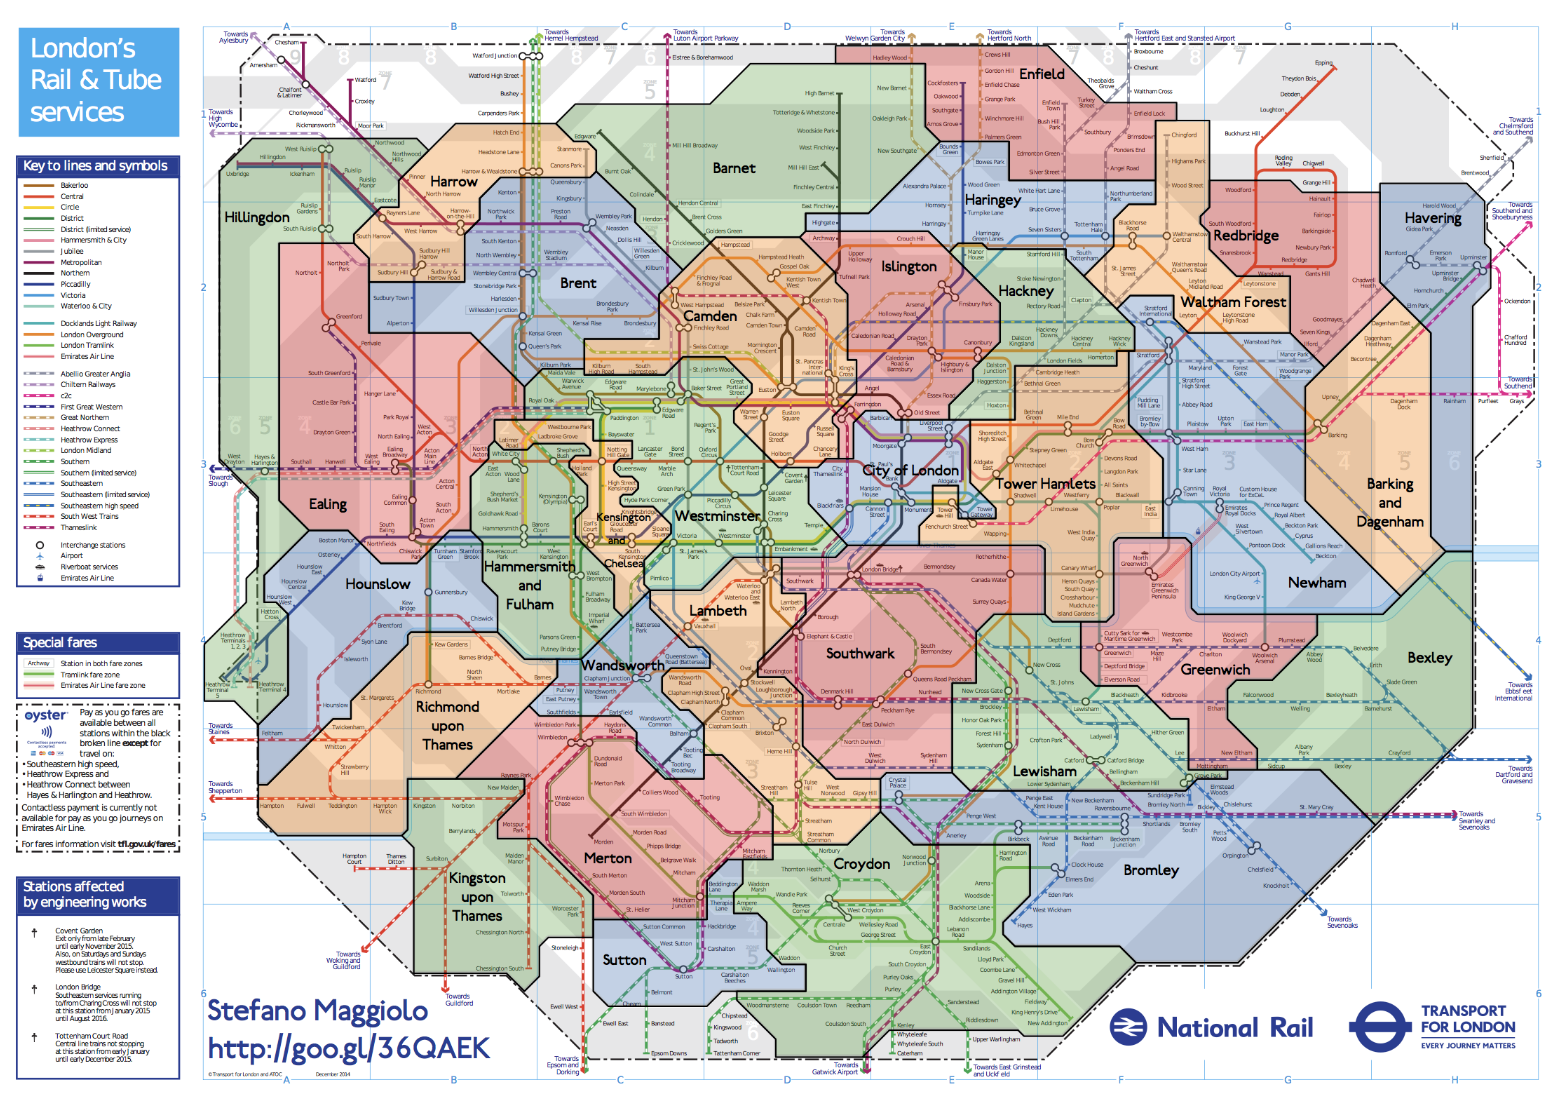
I managed to visit all the boroughs in 9:25:23. My route was 121 miles, split roughly half in cycling and various train/tube legs. I quite like it, it looks reasonably efficient on the map (see blogpost above) although it did include an out-and-back leg out to Havering borough – I really should have started here (or in Bexley/Bromley).
Above: The Borough boundaries superimposed on an (old) tube/rail map of London created by Stefano Maggiolo.
I loved the idea of visiting places in London that I would never normally go to, and it included a brief sojourn into the north half of Hillingdon borough – far from (at the time) a part of London I had ever been too. I now live there.
Thanks to a mention of the challenge on the Diamond Geezer blog, and some other posts I was able to tease out a few more “times” for such a challenge:
10:39:50 – Richard, 27 January 2007 – Tube Challenge GWR rules, included a ~3 hour pause to watch a football game! Welling to London Bridge.
9:25:23 – My effort, 5 May 2018, bike + tube/train, photos of borough names – Meridian Water to Edgware.
8:16:27 (video) – FMP346, early July 2023 – Tube Challenge GWR rules – Oakleigh Park to Falconwood.
7:41:39 – JBom1, 20 August 2007, Tube Challenge GWR rules – Hadley Wood to Welling.
7:13:00 – Diamond Geezer, 11 October 2018, mainly trains/tubes and some walking, underground tube/train sections and non-stop visits were allowed – Romford to Abbey Wood.
6:29:19 – Phil Brown and Hassan on 25 June 2009, stopping at a station in every borough – “a sub-6 hour time is possible”, Tube Challenge GWR rules – Eastcote to Belvedere.
Three of the five are “Tube Challenge GWR rules” runs. This is an adaptation of the classic London Tube Challenge. Each “visit” must be an arrival and/or departure at a stop/station by public transport. Walking/running sections are OK to link between public transport, But don’t count themselves as a “visit”. Being underground and/or staying in station/train/bus for a visit is OK.
I’m not wedded to the idea of theses rules because it makes the challenge mainly about trains/tubes/buses, rather than boroughs. Nothing wrong with that, but I feel that walking/cycling into a borough is “visiting” it. Even driving would be OK, I think. This might well be the fastest way to visit all the boroughs, if you did it late at night. But certainly, during the day, I don’t think you could even drive to a different borough every 15 minutes or so.
(There was also a recent, similar challenge on the Tom the Taxi Driver Youtube channel – it wasn’t a time-based challenge but it did include the basic premise of visiting a large number of boroughs sequentially. Here Tom attempted to visit all the “Knowledge” boroughs, in his taxi of course, passing just one set of junction-based traffic lights in each borough.)
Anyway I would like to try visiting all the London boroughs in a day again, this time simplifying the rules and also planning things in adcance. A GPS track with timings would be proof enough (for me) of each visit.
I think the combination of cycling and train is still the best way to go. I would even say you don’t need to “stop” in each borough (at a train/tube station or bus stop) but that you need to be on the ground (albeit in a vehicle) to record a visit.
It should take well under 9 hours to do. Although maybe not under 6 – that’s 1 borough every 11 minutes! The only question is what route to take?
Some optimisations could be focusing on borough tripoints – possibly starting/ending at one. These are locations where three boroughs come together. Sometimes, a fourth borough is also very near, or even a fifth (at Crystal Palace). They tend not to have great public transport connections, because boroughs tend to not be so focused on connectivity at their edges – they would no doubt rather people spend their money nicely inside the borough, well away from their rivals.
Some route miscellany:
The Crystal Palace tripoint (Bromley, Lambeth and Croydon) at the A212/A214 road junction is only 100m from Southwark, and less than 1km along the same road to Lewisham. It’s 8 miles (45 minutes on a bike) from the New Eltham area which is the Greenwich/Bexley board. That’s the 7 boroughs of South-East London down in under an hour.
A cycle around the edge of the City of London (both sides of the Thames) can similarly get 7 more boroughs (Lambeth, Southwark, Tower Hamlets, Hackney, Islington, Camden, Westminster) plus the City itself, in little more than half an hour.
You can’t take your bike on deep-level sections of the tube at any time – or the tube/train at all during rush hour. You also can’t take your bike on buses. But I think despite these, bike+train is the right combination.
Bikeshare is possible this time – there’s so many Lime e-bikes in London now – possibly 10,000. But they aren’t in all of (outer) London and there is still “faff” time of finding one at your start, starting your journey with the app, and making sure the journey finishes correctly.
I think probably, the cycling to train/tube ratio will need to be higher this time.
All the Boroughs By Bus?
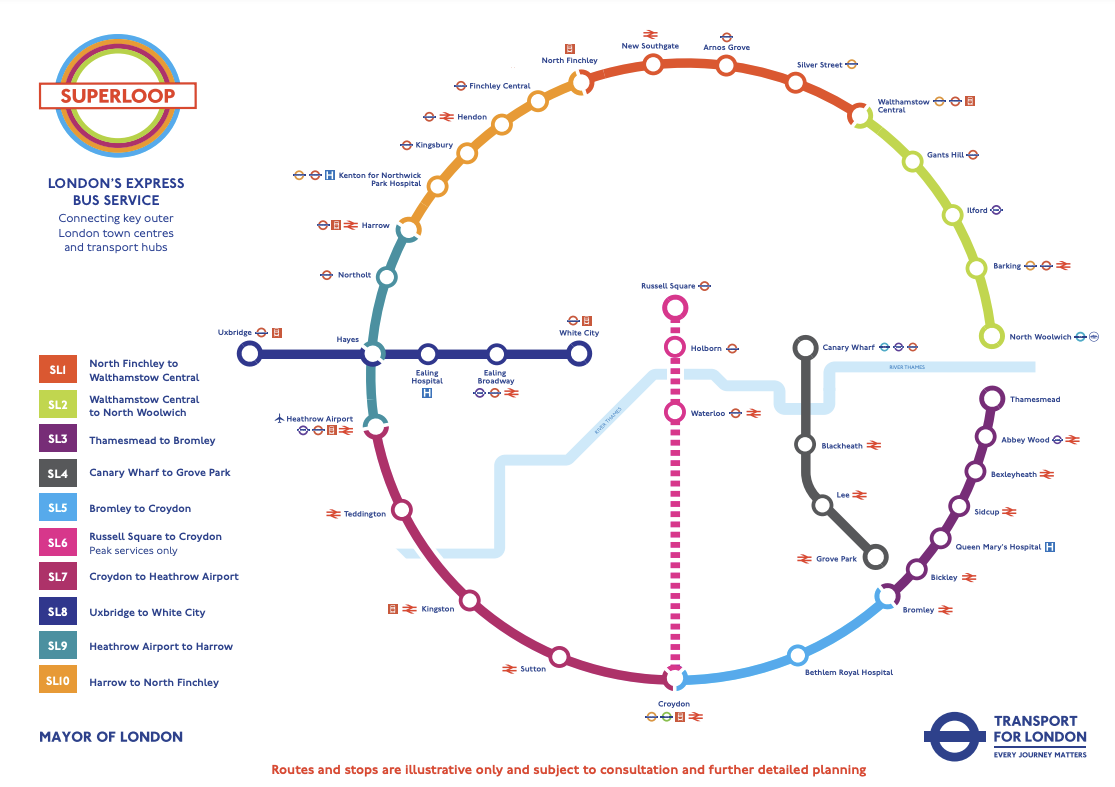
There is also the possibility of a “bus edition” of All the Boroughs. I did a desk-based calculation of a possible route which worked out at around 14 hours (!) but that was before the recent announcement, and ongoing introduction of, the Superloop. This is a near-orbital set of 8 limited-stop buses, circumnavigating outer London (plus 3 radial express routes). The orbital part of the Superloop should be fully launched later this Spring – by 2 March, is the plan – and then offer the ability to visit 18 of London’s boroughs by just staying on the orbital Superloop route itself. Add in the 7 boroughs surrounding the City of London, and City itself, which could potentially all be walked, and you are just left with an inner-West London trek from Merton through Wandsworth to Hammersmith & Fulham and Kensington & Chelsea. Then you just have Havering, Haringey and Greenwich to visit. Easy!?
Some more miscellany:
There is also one especially useful regular bus as it passes through 8 boroughs – the 341. Its northern end is close to a likely stop on the Superloop on the North Circular. Its southern end is very close to the SL6 radial Superloop down to Croydon – however this only runs on weekday peaks.
SL7 passes through Hounslow borough, but doesn’t stop in it. Does that count as a visit to Hounslow? (Probably yes. We are visiting boroughs not bus stops).
But London buses are often very, very slow. Is it possible to do it in a day (and ideally daylight)? Can I visit all the London Boroughs for £5.25?
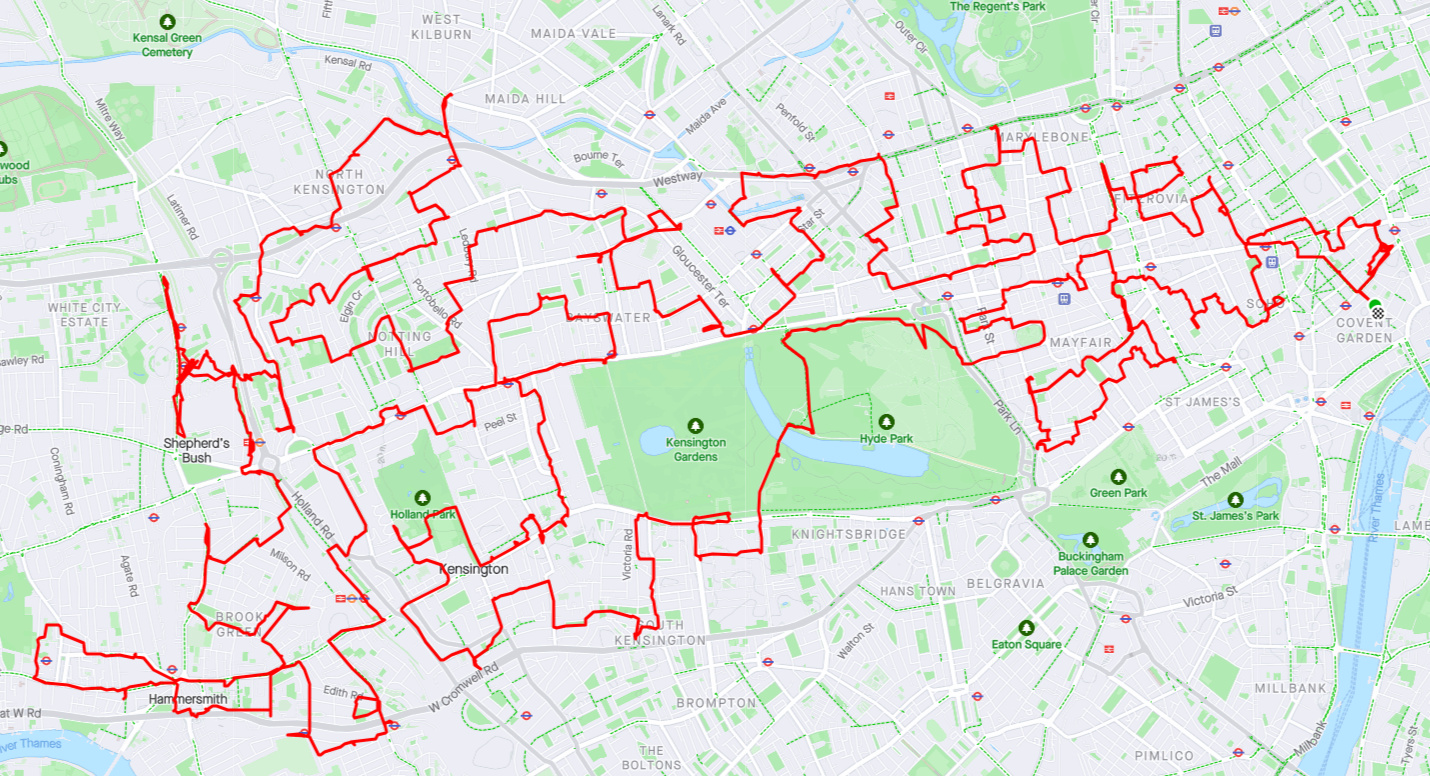
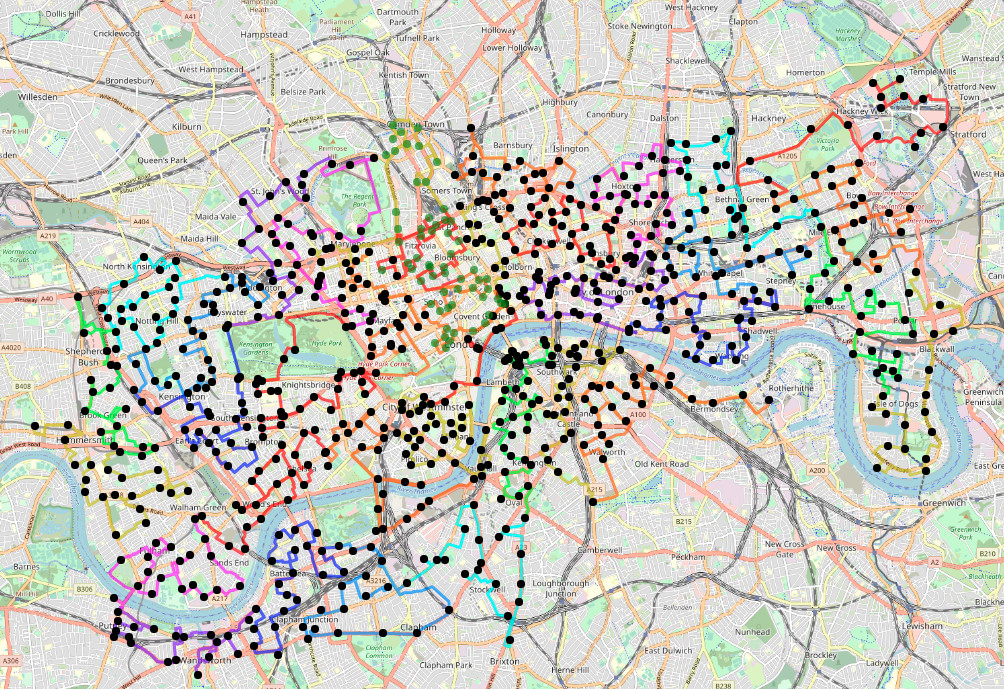
Yes, we did it again. All the Docks 2 took place in London on 9 July. Five teams (up from three last time) each cycled between a fifth of the Santander Cycles docking stations in London. I again did the routes, splitting up the ~800 docking stations into 5 routes of 160 docking stations apiece. To make it more of a challenge, this time we started in central London, at the same docking station we were all to finish at, with the teams looping out from central, before returning.
Each team was to visit exactly the same number of docking stations, with routes measured at around 71.7km +/- 1km maximum, to make it a genuine equal challenge.
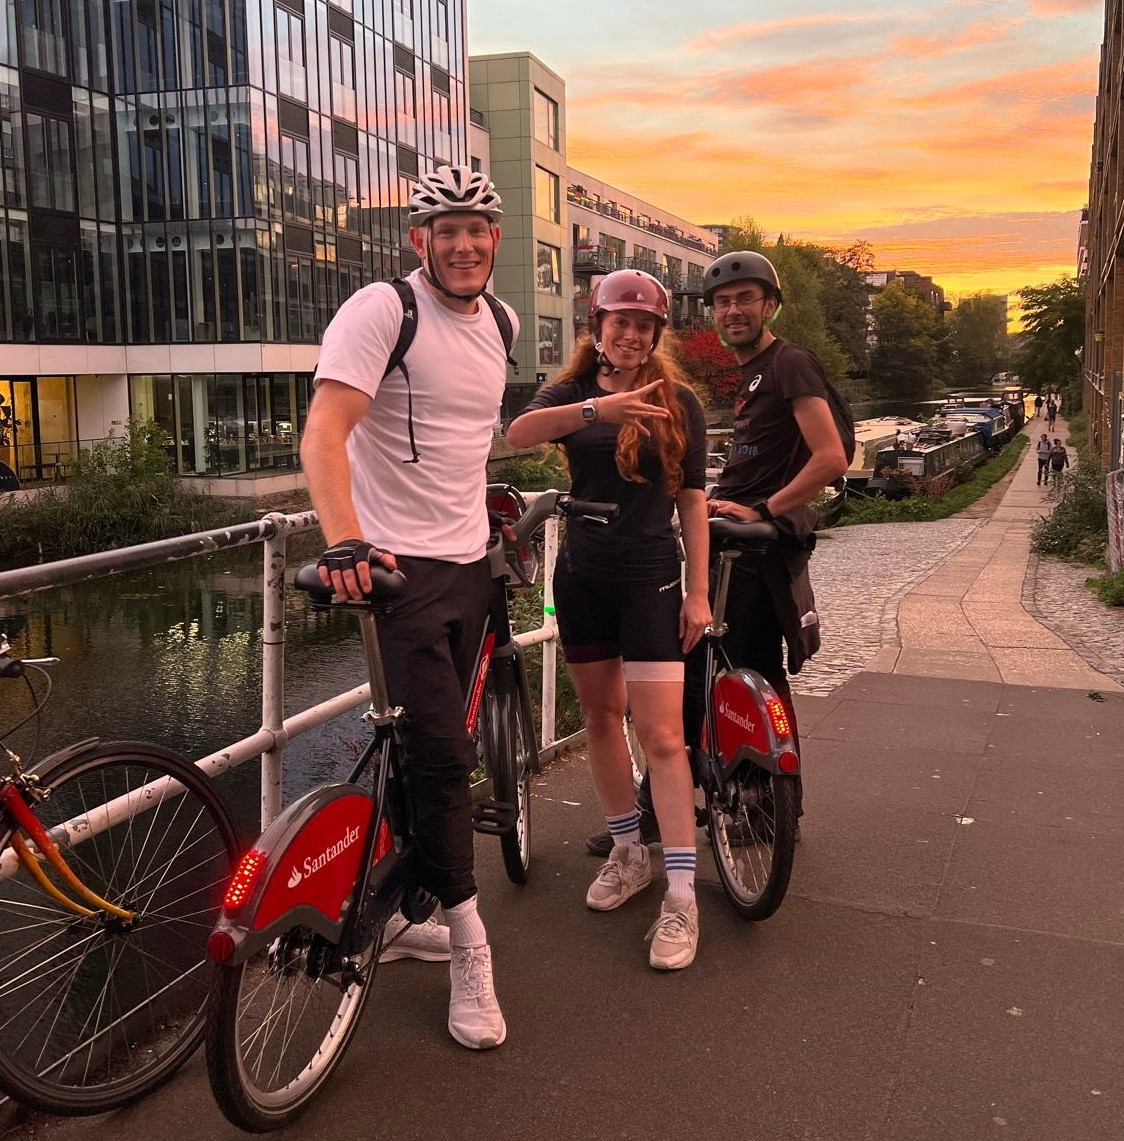
I was on Team West this time, with Westfield London and Hyde Park being the highlights, contrasting from the Olympic Park and Canary Wharf last time round. Team West was an all-UCL team.
(Route courtesy of West Team lead rider Dr James Todd)
What went right?
Nearly everything this time.
All teams started and finished. Four of the five teams finished within 5 minutes of each other, which I think is great after nearly 8 hours of cycling. One team finished half an hour quicker than the others, and therefore won, but then they did skip stopping for lunch. Fair play to them.
The weather was good, and Sunday traffic was light so the challenge was more pleasant.
TfL didn’t open any extra docking stations during the day, so no on-the-fly replanning was needed.
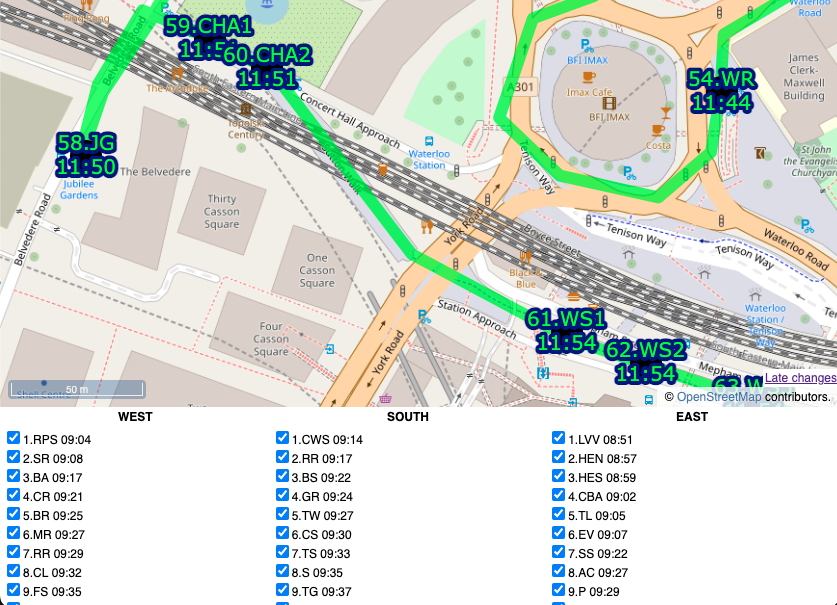
All teams used my online map to record their docks so we got a nearly complete dataset (albeit with a few errors in it) showing the teams docking.
The challenge had an official website this time, courtesy of overall coordinator Stephen Bee.
Prof Wood at City used the live API to generate some really nice live visuals of the progress, which he later turned into an animation:
The routes seemed to work OK – there were some quirks, such as the nearly 2 mile cycle North Team had across South Hackney to get to the Olympic Park. Originally, this area was Team East, but adding this in to the Team North route was essential to balance the lengths of the different routes. For Team West, we only had a couple of no-entry signs that I hadn’t anticipated and the odd road closure due to building work. Team South and Team Putney both had to cross the Thames four times.
This time I put each stage (stages are approximately 10km or 1 hour of cycling, so each team had 7 stages) through a TSP solver – I wrote some Python code to make appropriate calls to an OSRM server (routing.openstreetmap.de) and modify the results to create a GeoJSON, viewed in QGIS. Unfortunately, the pre-defined vehicle profiles available on the server meant that the cycling routes avoided trunk roads, whereas in London they are generally fine to go on, and also the router was too enthusiastic about using pavements for quite long sections, and even steps (a no-no for the 25kg Santander Cycles bikes). Next time, I would run my own OSRM server, with a a custom defined profile more suitable for London cycling. But the routes generated did suggest some optimisations and I was able to reduce the route lengths by around 1%, in places substantially rerouting sections. So, a win overall for using TSP engines.
Everyone seemed to enjoy themselves and the ~4:30pm finish was ideal for a couple of pints outside at the pub opposite.
What went wrong?
The biggest problem was the London 10K. This was happening almost unbeknown to us, except that I luckily realised it was happening and going to be a problem, when I read a TfL summary of events happening, the night before. The impact was quite major on the start of the event – I suspected that TfL would, unannounced, turn off a number of docking stations, but worse, the route was blocking the first stage for two of the teams – Team Putney and Team West started right down the race route. Urgent replanning the night before was needed. Team Putney did a dramatic diversion out via Waterloo and Lambeth Bridge (taking on some Team South docking stations). In compensation, Team South picked up some of Team Putney’s docking stations at the end of the day. Team West’s route would also be blocked at Regent Street. In the end, a diversion around Oxford Street, and a bit of replanning to add in a loop, didn’t lengthen the route too much. In the end, 5 docking stations were indeed turned off, they came back online in the mid-afternoon, just before the teams closed in on them, so all’s well that ends well. Probably, Team Putney could have sneaked down the race route, as the race started at 0930 and we started at 9am – and the course wasn’t completely sealed off until the runners started.
My team (Team West) suffered a couple of technical problems due to docks going offline. This meant that the bikes docked, but journeys did not “end” in the Santander Cycles system. Therefore, a new journey could not be started. These issues were solved with phone call to the helpdesk, however, the first time, the operator made us jog back to the previous docking station (as we had already cycled on with another bike/account) to confirm cycle numbers to prove we were there. Very annoying and we lost 15 minutes this way. TfL should know when their docking stations are offline. When it happened near the end, we again had to jog back, and used the remaining key for the last two hops. In the end, it didn’t deny us the win – we’d already lost that by having too leisurely a lunch. (Two accounts are necessary for the challenge, to avoid a 30 second account timeout between successive hires).
There were again some problems with the team version of my live map. The API response went quite slow during the day, even though I had tested it to work within a few milliseconds. This meant it was easy to tick, and then accidentally untick while waiting for the response to come back. Future UX tweaks would mean a confirmation needed to untick, or to tick a station later than the next one in the list.
Routes generally worked well but Team West was surprised by the sudden removal of the cycle track on the inner side of the Hammersmith Gyratory, necessitating a diversion and then some hairy lane swerves to get back on track. Sudden ending of otherwise good cycle infrastructure is a long-standing London quirk. Looking at maps, even now, I still can’t work out how cyclists are supposed to get from Talgarth Road (north side) to King Street. Maybe via Shortlands? But then why have such a great cycle path on Talgarth Road itself?
I need to automate the process of creating the routes and the files generated from the routes, particularly going from the GeoJSONs in QGIS, to the GPX route/waypoint files and the dock list. Like last time, I went through four iterations of the routes, each correction and publishing cycle took 2-3 hours.
Late changes, mainly relating to the London 10K replanning but also the need to get five route with the same number of docking stations and essentially the same length, meant I couldn’t include some “iconic” London cycling pieces in the routes – namely the Kensington Gardens Broad Walk, Parliament Square, or Battersea Bridge.
Team leads were given Go-Pros to wear, which were set to do time-lapse imagery, but these soon ran out of batteries. A different kind of device might be needed for this kind of thing.
We were expecting more on-the-day involvement from TfL (both technical and promotional) and some other data organisations as the event was part of London Data Week, indeed this set the event date. In the end, apart from Prof Wood’s excellent contribution above, we were on our own. It is possible some further outputs may appear.
Some final notes
All teams used at least one Santander Cycle between each dock, docking and undocking each time, to make the challenge official. There were no rules on what bikes the other members could be on, so one person had the great idea of doing ~55 minute rentals on the Santander Cycle electric bikes, each time. This is great because it makes the challenge more enjoyable, having an electric boost. It also will have only cost an extra ~£8 or so (as the surcharge for electric is £1 for up to an hour). The only drawback is no easy way to mount your phone on a hire bike. But i think I would be happy to trade that for an easier pedal.
Seven years ago, I wrote “We don’t have individual building age open data in the UK” – but that is no longer true!
The MLUHC (for England Wales) and the Scottish Government via the Energy Saving Trust have been publishing individual Energy Performance Certificates (EPCs), for both residential and non-residential buildings, for several years now, and the records go back to 2008 and 2013 respectively. As all new properties require EPCs, and they are also required regularly for rented properties and house sales, the proportion of buildings with these certificates has gradually increased, to around 50% of properties (around 40% in Scotland).
One of the attributes available on the domestic certificate bulk data is the approximate aged of the building – in approximately 10-year age bands. However, linking this to a location used to require using the decidedly non-open AddressBase columns in the dataset. However, more recently, the publishing authorities have added Ordnance Survey UPRNs (Unique Property Reference Numbers) to the data – and this can be linked with the UPRN Lookup tables published by the Office of National Statistics (ONS) which contain locations (eastings and northings) of the UPRNs, which typically are the front door of each property.
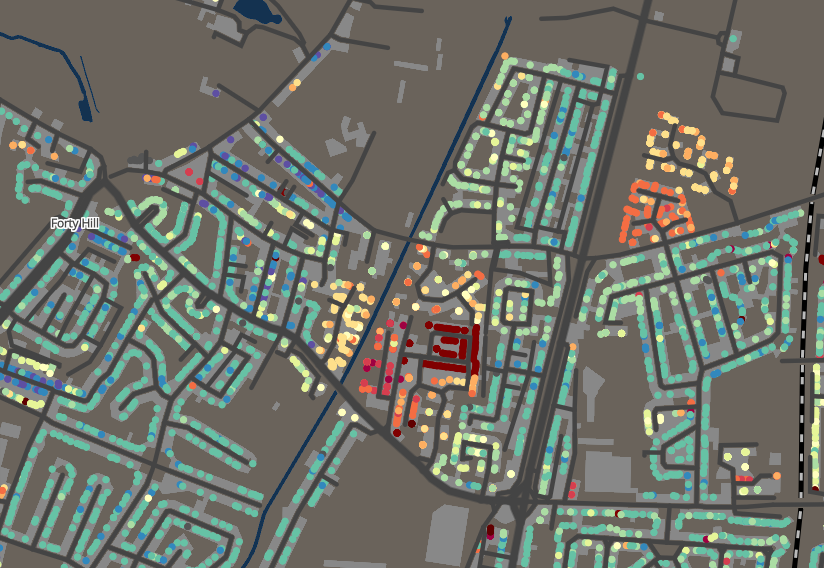
By combining the UPRNs with the lookup, it is now possible to map building ages, for around half of the individual buildings in Great Britain. Moreover, it looks increasingly possible to distinguish residential from non-residential buildings (some have both uses, of course) which will potentially be a very useful attribute when mapping residential data, with the ability to blank out non-residential buildings. Many of CDRC Mapmaker’s maps show data based on the residential population only, so colouring business park buildings with the data never made sense.
The individual building data also allows a more precise look at the different areas of cities, based on their built form. The exact extents of housing estates, or Victoria terraces, are now obvious, from sharp changes in building age, tenancy type and floor area compared with neighbouring blocks, which sit in the same LSOA/Data Zone – the previous smallest unit of building age detail, from the previous best-resolution open-data dataset, from the VOA.
As part of this project, on CDRC Data I plan to, as soon as I am able to*, publish the individual (UPRN-by-UPRN) building attribute data, across Great Britain. I’ve also aggregated by Output Area (2021 for England/Wales, 2011 for Scotland) for domestic properties, and by Workplace Zone 2011 for non-domestic properties. (*Currently some other work on EPC data is being carried out at CDRC and that may take precedence.)
I’ve mapped these on CDRC Mapmaker. Using the PWC (population weighted centroids) for these, and mode/median based aggregates, allows aggregated representation of the data, when looking it at smaller zoom levels on the map. Zooming in reveals the individual building data. PWCs are useful because they retain the urban form – rather than arbitrarily assigning each OA to, for example, a river running through a development.
The inspiration for this project – mapping the age of Britain’s buildings – comes from this old but excellent example from the Netherlands. There is more to be done – assigning estimated ages for buildings nearby confirmed ones, and colouring in each block rather than just assigning a dot to a doorstep – which will follow.
I use buildings and properties interchangeably here – a property is a housing unit where a family/social unit live, and has an address – it might be in a single building or spread across several, and (more likely) a building may contain lots of addresses and properties, such as a block of flats.
In an effort to focus my (now rather limited) spare time on a more nuanced set of web projects, I have consolidated some websites.
Three Blogs into One
I have combined two other blogs into this one:
blog.oomap.co.uk – My personal blog, with notes about London, orienteering and cycling. This was my original blog “YepSport” (also known as “Yablog”) and goes right back to 2003.
bikesharp.com – Writing about shared micromobility in the UK. This blog has had less writing than I had planned, as shortly after I started, I was contracted to write similar articles for Zag Daily, for the last couple of years (I have now stepped down).
I still write another blog – Mapping London – which will stay separate for now.
OpenOrienteeringMap Leaves Home
I have also switched OpenOrienteeringMap from my own server/website to David Dixon’s excellent “version 4” rewrite.
OOM has been going since 2009, with saveable maps and a UI redesign in 2013 (version 2), and the ability to generate MapRun-compatible maps (JPGs, JGWs and KMZs) in 2020, capitalising on a boom in popularity for self-run orienteering races during the early months of the COVID crisis and resulting lockdowns (version 3).
However my version had a number of limitations – it used its own copy of OpenStreetMap rather than APIs to the master copy, resulting in delays to people’s edits appearing on the map. It also had very limited contour coverage (10m contours, and GB only). Finally, the actual mapping was inflexible, e.g. you get fences whether you wanted them or not. There was no per-feature toggle.
All of these problems were fixed by David’s rewrite. The only step back is you don’t see the actual orienteering style on the screen, until you generate the PDF. But David has added a Preview button, so the software can go off and generate it on the screen after all – you just need to wait a few seconds.
BikeShareMap and the Meddin Bike-Sharing World Map
Finally, I currently run/contribute towards two websites mapping bikeshare systems around the world. BikeShareMap shows individual docking station statuses, for the ~600 systems for which there is such data. The Meddin Bike-Sharing World Map maps all the bikeshare systems in the world – but just as a single pin, per city.
I have been gradually consolidating the two projects – the first stage has been to use common IDs and split outs for each city, this is now well underway. The second step is to harmonise data input across the two websites, rather than double-keying, as at present. The final stage (which is some way off) will be to integrate the BSM function into the Meddin project.
At the end of each year (normally between Christmas and New Year), there’s a lot to tidyup across Bike Share Map (BSM), the Meddin Bike-Sharing World Map (BSWM) and the UK Shared Micromobility Dashboard. This year, I’m aiming to document all the changes needed, roughly around the time that I make the changes.
Monday:
Superpedestrian (aka LINK) have unexpectedly changed their URL prefix for their GBFS feeds from https://wrangler-mds-production.herokuapp.com/gbfs/{City}/{file}.json to https://mds.linkyour.city/gbfs/[2.2/]{a2}_{city}]/{file}.json. Superpedestrian run the Nottingham escootershare, the fifth largest city for the mode in the UK, so it’s good to have the live data back for that. They also run various other escootershares around the world.
A number of the UK shared e-scooter trials ended at the end of November: Slough (Neuron), Canterbury (Bird), West Bromwich (Voi) and Sunderland (Neuron) – the last due to be replaced by a new Zwings fleet but this will not now launch until the new year – a significant service gap. The Neuron systems had open GBFS feeds (as does Newcastle, their last remaining UK one, although at the time of writing it is returning a 503 server error), so could be tracked live. Canterbury and West Bromwich unfortunately aren’t. I’ve stopped consuming the GBFS feed for Slough and Sunderland.
In addition, there have been very few (if any) escooters visible on many of the Ginger systems, on their app – Milton Keynes (where they compete with Lime and TIER), Hartlepool, Scunthorpe, Whitehaven and even Middlesbrough (the first trial to launch). Only Chester and Great Yarmouth are still going strong. As is often the case with Ginger in particular, there is no news about this. Maybe they are just taking a Christmas/New Year break? The parking locations and zone boundaries still show in their app – but they do for Stafford too, where Ginger pulled out in late 2021. There are GBFS feeds available for some of the Ginger systems, through the Joyride white-label platform they use.
Normally I stop consuming individual GBFS (and other API) feeds during a system’s winter closure period, however the variation with when systems reopen in the new year mean I often miss a few days (or weeks!) when they do restart, so this year I will keep consuming the empty feeds. I am gradually building a guide to indicative months that systems close and reopen, on BSWM, and will correlate this with the data seen in BSM (where available) and publish this additional static data, some time next year.
Lincoln’s tiny Hire Bike website’s certificate has expired, apparently without the operator noticing, so I needed to skip verification of it when getting the website data. To be fair, it did expire on Christmas Day…
Aberdeen’s Bike Issue Bikes ebikeshare finally opened in early November – perhaps with some of their bikes from their recently closed Bristol operation. I have updated the BSWM entry.
Down the coast, the Dundee ebikeshare has gone into a longer winter hibernation this year – more of a temporary closure during a quite time of the year to improve the fleet and operations, rather than snow/ice led, although Scotland is certainly getting some weather at the moment.
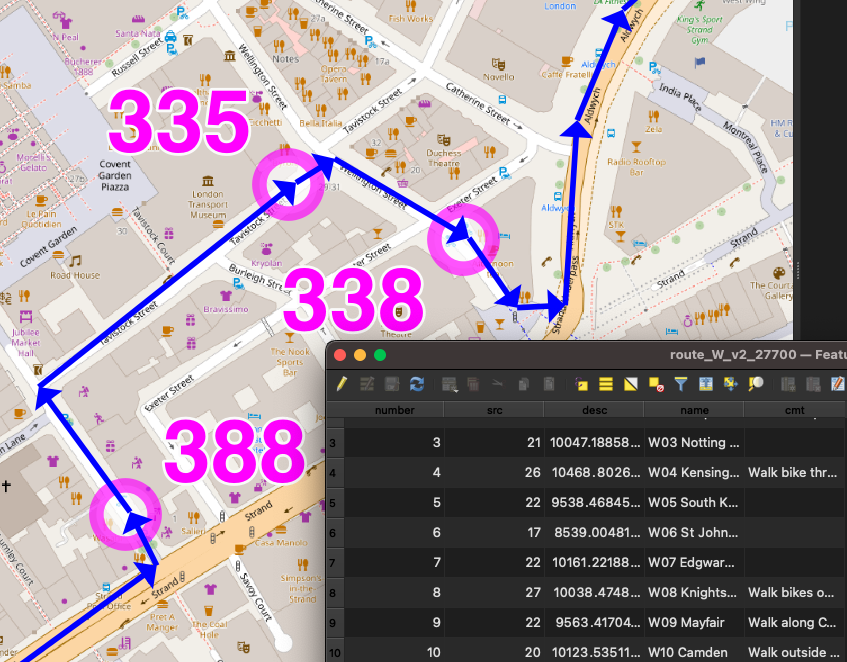
I created GPX route files for the challenge. These were created manually in QGIS, using the OpenStreetMap standard “Mapnik” render as a background, by drawing lines, with Google Street View imagery used to check restrictions.
I split each team’s route into 12 stages (so 36 altogether), which were initially each just over 10km and ended at a docking station. Each stage contained between 10 and 40 sequential legs to docking stations. I’m not sure I would trust proper routing engines (based on Google Maps or OpenStreetMap, normally) to have found better routes on each leg between each docking station, than me and Google Street View, largely because many London boroughs have been experimenting a lot recently with Low Traffic Neighbourhoods (LTNs) and modal filters (e.g. two way for bikes/one way for cars). But I did run a TSP solver (RouteXL) on 3 of the stages and in 2 cases it did find a slightly shorter ordering of the legs, within the stage. So I would probably use a TSP solver more for a future iteration of the challenge.
The three route/team files were saved in British National Grid (EPSG27700) GeoJSONs (technically not allowed by the spec) so I could get proper metre distances ($length) auto-updated into a column, for each stage, during planning. The stages had a number column, and were numbered sequentially. Having a number column results in LineStrings in the GeoJSONs and GPX routes/routepoints rather than single MultiLineStrings and GPX tracks/trackpoints. They were then saved as WGS84 GPX files. I (mis-)used a very limited set of column names (name, number, src, desc, cmt), due to the restrictions with the GPX specification – I didn’t want to use GPX extensions.
It was important to have three separate GPX files so that each team would need to load in just a single file to their navigation device and not see docking stations/routes from other teams). But it did make preparations a bit harder for the online map.
The docking stations were imported in via a TSV file, then saved as GPX waypoints (column names again restricted to src, desc, name, and cmt), and the relevant ones were manually appended to the GPX team files. The GeoJSONs were retained as my master editing files, as QGIS cannot easily edit GPX files due to them containing multiple geometry types.
I would certainly like to try a more automated approach to the routing. It did take a substantial amount of time – probably two evenings for each of the three routes, and a further evening for each route to enumerate the docking stations, fine-tune the routes and reorder any sliced up GeoJSON LineString segments (part-stages) back into the correct sequence. The reordering was needed as QGIS would incorrectly reorder parts of the route that crossed over itself, when it was sliced up.
But an automated approach would require a method that deals with docking stations that are just 10m down a no-entry street (so you’d just walk it), which is hard. Currently they are represented as a point defined by TfL through their API (and separately in OpenStreetMap) which may be the location of the “totem pole” kiosk but not the docking points themselves. In routing or GIS systems, the docking station needs to be represented as an area (within which you would walk the bikes) plus a (multi-)line (representing the line of dock points – some of these are quite long – some have significant gaps, and sometimes they are split on either side of a road). Potentially, the point representing a docking station really needs to be an area, and that area can extend up to the nearby road junction to deal with the one-way issue.
Future Improvements
In terms of the general design, a few things could be changed for a future challenge (some of these I mentioned in my previous blog post):
Ensuring that participants are well away from the finish at around the 60-80% stage, so that they are less likely to bail at that difficult time of the day, because the remainder of the challenge is then a kind of “run in” to the finish, rather than routing them away at a late stage.
When participants pass by another docking station twice, they should visit it on the first occasion, not the second time. (An exception is when it is on the wrong side of a dual carriageway, particularly one with a median barrier). Otherwise there is a danger of it being missed on the return.
Build specific meal stops in.
Maximum of 200 docking stations/10 hours per team.
The Web Map
By comparison, building the web map was straightforward, probably just one evening’s work to build the map page itself as a basic OpenLayers map reading in GPX files and with simple browser-based geolocation, and one further evening to build a “team” version of the map that allowed ticking off the stations, the action being stored in a database, and a time string echoed back to the web map (and other viewers, on a Javascript timer) as confirmation. The database had two tables, a summary table with a row per docking station, and an action log which recorded the dock’s TfL ID, timestamp, event type and the submitter’s browser user agent string ($_SERVER[‘HTTP_USER_AGENT’]) in lieu of logins/IDs. It was fairly easy to assign a manually assign each user agent to team, post-event.
Each docking station ended up with 4 identifiers which feels a bit too many, but it kind of made sense:
an integer TfL ID (e.g. 761)
the TfL Name that appears on the totem pole (e.g. Gower Place, Bloomsbury)
a shortcode which was the sequence number and the initials of the first part of the TfL Name (e.g. 37.GP). There were some duplicates across the team. FIN.HS was a special shortcode for the finish for the two teams that didn’t have that as a docking station in their “zone”. One newly added docking station had “A” appended to the sequence number of the previous, rather than having to renumber everything.
a unique sequence code which was the team, stage and docking station order within that stage, (e.g. W02.15). This was used as a logical ordering of the file and to help with assigning each docking station to its stage on the online map.
I also listed an “actual sequence” post-event ordering, e.g. W038, in the final results file.
I could have used the sequence code on the map but felt the shortcode was the most useful concise way of identifying each station to the team as they approached it, and hopefully the simple number would result in any missing out being spotted quickly.
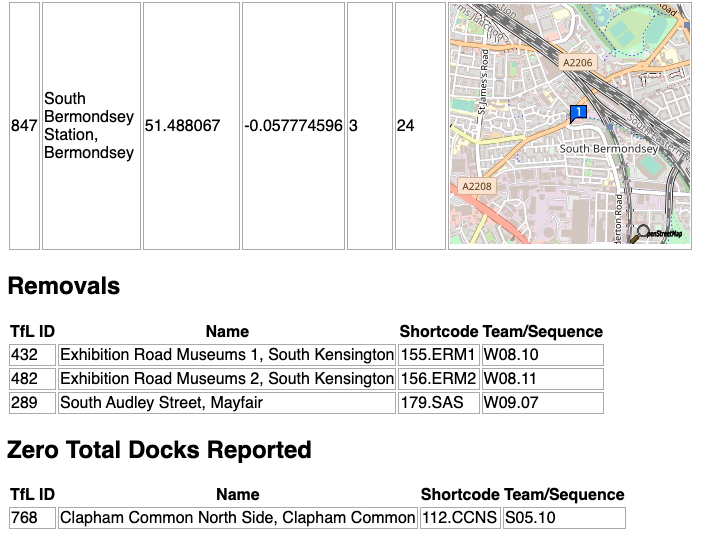
I built a special “diff” webpage that compares our docks file with the live data (via BikeShareMap) every 2 minutes and this alerted us of any new, closed or zero-capacity docking stations, plus a list of full ones. There was one that opened a few days before, but none on the day, thankfully!
Future Improvements
I do think that using fewer intermediate routing points on each leg would be better and would allow for turn-by-turn satnav directions. Having said that, having street names called out is of limited use as they are often hard to spot on the ground, so the breadcrumb trail approach we used worked well.
We had paper maps (just screenshots of the website) as a backup. I never used them, and I think Team South used the website. Team West used them exclusively, with a separate person using the website to tick off.
I would have liked to have had a single source of docking station locations. In the end, they were:
on TfL’s API, which is fed through to a CSV on BikeShareMap every two minutes,
on a CSV file on Github,
as GPX waypoints appended to each team’s GPX routes file, and
in my database for recording times on the ATDMap website.
1 and 2 were automatically compared (see above), 2 could be added to QGIS to compare and generate GPX for 3, and also imported into the database table (4) but this would all be manual steps.
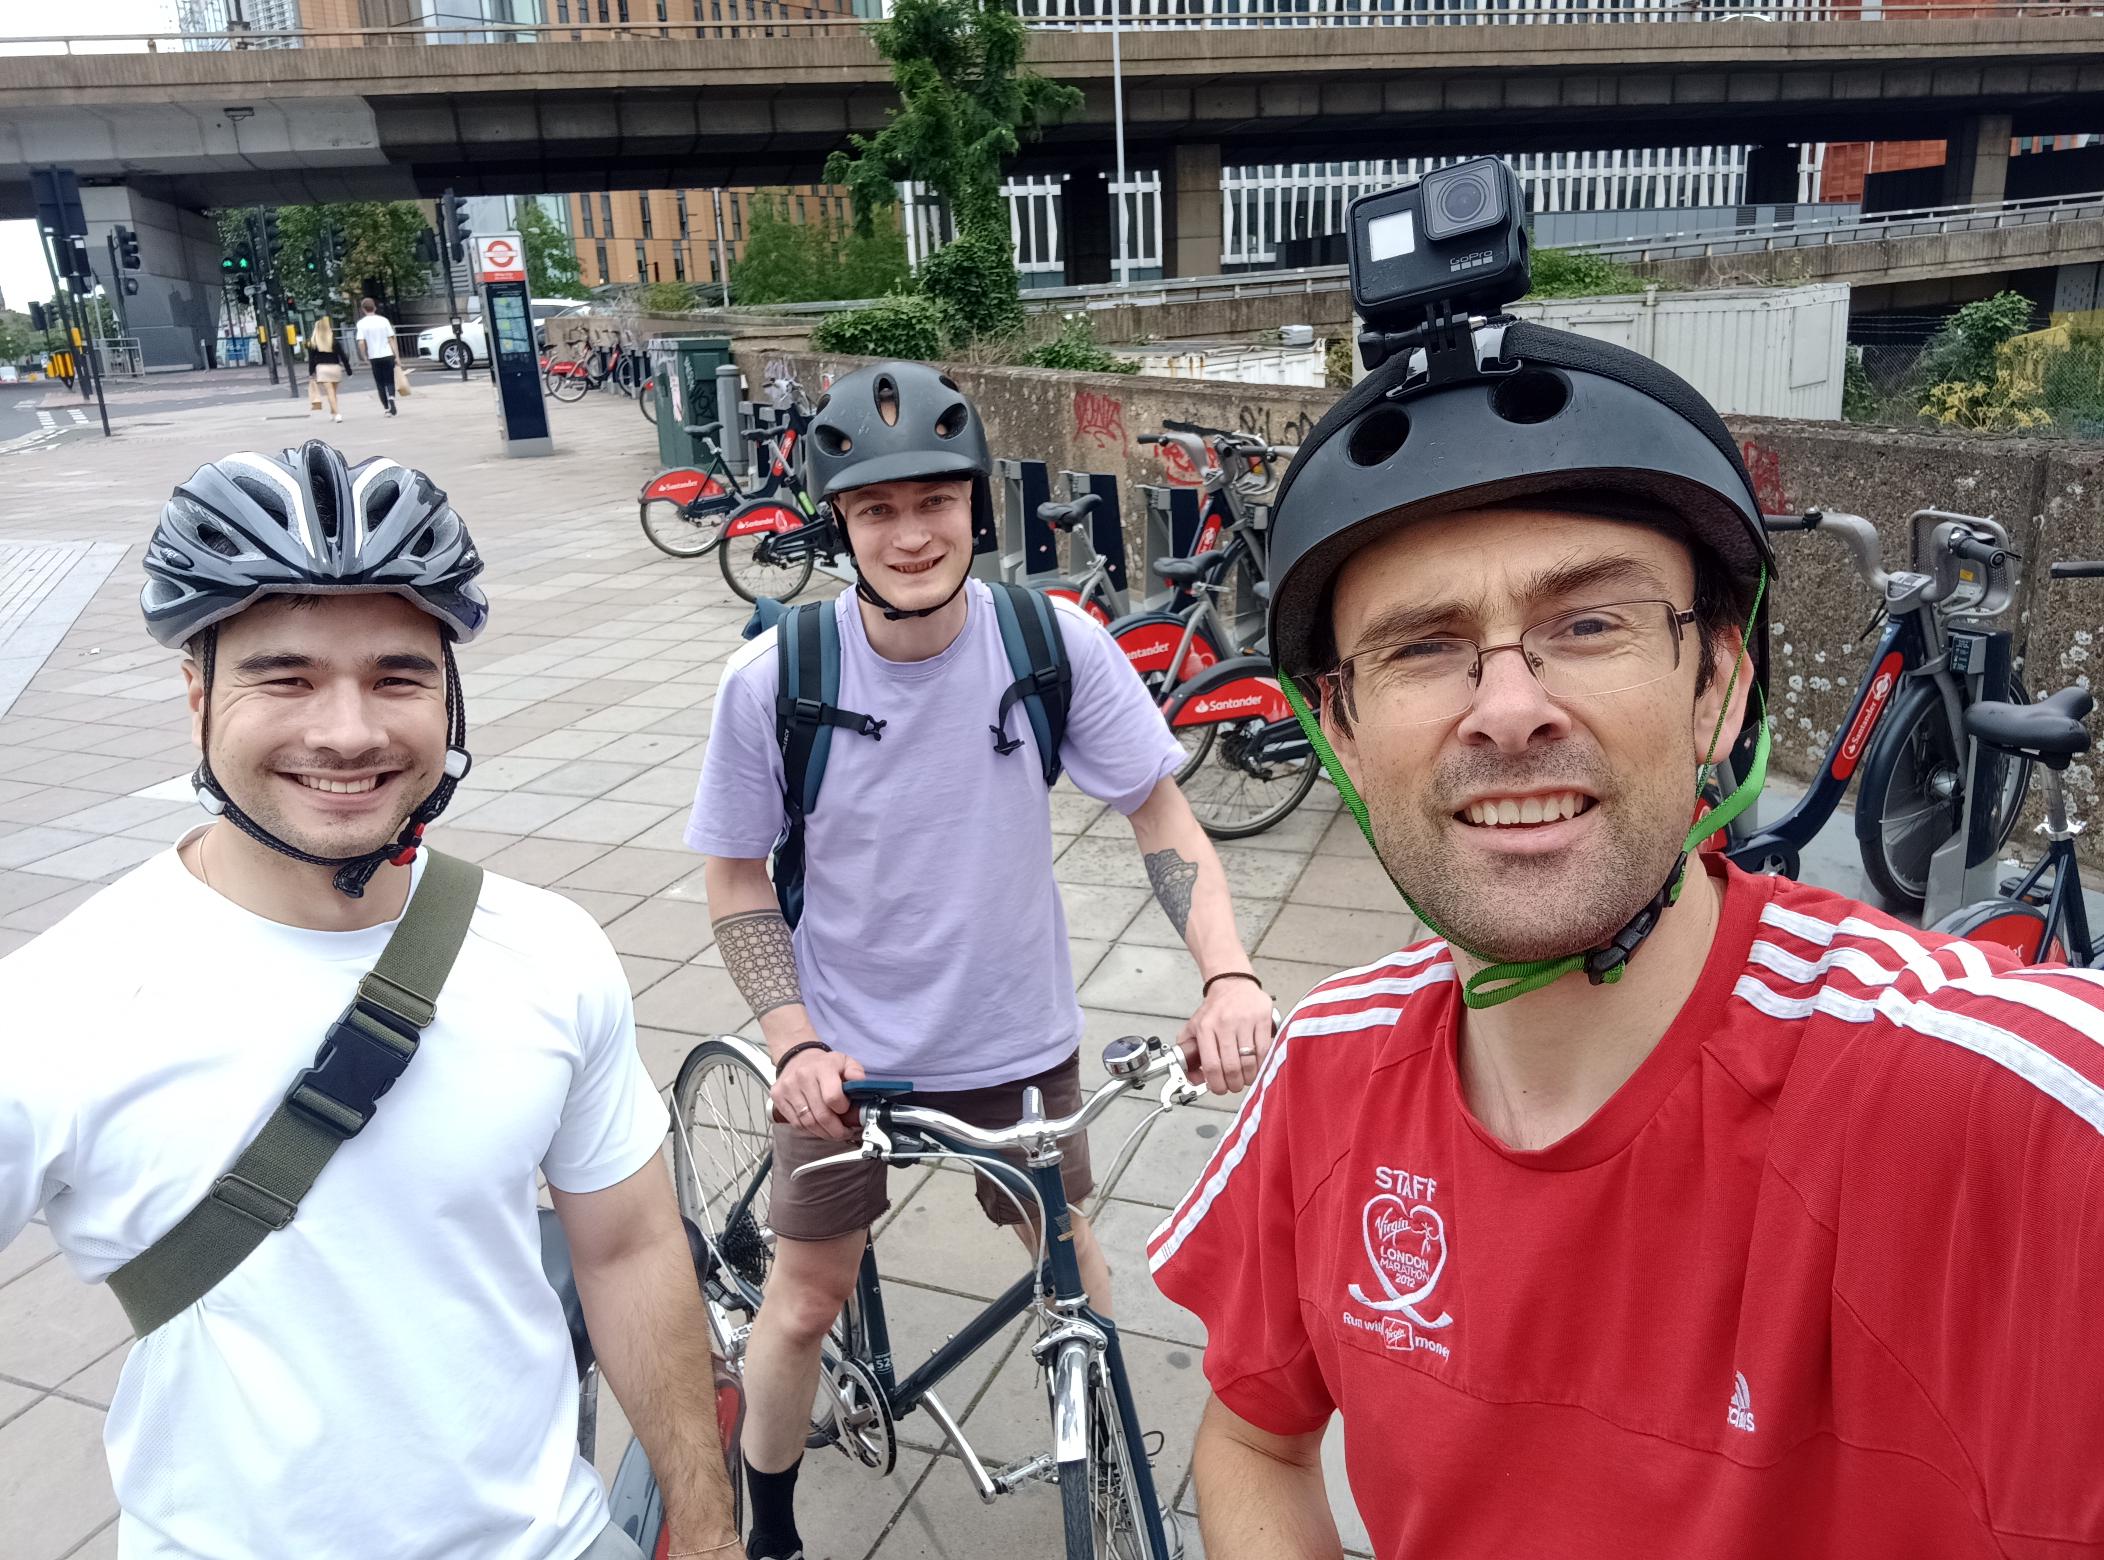
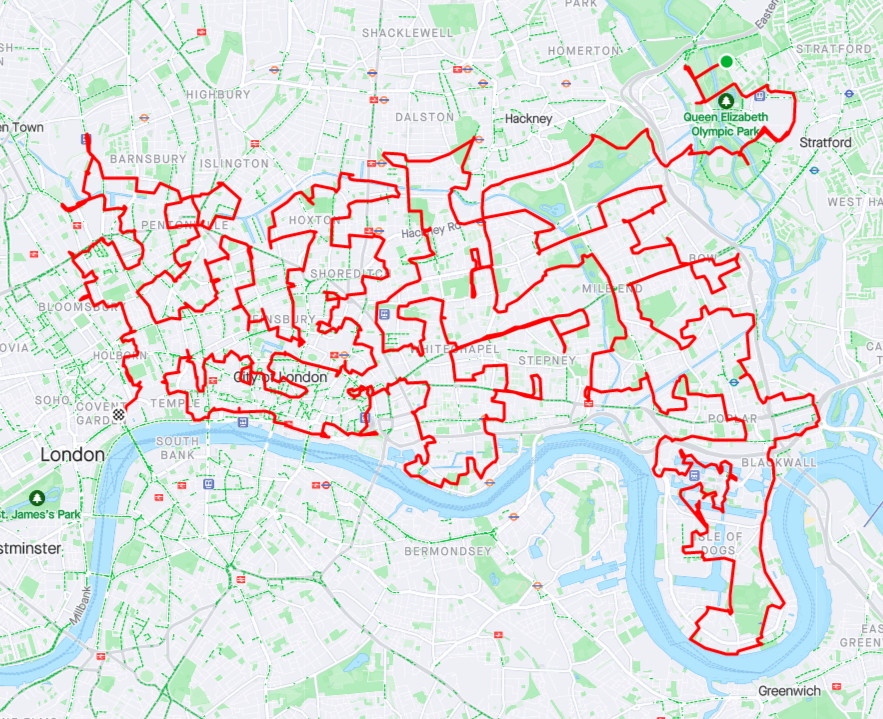
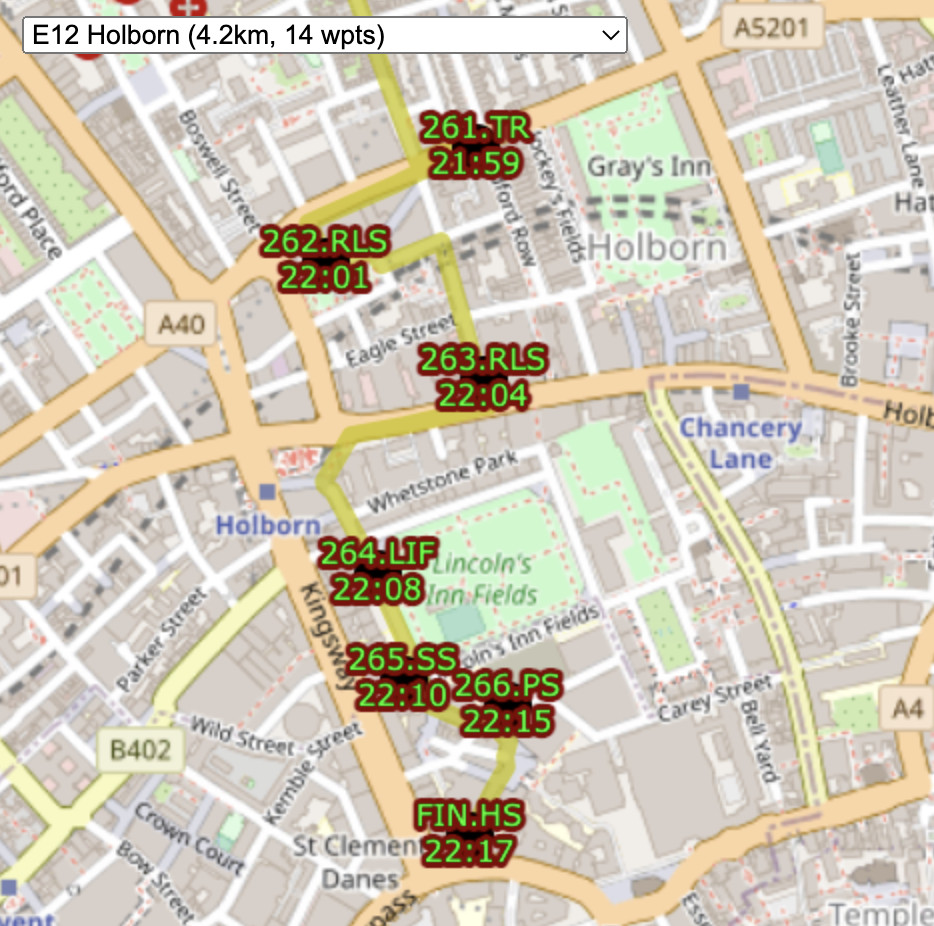
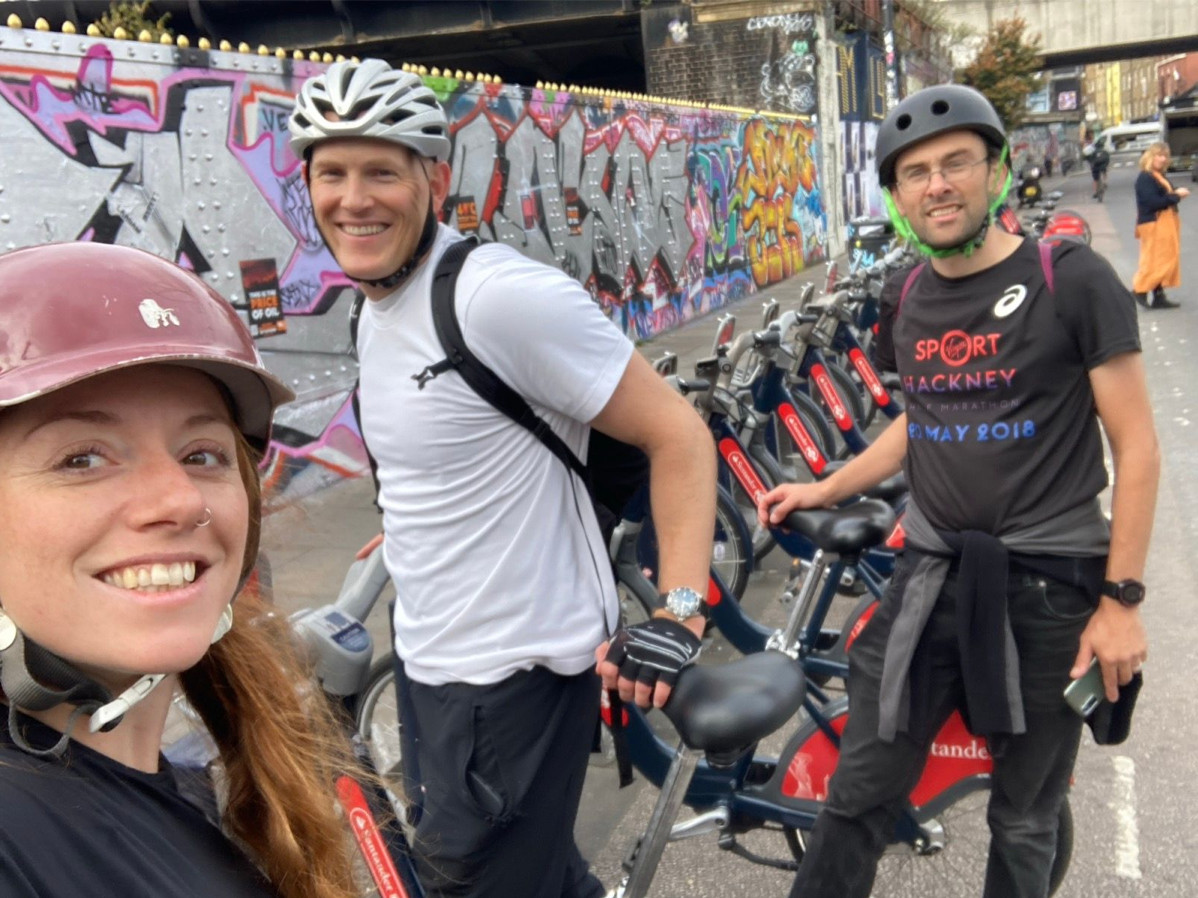
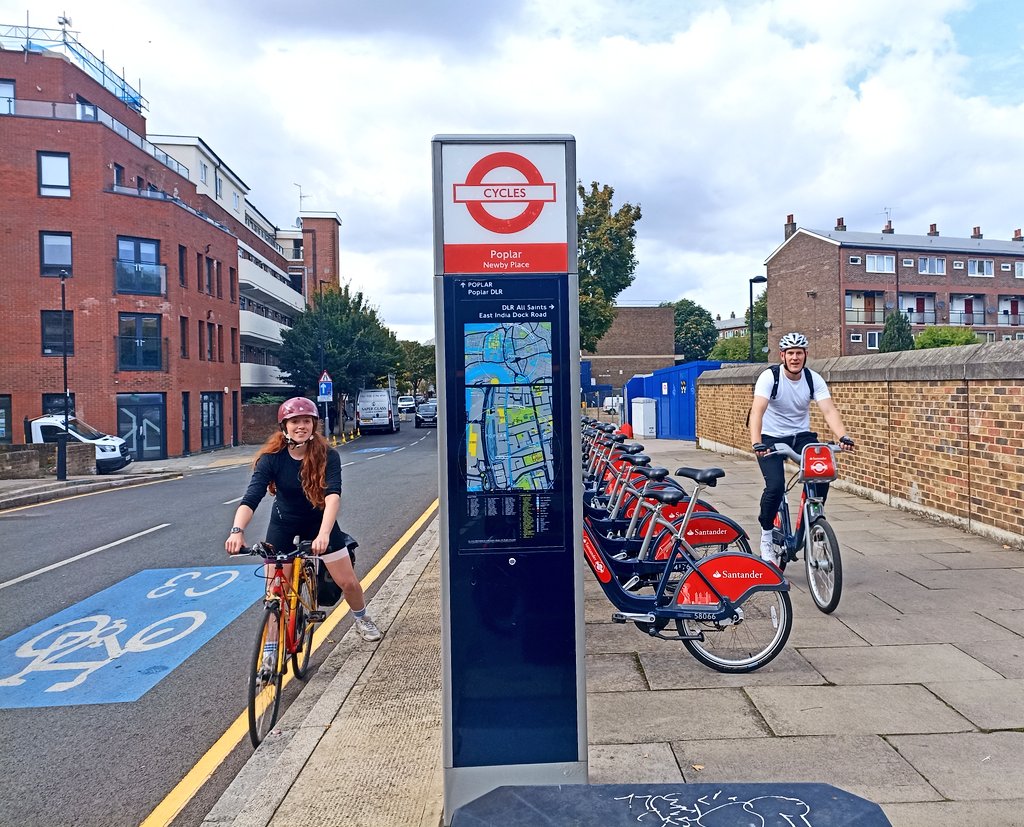
On Monday I spent a lot of time (over 13 hours) cycling between 268 docking stations in London. It was for the All the Docks challenge, as part of Team East, with Joe (Be.EV CCO, and ex-ofo) and Jeyda (fettle CEO). There was also an all-stars Team West and Team South (including Voi, TIER, Zwings, and CoMoUK people – see this blog post for the announcement), and, across the three teams, we aimed to visit all the docking stations in London in a day.
Three challengers: two on Santander Cycles (one docking at every point) and one on their own bike with navigation mount.
Started at 08:51, after getting breakfast nearby.
Two stops for food (at 13:30 and 20:15) plus a shorter stop to buy snacks (at 16:30).
Three lifts (which weren’t big enough for three bikes!)
Finished at 22:21 – 13.5 hours later
GPS says 119km although it added a lot 0f noise around Canary Wharf and a few other places, so I think the actual distance was more like ~113km.
268 docks visited (the 266 assigned to Team East, plus the common finish docking station, plus a short bonus leg to the docking station outside the finish pub).
This works out as visiting a docking station, on average, almost exactly every 3 minutes, for 13.5 hours.
It did take a bit longer than predicted. The target time had been 12 hours (11.5 hours + 30 minutes in breaks) and our average moving speed of 11.9kph was quite close to the 12.5kph in a prediction algorithm I put together. The two hour difference was due to food stops and comfort breaks (75 minutes in total), along with that 0.6kph speed difference (30 minutes extra) and the three legs we I had to jog (15 minutes). Our dock/undock speed got pretty good after Joe (who did 80% of the docks/undocks) got into a rhythm.
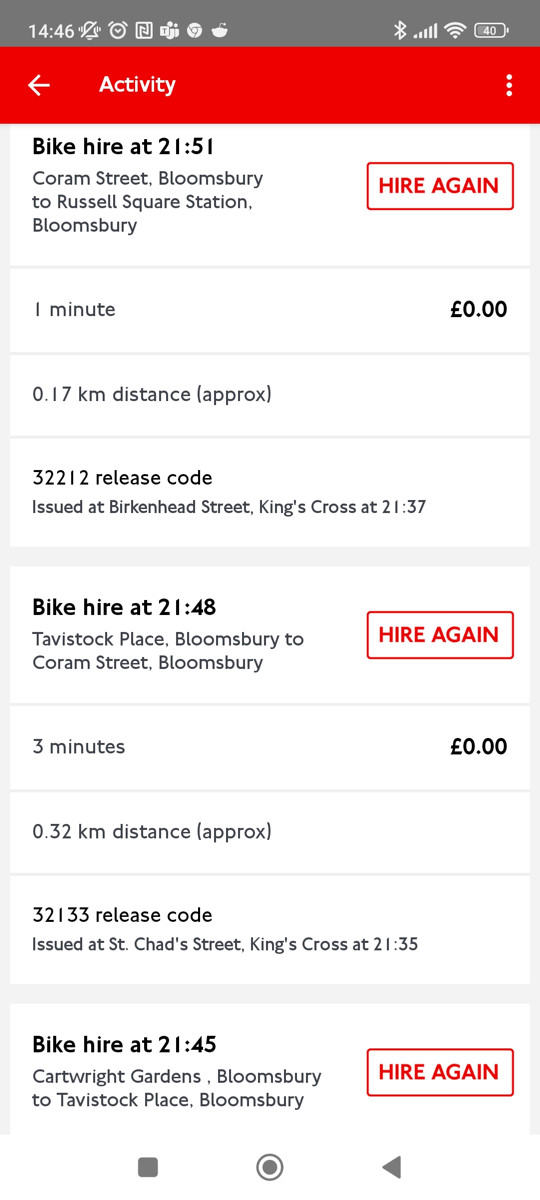
My personal bike (which I had planned to ride as a support to the team leader on the bikeshare bike, to do the navigation) had a flat tyre right at the start, which meant I had to hop on a Santander Cycles bike for the entire route. I had a big freak-out when I discovered this (no bike shops in Westfield Stratford City, challenge starting in half an hour) but it was OK in the end – I bought a £20 monthly membership in the app, on the spot, and the ride was more comfortable than I expected, but it did mean I needed to keep fishing my phone in and out of pockets at every docking station.
I also twice forgot to dock at least once an hour, twice, so got two £1.65 overage charges).
A result of my phone (with map) not being mounted on my bike, was I was constantly pocket-tapping the team version of the map as I kept grabbing my phone. This mean I kept ticking off other teams’ docking stations by mistake, particularly Team West’s list. The team version needed a UX tweak so the checkboxes’ labels were not tickable, or have separate tick-pages for each team.
The only significant routing error was at Import Dock in Canary Wharf (no regular Google Street View allowed there, so I couldn’t see in advance) where we ended up at road level, but the docking station was below us, at water level. Taking the bikes down an escalator in the new Crossrail/Elizabeth line station, got us to where we wanted to be.
Proper food stops need to be built in to the schedule, rather than hoping we accrue time and then spend it when we need it. We got hungry in places were there weren’t any quick eateries.
Three legs had to be jogged by some rather than cycled by all, due to infrastructure problems, although we still docked or undocked at each. At the first one, both Joe’s keys stopped operating and the dock was full so I couldn’t dock (with my third account) either. So I cycled to the next docking station, docked, ran back and undocked. A later problem dock wouldn’t release any bikes so I handed mine over and jogged to the next station to get another one. Finally, three from the end, the terminal disconnected after docking successfully, so I ran back to the previous one and went from there to the penultimate one.
One or both of our pair of keys got temporarily blocked several times. With one blocked, using the other, single key resulted in a mandatory 30-second delay before you are allowed to start another journey. Each time, a call to Santander Cycles support fixed the blocked key quickly. Santander Cycles does have a responsive and effective telephone support operation.
One docking station appeared to have been vandalised, with the “slot” on most docks crushed so that the bike couldn’t be docked. Eventually we managed to find one where we could squeeze it in.
Routing people near the finish, then up a hill and away, 10 hours in to the challenge, is demotivating, and coupled with the late time, I think this is what made Team West’s decision for them. A long, clear run into the finish line without big loops away, is preferable! In general, my design for West and East was a long wiggly route up and down, towards the finish, from the outermost parts of the network. By contrast, Team South went near the finish quite early on, before a long tour out to Putney, finally coming back along the river, back into town. I think this latter overall shape of the route probably is better for keeping people going to the end.
A few of awkward wrong-side-of-road docking stations on dual carriageways had to be visited, although generally with traffic lights, we got across OK. The worst link was a short section of The Highway followed by a right turn. This is a horrible road, and the others in Team East took the pavement instead (but were further encumbered by barriers left up from the London Marathon the day before). In retrospect, a walk-bikes route back across a new private development’s plaza would have been better.
A few roadworks made getting to some docking stations tricky. In the end, Team East had four blocked links – resurfacing by the Orbit sculpture in the Queen Elizabeth Olympic Park (where we just cycled through the construction site), park re-modelling in Shoreditch Park (which necessitated using park paths to get around it), Angel Street was closed for building construction (so we went through Postman’s Park instead) and finally St Bride’s Street was completely blocked for resurfacing, but the Poppin’s Court tiny alley diversion was a lot of fun.
The low point was at around 7pm, as the sun set, calculations suggested all three teams were well behind a nominal 9pm finish, and it looked like we would have to bail to make it to the pub. There was also some concern about what it would be like doing this kind of frantic point-to-point riding at night in London traffic, with tired legs, although in the end the traffic levels died down quickly after rush-hour. We also hadn’t had dinner and a proposed food stop at Angel was still 90 minutes away. A conference call between teams was held and a final decision at 9pm would be taken.
We approached the Somers Town Bridge at around its historic 9pm closing time (not sure if it actually does still close) so decided to take a long diversion around.
In the end, just after 9pm, we passed by our team lead’s home (25 from the end) and, with one eye on a very early start the following day, he opted to stop there. Team West had already quit and were arriving at the pub. Team South decided to double down and keep going. Their final stage along the spectacular Embankment at night, with views across the Thames, may have helped with their decision! We carried on for a final section around King’s Cross and, in the end, quite quickly down to the finish at LSE.
What went well
By and large my manual routes worked pretty well. For Team East, there were only a couple of banned turns and one wrong-way street encountered, easily fixable on-the-fly. The teams were pretty happy with my routes, which is good!
Careful planning tried to minimise the number of docking stations on the other side of busy roads, even if this slightly lengthened the route.
I was pleased I could include some of London’s best cycle infrastructure without lengthening the routes. The Olympic Park, Victoria Park, Regent’s Park, Hyde Park, Kensington Gardens, Lower Thames Street and Victoria Embankment (CS3). It was nice, on the day, to unexpectedly discover some of London’s newer protected cycling infrastructure on roads I knew well from pre-protected days.
After a while, we honed our docking/undocking technique and Joe got it down to around 15 seconds. Every 10 seconds saved per dock is 45 minutes saved on the challenge as a whole.
Considering the amount of docking/undocking operations we did, we had very few failed locks/unlocks or disconnected terminals.
My gadget batteries worked out OK. My old Garmin GPS wristwatch lasted 9.5 hours (albeit with no HR or Bluetooth), and then the last bit of route recording was done directly on my phone using Strava in the background. I only used GPS on my phone sparingly, to occasionally locate myself on the web page, but after 11.5 hours my phone’s battery had got down from 95% to 3% so I kept it plugged into a power bank on a cable, for the remainder, and it was fine. Jeyda’s Wahoo’s battery was absolutely fine throughout.
We did visit all 268 docking stations, even if it took us nearly two hours longer than planned.
We all stayed in good spirits as a team, and generally stuck together, although we did split up a bit near the end as different people drove forward to keep the pace going.
I thought we might need an operations person at a desk, checking for changes, handling social media and directing/motivating teams, but actually it worked fine with everyone on a bike.
We crossed the finish feeling fine – it’s the day after that I felt shattered.
Notes for a next time
General consensus in the pub was that having four teams (N, E, S, W) doing around 200 docking stations each, would be more fun and would allow more pub time, food time etc. Team West ended their challenge after around 200 docking stations when it was clear they would struggle to get to the pub before closing time if they continued (and as they had to loop away from near finish at that point). Team South made it just after last orders so Team West bought a round for them in advance. But a decent length social after such an exhausting day is important.
Finishing at the docking station outside the pub would have been better (I had decided against it because the distances across the three teams wouldn’t have matched as well).
Hopping on and off the bike for each dock gets tiring. Particularly as so many of the docking stations are on pavements and facing away from the road, resulting in many kerb hops, jolts and awkward manoeuvres. Possibly alternating the docking between two leads would make this better?
You definitely need one person to have a bike-mounted smartphone or navigation device (Jeyda’s Wahoo device worked pretty well) to do efficient navigation on a mounted stand rather than in/out of pocket.
Having two keys (on two accounts) is essential. As well as cutting down the dock/undock time, it can deal with full docking stations.
Santander Cycles finally launched electric bikes into their fleet, a few days after our challenge. These would be good for support riders, if too expensive for the lead rider (£1 surcharge per leg!)
I/we would definitely invite people to accompany us for a stage or a few legs. We did have Ilma from Fettle along for the City of London legs which was motivating (and she filmed a mini-movie/montage of us)
I’m glad we missed the morning rush-hour and the evening rush-hour while we were in the City was pretty intense too.
Some routing tweaks would be good. See a future blog post here for some technical details on how it was routed and how it could be made better.
Finally, I think the mapping/recording could be automated more. I liked my live-updating map, it was the result of a few evening’s simple Javascript coding, but there’s definitely more that I could do – leaderboards, current location pin, ETAs etc.
One note on helmets – normally I would always wear a helmet on my own bike, but not on bikeshare bikes – we shouldn’t be encouraging it for bikeshare bikes as it significantly reduces their utility and appeal for spontaneous journeys. However – I’m glad I did wear one, because we were on the bikes for 12+ hours, occasionally taking some quite aggressive manoeuvres to get across to the other sides of streets. We had no incidents or even any beeps from drivers, but one person in one of the other teams got bumped by a van. You do feel pretty secure on a Santander Cycle even without a helmet, as they are 25kg, feel incredibly sturdy, and you can never go that fast on them. But for this kind of challenge, hazards were definitely higher than normal and so the extra security of a helmet was welcome.
The Pashley-made bikes (bike numbers starting with 5) make up around 20-30% of the fleet and are definitely better than the older bikes still available, as they are newer. They are slightly lighter, have better lights, a more solid seat adjustment mechanism, and generally just feel nicer. We generally opted for those bikes, and typically stayed on the same bike for hours at a time.
I’ll have one more blog post about the challenge soon, some technical notes about how I put together the routes and some of the issues I faced doing so.