
I’ve extended my map of tube journeys and busy stations (previous article here) to add in an interesting metric from the 2011 census – that of the second most commonly spoken language (after English) that people who live nearby speak. To do this I’ve analysed all “output areas” which wholly or partly lie within 200m radius of the tube station centroid, and looked at the census aggregate data for the metric – which was a new one, added for the most recent census.
See the new map here.
Also available as an A2 print.
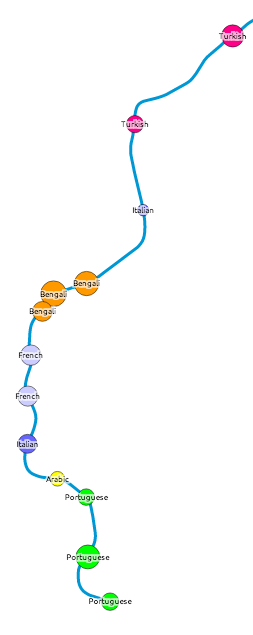 Each tube station has a circle coloured by, after English, the language most spoken by locals. The area of the circle is proportional to the percentage that speak this language – so a circle where 10% of local people primarily speak French will be larger (and a different colour) than a circle where 5% of people primarily speak Spanish.
Language correlates well with some ethnicities (e.g. South Asian) but not others (e.g. African), in London. So some familiar patterns appear – e.g. a popular, and uniform, second language appearing at almost all Tower Hamlets stations. Remember, the map is showing language, not origin – so many of the “Portuguese” speakers, for instance, may be of Brazilian origin.
Click on each station name to see the other languages spoken locally – where at least 1% of local speakers registered them in the census. There is a minimum of 10 people to minimise small number “noise” for tube stations in commercial/industrial areas. In some very mono-linguistic areas of London (typically in Zone 6 and beyond the GLA limits) this means there are no significant second languages, so I’ve included just the second one and no more, even where it is below 1% and/or 10 people.
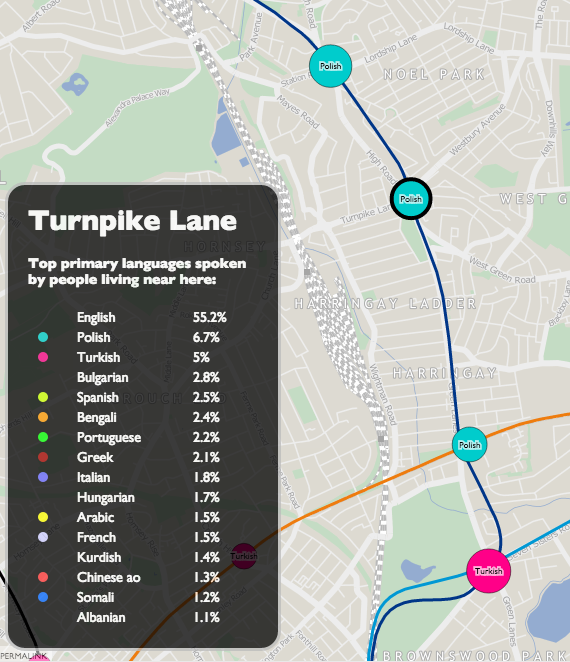
This measure reveals the most linguistically diverse tube station to be Turnpike Lane on the Piccadilly Line in north-east London, which has 16 languages spoken by more than 1% of the population there, closely followed by Pudding Mill Lane with 15 (though this area has a low population so the confidence is lower). By contrast, almost 98% of people living near Theydon Bois, on the Central Line, speak English as their primary language. English is the most commonly spoken language at every tube station, although at five stations – Southall, Alperton, Wembley Central, Upton Park and East Ham – the proportion is below 50%.
A revealing map, and I will be looking at some other census aggregate tables to see if others lend themselves well to being visualised in this way.
I’ve also included DLR, Overground, Tramlink, Cable Car and the forthcoming Crossrail stations on the map. Crossrail may not be coming until 2018 but it’s very much making its mark on London, with various large station excavations around the capital.
The idea/methodology is similar to that used by Dr Cheshire for Lives on the Line. The metric was first highlighted by an interesting map, Second Languages, created by Neal Hudson. The map Twitter Tongues also gave me the idea of colour coding dots by language.
One quirk is that speakers of Chinese languages regularly appear on the map at many stations, but show as “Chinese ao” (all other) rather than Cantonese, whereas actually in practice, the Chinese community do mainly speak Cantonese (Yue) in London. This is likely a quirk of the way the question was asked and/or the aggregate data compiled. Chinese ao appears as a small percentage right across London, perhaps due to the traditional desire for Chinese restaurant owners to disperse well to serve the whole capital? [Update – See the comments below for an alternative viewpoint.]
The TfL lines (underground, DLR etc), station locations and names all come from OpenStreetMap data. I’ve put the collated, tidyed and simplified data, that appears on the map, as GeoJSON files on GitHub – see tfl_lines.json and tfl_stations.json. The files are CC-By-NC, licensing information is here.
25 replies on “Tube Tongues”
[…] at all.) More recent examples are really interesting, including Oliver O’Brien’s Tube Tongues (2014), an interactive map that shows the prevalence of non-English speaking in different London […]
[…] at all.) More recent examples are really interesting, including Oliver O’Brien’s Tube Tongues (2014), an interactive map that shows the prevalence of non-English speaking in different London […]
[…] 22% say they speak another main language. This linguistic richness is visually brought to life via Tube Tongues, a map of the most common second languages by tube stop, created by urban data visualiser Oliver […]
[…] The map hints at London’s large South Asian population, whose native languages include Bengali, Tamil, Urdu, Gujarati and Panjabi. Turkish, Lithuanian, Arabic and French-speaking neighborhoods are also in evidence. To see the map in more detail, click here. […]
[…] View the map or read the full article on O’Brien’s blog here. […]
[…] [oobrien]You can browse the map and zoom in on localities and discover what languages are spoken the most and where. For example, if you fancy brushing up on your Gujarati skills – which is represented by the salmon coloured circles, perhaps a trip to Wembley Central should be on the cards. […]
[…] The map hints at London’s large South Asian population, whose native languages include Bengali, Tamil, Urdu, Gujarati and Panjabi. Turkish, Lithuanian, Arabic and French-speaking neighborhoods are also in evidence. To see the map in more detail, click here. […]
[…] http://oobrien.com/2014/10/tube-tongues/ […]
I saw the version of this map being circulated through Chatham House’s Twitter and it seems to me Tagalog was represented twice in the legend, and in two different colours. Any reason for this?
Hi, zTransmission good spot. Chatham House have over-credited me with their version of the map, they recreated it their in-house style, from my dataset, and I didn’t see their version before they published it. In this particular case, it appears that the second Tagalog entry in the key corresponds to the blob at Hornchurch. There is no difference in the original data, so this really should be coloured in the light blue of the other Tagalog stations.
[…] That’s why cartographers and data scientists have started using the subway systems of New York, London and other major cities as an innovative way to map and visualize urban […]
[…] His focus was to map the most common languages, after English, spoken within a 200 metre radius of the tube station, resulting in his alternative London Underground map Tube Tongues. O’Brien explains his methods here. […]
A nice idea, interesting and well presented I think.
I live in Paris (I am English) and am wondering what the same study would give here!
[…] you don’t want to click on every station to find out, Oliver revealed in his blog that Turnpike Lane on the Piccadilly Line is the most linguistically diverse, with 16 different […]
[…] O’Brien notes in his blog, the map data makes it possible to come to some interesting conclusions about the areas around the […]
Fascinating piece of work with very interesting insights for who’s opening a new business (restaurants ie).
[…] die Waterloo Station gesetzt und gezählt wie viele Leute Französisch sprechen? Einfach unter More Info nachlesen. Basiert wohl auf Informationen aus der Volkszählung von […]
[…] The circles overlaid on each tube station are coloured by the language most spoken (after English) by locals, with the area of the circle being proportional to the percentage of people speaking that language. As O’Brien writes on his blog: […]
A brilliant piece of research on the spread and integration of ethnic and cultural communities within London. It’s probably good enough for a Doctorate, if written up properly.
So now for more peer-reviewed papers…
How about a similar map of UK railway stations, showing the spread and integration of cultural communities throughout the whole of the UK?
A tough job, but just imagine the plaudits! In fact, I might do it myself and publish
Hi Oliver,
I work for a website called London 24 (http://www.london24.com/home) and saw your post about languages on the Tube. I was wondering if I could use your graphic for an article?
We would obviously credit it as your work.
Let me know.
Thanks,
Rehema
“One quirk is that speakers of Chinese languages regularly appear on the map at many stations, but show as “Chinese ao” (all other) rather than Cantonese, whereas actually in practice, the Chinese community do mainly speak Cantonese (Yue) in London.”
I think you’re wrong on this. The historic “Chinese community” (and the “British Chinese” that are the topic of the linked article) mainly speak Cantonese, true. But the 2011 census data should have picked up Chinese-speaking students, mainly Mandarin speakers from China as well as speakers of Hokkien, Hakka, Teochew, and other dialects from Malaysia/Singapore. I suspect New Cross=Goldsmiths halls, Cutty Sark=Greenwich University and so on.
Thanks for the clarification, that makes sense.
Your legend shows two entries related to Chinese speakers: Cantonese and Chinese AO and in the notes it is stated that Chinese AO excludes those specified Mandarin or Cantonese. So what happens to the people who are Mandarin speakers? The current map seems to suggest that the Chinatown area is populated by Chinese people who speak a local dialect rather than the more mainstream Mandarin or Cantonese. To make the map clearer and give a truer representation of the demographics, a separate entry of Mandarin speakers is needed. I am quite convinced that the younger generation is more likely to speak either or both of the mainstream Chinese languages rather than a single local dialect. There may well be Chinese people from other south east Asian countries but they tend to speak the languages of their own countries which are not really a Chinese dialect. The only noticeable exception will be Taiwan and some parts of Indonesia where there is a sizeable population who uses Fukienese as their main language. I won’t be surprised to see after adding the Mandarin symbol that the outer areas will then be dominated by Mandarin-speaking Chinese due to the influx of students and new immigrants where the inner part may still see s strong Cantonese representation due to the older generation who still resides in the Soho areas.
Hi Samuel. Thanks for your comment. The Census breaks out Chinese-origin languages into Cantonese, Mandarin and all other. In the case of my analysis, there were no areas which had Mandarin speakers as the second most popularly spoken language, hence they are not included on the key. However, if you click on a station, then the key will show the Mandarin category seperately, e.g. for Charing Cross, there is 6.7% AO, 3.1% Cantonese and 1.8% Mandarin.
See http://datashine.org.uk/#table=QS204EW&col=QS204EW0068&ramp=YlOrRd&layers=BTTT&zoom=12&lon=-0.1271&lat=51.5274 for a map of Mandarin speakers. N.B. Due to the small reported numbers nationally, you need to click Rescale for Current View. You’ll then see some hotspots jumping out, e.g. Canada Water, New Cross and WC1 “Chinatown”.
I agree that it seems odd that there would no areas where Mandarin is the second-most spoken language, but that conversely there are such areas for Cantonese and AO. However I am simply taking the data direct from the Census. It may be that there is an issue with the way the answers to the Census were processed and grouped by the ONS. (Also note the data is from April 2011, there may be significant changes since then.)
[…] The map hints at London’s large South Asian population, whose native languages include Bengali, Tamil, Urdu, Gujarati and Panjabi. Turkish, Lithuanian, Arabic and French-speaking neighborhoods are also in evidence. To see the map in more detail, click here. […]