Seven years ago, I wrote “We don’t have individual building age open data in the UK” – but that is no longer true!
The MLUHC (for England Wales) and the Scottish Government via the Energy Saving Trust have been publishing individual Energy Performance Certificates (EPCs), for both residential and non-residential buildings, for several years now, and the records go back to 2008 and 2013 respectively. As all new properties require EPCs, and they are also required regularly for rented properties and house sales, the proportion of buildings with these certificates has gradually increased, to around 50% of properties (around 40% in Scotland).
One of the attributes available on the domestic certificate bulk data is the approximate aged of the building – in approximately 10-year age bands. However, linking this to a location used to require using the decidedly non-open AddressBase columns in the dataset. However, more recently, the publishing authorities have added Ordnance Survey UPRNs (Unique Property Reference Numbers) to the data – and this can be linked with the UPRN Lookup tables published by the Office of National Statistics (ONS) which contain locations (eastings and northings) of the UPRNs, which typically are the front door of each property.
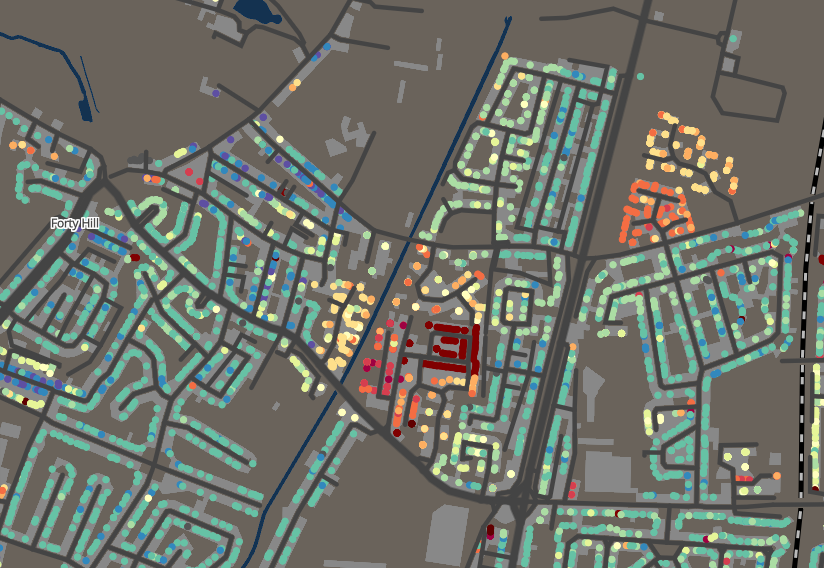
By combining the UPRNs with the lookup, it is now possible to map building ages, for around half of the individual buildings in Great Britain. Moreover, it looks increasingly possible to distinguish residential from non-residential buildings (some have both uses, of course) which will potentially be a very useful attribute when mapping residential data, with the ability to blank out non-residential buildings. Many of CDRC Mapmaker’s maps show data based on the residential population only, so colouring business park buildings with the data never made sense.
The individual building data also allows a more precise look at the different areas of cities, based on their built form. The exact extents of housing estates, or Victoria terraces, are now obvious, from sharp changes in building age, tenancy type and floor area compared with neighbouring blocks, which sit in the same LSOA/Data Zone – the previous smallest unit of building age detail, from the previous best-resolution open-data dataset, from the VOA.
As part of this project, on CDRC Data I plan to, as soon as I am able to*, publish the individual (UPRN-by-UPRN) building attribute data, across Great Britain. I’ve also aggregated by Output Area (2021 for England/Wales, 2011 for Scotland) for domestic properties, and by Workplace Zone 2011 for non-domestic properties. (*Currently some other work on EPC data is being carried out at CDRC and that may take precedence.)
I’ve mapped these on CDRC Mapmaker. Using the PWC (population weighted centroids) for these, and mode/median based aggregates, allows aggregated representation of the data, when looking it at smaller zoom levels on the map. Zooming in reveals the individual building data. PWCs are useful because they retain the urban form – rather than arbitrarily assigning each OA to, for example, a river running through a development.
The inspiration for this project – mapping the age of Britain’s buildings – comes from this old but excellent example from the Netherlands. There is more to be done – assigning estimated ages for buildings nearby confirmed ones, and colouring in each block rather than just assigning a dot to a doorstep – which will follow.
I use buildings and properties interchangeably here – a property is a housing unit where a family/social unit live, and has an address – it might be in a single building or spread across several, and (more likely) a building may contain lots of addresses and properties, such as a block of flats.


