Here’s some Wordles that I’ve created with the runs and events data available on the British Orienteering website, based on 166,000 runs on 5000 courses across 600 events between January 2010 and now.
1. Courses put on by clubs:
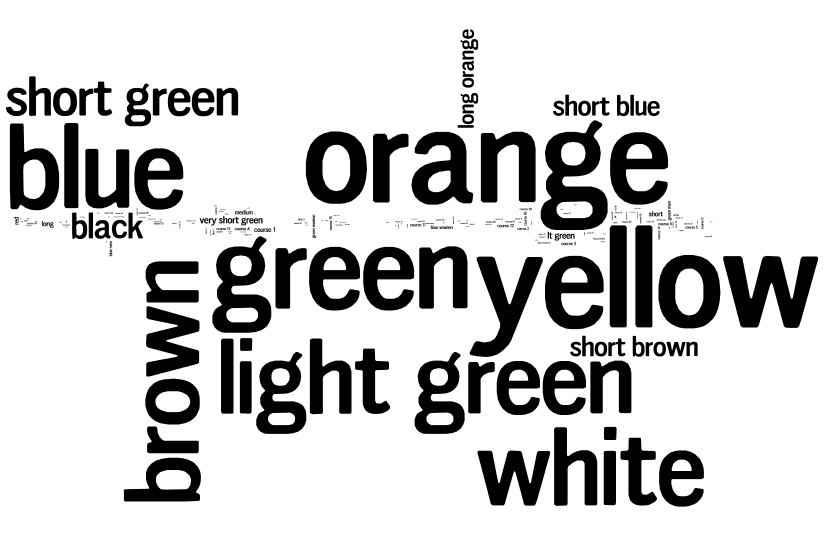
vs Actual runs done, by course:
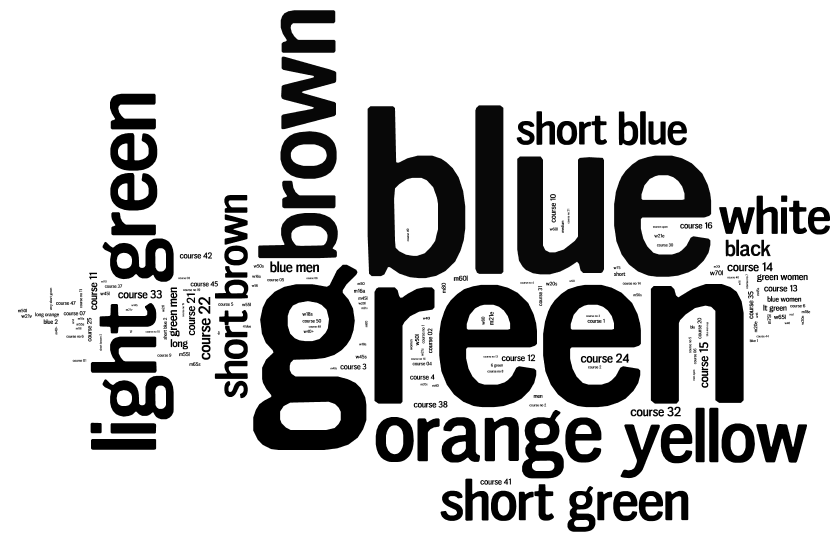
…which shows that we put on a lot of Orange and Yellow courses, but really everyone wants to run Green or Blue.
2. Actual runs done, by club of the runner:
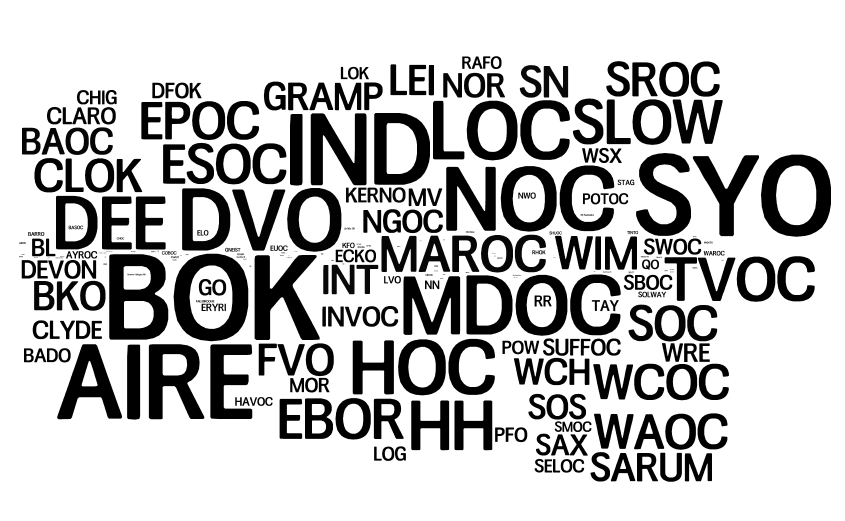
vs Actual runs done, by organising club:
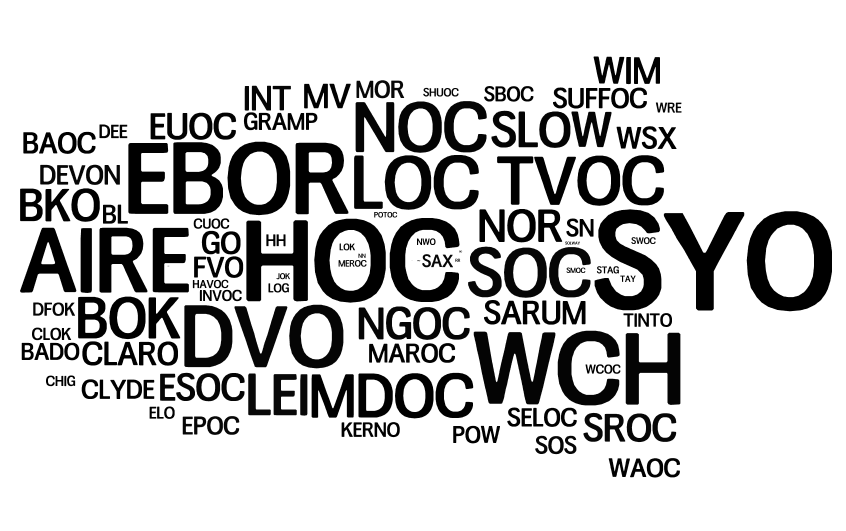
…which shows that some clubs are mainly about organising events (e.g. HOC), some are mainly about running in events (e.g. BOK), but most are about both.
3. Finally – which regions see the most number of runs?
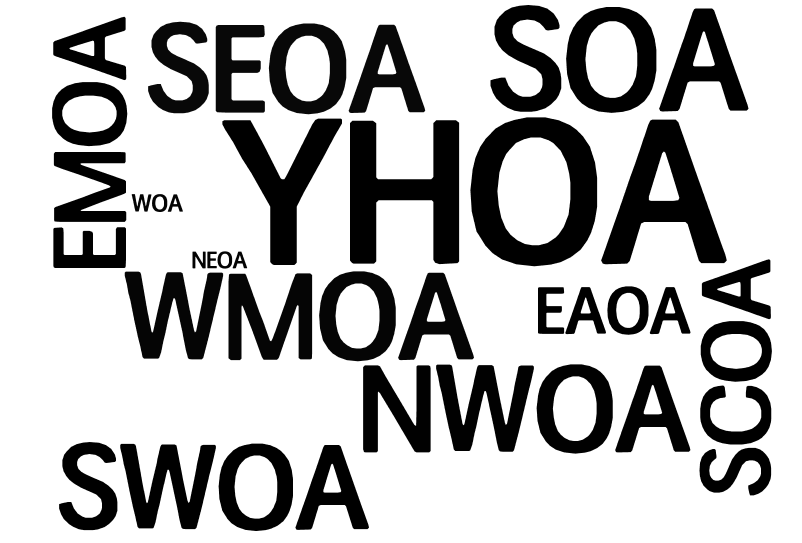
S(OA) = Scotland, W = Wales. The rest are English regions: NE/NW/SE/SW, EA (East Anglia), SC = (South Central), YH (Yorkshire/Humberside), EM/WM (E/W Midlands). While large events that rotate around the regions on a multi-year timetable will distort this, some very large events (e.g. the Scottish 6 Days) don’t appear on British Orienteering’s system as having a region associated with them, so will not appear in the above Wordle.
2 replies on “The State of British Orienteering, in Wordles”
Steve – understood. The Wordles are therefore most useful for showing the relative differences between clubs (or regions) rather than absolute figures. An implicit (and probably flawed) assumption is that the proportion of Level D events put on by clubs, and not uploaded, is approximately equal across the country.
These images are very useful but not fully informative. Using the BOF results database does not show the full picture of events run, only those where results are uploaded to BOF. Until the introduction of the new Incentive Schemes (and likley to continue) most Level D events are not shown on the BOF results database.
Over the same period Level D events which are most likely not included in the above Wordles make up 54% of our event structure and 56% of our participation. So the illustrations only relate to less than half of Orienteering activity.