Lewisham’s “data”
I’ve been looking at a lot of London Borough council websites recently, for the Election Map. I’d rather I hadn’t – just one website would be better – but in London, each borough council publishes its local election results first and foremost to its own website, rather than it being pushed to a more central location such as London Councils which only holds aggregate data. It is also likely that the London Data Store, run by the Greater London Authority, will publish the combined results in due course.
So I’ve been visiting the 32 council websites in order to obtain the full (i.e. number of votes for every candidate in every ward) election data for 2014, for some forthcoming work. It’s striking how differently the data is presented, from site to site. A number of councils use the same software to show the data, but even there there are slight differences – and the other council websites do entirely their own thing.
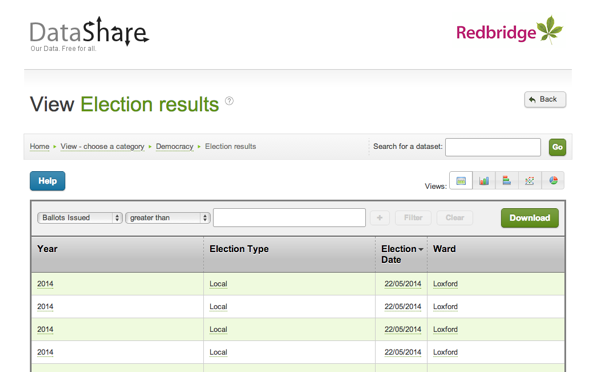
Perhaps of most surprise is that – in 2014, only 1 of the 32 councils provide their election results in a machine readable data (e.g. CSV). Step forward the London Borough of Redbridge and their excellent data website – its interactive and database-driven nature meant that it struggled to show the live results on election night itself (judging by some now-deleted Tweets they sent out) but now that the “surge” of interest has passed, it means it is very easily to obtain the full dataset, even including geographical IDs that are critically important when creating a map – matching by name is fraught with errors due to punctuation and abbreviation variations.
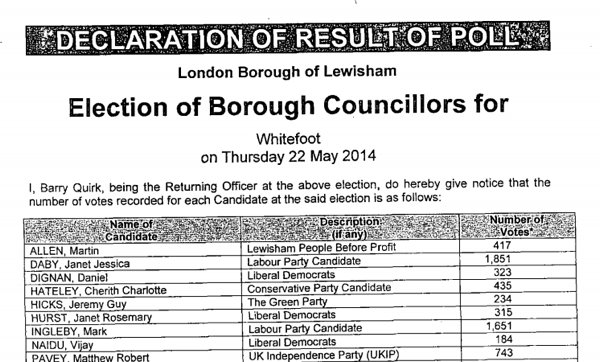
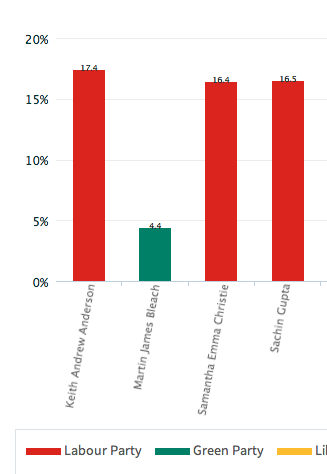
 At the other end of the scale, Lewisham and Bromley councils only provide the data as PDFs. The tables contained with these does not indicate the winners – only the prose below it does. In Lewisham’s case the PDFs were scanned in so the text is not even copyable. Hounslow was a narrow second worst – while they did list all the candidates for all the wards on a single page (yay!) this information does not include the party that the candidates were representing (boo!). You have to go to another page for that and read the party name off a bar chart, as shown on the right here…
In the table below, I’ve awarded each council up to 5 stars on the following basis. This was inspired by Tim Berners-Lee’s Open Data deployment star system which uses a similar (but more nuanced) approach.
- One star if the individual counts for most of the borough’s wards are available on the council’s main website or a dedicated subdomain, four days after the end of the election, in a searchable form (i.e. not as an image). Speedy and official publication is important for maximum transparency of the process. Only Lewisham failed have published their data by Monday evening. Croydon was pretty slow but got there in the end. Tower Hamlets results dribbled in but only one ward missed the deadline, which is not ideal but sufficient here.
- Two stars if the data in available as structured data which is straightforward to manually extract for further processing. Examples where are good: HTML tables and Excel documents. Bromley’s results were supplied in the form of vector PDFs which made their tables difficult to copy. Hounslow’s results were presented in an attractive way, with maps and graphs, but no table containing both the candidate’s votes and their party.
- Three stars if the data is free of errors and typos, such as punctuation problems (stray commas/hyphens, parts of candidate names in the party column, inconsistent ways of referencing which candidates were elected (or missing altogether) or party names, suggesting that it was input into the system in a structured/managed way.
- Four stars if the data is supplied as a downloadable datafile in a standard machine-readable format, e.g. CSV, JSON, XML. Only Redbridge makes the data available in this way.
- Five stars if the data contains ward and borough geographical identifier ONS GSS codes. Only Redbridge has this facility.
| Rating | Borough(s) |
|---|---|
| 0 | Lewisham |
| * | Bromley, Hounslow |
| ** | Ealing, Hammersmith, Islington, Barking & Dagenham, Southwark, Kingston upon Thames^ |
| *** | Barnet, Bexley^, Brent^, Camden, Croydon, Enfield, Greenwich, Hackney, Hammersmith & Fulham, Haringey, Harrow^, Havering^, Hillingdon, Kensington & Chelsea, Lambeth^, Merton^, Newham^, Richmond upon Thames^, Sutton, Tower Hamlets^, Waltham Forest^, Wandsworth, Westminster |
| **** | |
| ***** | Redbridge |
^ = Councils that appear to use a common technology package for displaying their election results.

Redbridge’s excellent data website.
A number of councils, mainly in the 3* category above and marked with a ^, seem to use the same software for displaying their election results on their webpages. The software outputs the results as tables, and includes graphs. If this one piece of software was improved to allow a data download (e.g. as a CSV with ONS GSS codes) of the tabular data, and was then pushed out to the relevant sites, then a lot of councils could move to give stars with a minimum of effort.
4 replies on “London Borough Websites and their Election Data”
Thanks for sharing, very interesting. Regards, Alastair Majury
Excellent work.
We have identical problems outside of London with every district and borough using slightly different formats and almost no one producing data that can be tabulated without manual input.
That common format is the modern.gov Election Results module, an add-on to the committee management software used by many councils. Lewisham actually have this module, but didn’t use it this year. I wrote a set of scripts to extract the election data from modern.gov and other websites and match up the ward names with GSS codes. I used it to produce this map .
Agree with most of your ratings, but think Barking and Dagenham should be reduced to one star as the HTML of their results page is completely lacking in structure.
Thanks, that’s really interesting. Nice map too!