A blog by Oliver O’Brien, a researcher/software developer based at the UCL Department of Geography’s Geospatial Analytics and Computing group. I write about urban mobility (including bikeshare), digital cartography and data visualisation, and shared micromobility (bikeshare and escootershare) developments in the UK.
I also post occasionally about cycling, running, orienteering (including my OpenOrienteering project), hillwalking, London, the London 2012 Olympic Park, occasional mapping, and outdoor events.
Contact
| o.obrien (at) ucl.ac.uk (work) o.obrien (at) outlook.com (personal) | |
| @oobr | |
| ORCID | orcid.org/0000-0002-3413-0853 |
| GitHub | oobrien |
Mini-Bio
I’m Oliver O’Brien, a Senior Research Associate at University College London (UCL), joining the university in 2008 and initially and currently based at the Department of Geography, in the Geospatial Analytics and Computing Research Group (GSAC) and forming part of the ESRC Consumer Data Research Centre (CDRC). Prior to joining UCL I worked as a financial software developer in the City, and then studied an MSc in GIS at City University London in 2007.
I investigate and implement new ways to visualise spatial and socioeconomic data, especially open datasets relating to transport, London and other urban areas. Much of my practical work is developing web mapping using OpenLayers. My current lead project is CDRC Maps which followed on from DataShine.
During 2010-2014 I was at the Centre for Advanced Spatial Analysis (CASA), an interdisciplinary research group at UCL in London, and much of my current and recent output has been based on research there.
In the past I’ve analysed educational geodemographics, UK Census data (see DataShine which followed on from an earlier project called CensusProfiler), bicycle sharing systems (including the Bike Share Map which tracks 100s of bikesharing systems live around the world) and combining transit and demographic data. I also created CityDashboard, a pioneering rapidly updating view of London and other cities.
I’m also a contributor to the OpenStreetMap project which aims to create a free Wikipedia-style map of the whole world. In my leisure time, I compete in orienteering races, and have organised several events including the London City Race, which for a number of years as been the biggest standalone urban orienteering race in the world. I created OpenOrienteeringMap (OOMap), which produces custom “Street-O” orienteering maps for any neighbourhood in the world from OSM data. I also edit Mapping London, which features modern maps of the city.
Some work tools and visualisations are featured on my research blog. See also my leisure blog which occasionally details other projects. I have GitHub repositories for some of my data visualisations and for OOMap. I run a small data-driven art print shop, shop.oobrien.com, and am occasionally commissioned for bespoke digital mapping work.
In 100 words:
Oliver is a senior research associate at the UCL Department of Geography’s Geospatial Analytics and Computing group. His principal project role with in the group is as Centre Technical Manager for the ESRC Consumer Data Research Centre, a multi-university collaboration which obtains, integrates and derives unique insights from retail business datasets. His research specialisms include urban mobility (including bikeshare and escootershare), digital cartography and data visualisation. His web mapping platform of choice is OpenLayers and he has long been a data contributor to the OpenStreetMap project.
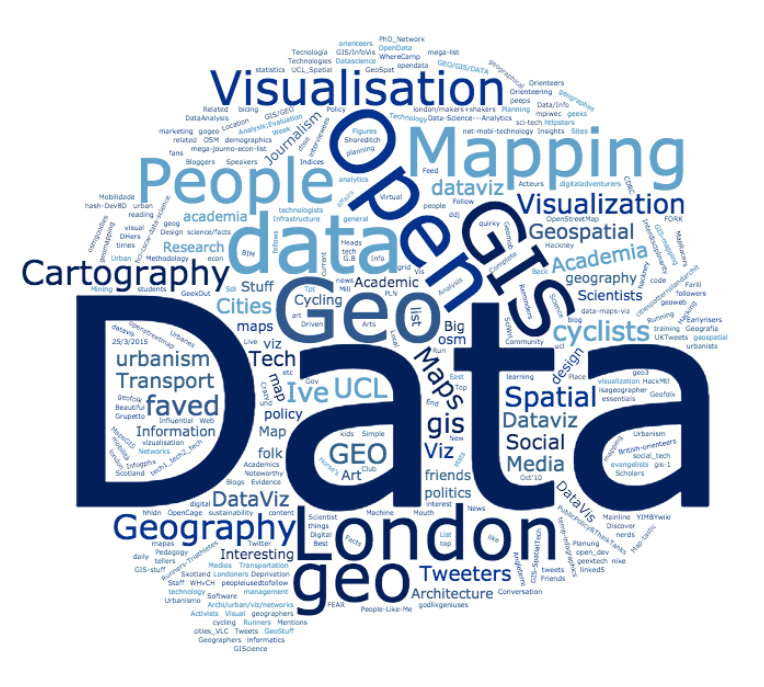
Above: A word cloud of the words in the titles of around around 400 subject lists that I have been assigned to by my followers and others on the Twitter microblogging service.
57 replies on “About”
Hi Oliver,
Is there a problem with the bike share map https://bikesharemap.com/?
The feed appears to be dead – have you stopped supporting it?
Thanks
Mark
[…] of Greater London, despite seemingly having no postal addresses in the capital. And hey presto, Ollie from UCL got in touch to say he’d checked the official Ordnance Survey database and there was […]
I use named to help with genealogy. The problem with the page being inaccessible for weeks at a time seems to have gone away. Yay! From the images saved (irfanview works well enough to crop the map from the screen grab and then save a particular name) I seem to have been saving the results for a little over two years, but must have been using it longer. Only today did I see that it can be used for name pairs, just desserts for not reading the doc, for not RTFM.
Since the censi included the present-day Republic of Ireland until 1921, perhaps you already have the info for Eire, although since the ones before 1901 were lost, perhaps it’s difficult. I’m half Irish ancestry, and definitely would not object to all of that isle being included in named, if it is not too much of a stretch due to missing data. Maybe others would be offended. I confess I’ve never been to Germany. Slowly slowly catchy München. I even “hope you are not offended” to Yorkshire DNA-relatives when I reveal that most of my northern ancestry is red rose. The War of the Roses is history. We don’t need to forget it, but it can’t be the Main Thing.
I do have issues with the underlying map. The land-water borders could be retained. Even if they show through in only the faintest of ways. I find the full names of the cities distracting. They could be shown as the first letter of the city and a dot in a colour that contrasts with the data. L for London. Sure, N is both Newcastle and Norwich, but any fifth-grader (I’m Canadian) will be able to distinguish by the general location. The only challenge I see is T for Torbay. Which is ironic because my Berry ancestors supposedly settled in Devon from France. I stood in Torquay at Berry Square with my wife and we took a selfie (just in case anybody in the family was interested) over 20 years ago, before selfies were the thing they are today. I never discovered whether there’s the slightest relation (ditto for Berrynarbor or Berry Pomeroy), but I doubt it. One has to be at least slightly posh to have a place, even a square, named after one, and, speaking only for myself, I ain’t. So T for Torbay being a challenge is ironic, when the challenged one is moi.
Thanks, Oliver, for providing a useful service, and all without having to watch Russian porn or learn about the latest in washing-up liquid, or having the screen fill with distracting images and invitations to click.
Thank you, but the contours of Britain still do not appear of the maps.
Hello Oliver,
Thank you for your very useful site of names distribution in the UK. I use it to update my study about biblical names in Wales.
It seems that address named.publicprofiler.org has been unaccessible for a few days.
Is this temporary ?
Thank you in advance, Best regards
Philippe – fixed now.
Regards, Ollie
[…] reminded me of Tube Heartbeat created by Oliver O’Brien, a Senior Research Associate at University College London. As it illustrates, city looks like a […]
[…] Hai Nguyen, Oliver O’Brien – naming conventions and […]
[…] Hai Nguyen, Oliver O’Brien – naming conventions and […]
http://familypedia.wikia.com/wiki/Baglin_(surname), is the site for ALL the Baglin folks to view, and CONTRIBUTE TO.
http://www.germannames.com/, is the root site. E-mail: Gninfo@Germannames.com.
Per that site: Original name was BOEGL, or BOGL, with an umlaut. Meaning archer, a/o fighter. The suffix -IN was originated in Alsace, and applied to a WOMAN, and to whom she “belonged TO” / married, or still living with parents. This, per the Late Stanley Nemier, late of Endicott, NY.
Thus, There IS sufficient grounds to urge your research to access the Familypedia site.
Thomas J. Baglin
Ragingmt@rochester.rr.com
03-23-2016
Sent this over to my British correspondent:
“http://named.publicprofiler.org/ ++ http:// http://news.yahoo.com/the-website-that-knows-your-origins-just-from-your-144439816.html?nf=1.
You guys MIGHT find this interesting. Found it during my daily troll of The Internet.
Should be looked at with an eye as to what TIME period the records apply TO.
http://named.publicprofiler.org/ does NOT give any HISTORICAL indication, NOR any clue as to whether the Baglin name originated WHERE in the UK, and migrated TO another section of the UK due to dynastic wars, or a decline in agriculture, or a rise in industrial employment in a particular section of the UK.
My IMPRESSION of this site is one of the name having grown in numbers has established a heavy presence in a second region of the UK; around Louth; and between The Wash, and the Humber River. To me, it is a great marketing tool for genealogy, or any kind of direct-mail scheme.
Now, WHEN this movement took place, or for how long is NOT part of the purpose, here.
http://oobrien.com/, has other socially significant data for interests in the UK. N-t-l, the data MIGHT be useful in OTHER locations, too; at least from an IDEA / INSPIRATION aspect to solving a problem.
Thomas
Ragingmt@rochester.rr.com
03-01-2016
I happen to be an American with the name Baglin; but it is a “settlement” name. My term for arriving at THAT spelling over time; and preference.
In MY CASE, my forebears came from Alsace, with the original Boeglin, using Bagl-EN, and upon my GGM orders to use of the -IN suffix instead.
You can inspect this: http://familypedia.wikia.com/wiki/Baglin_%28surname%29.
The ENGLISH contingent is by far the largest.
Look forward to your response.
I just tried your Named (http://named.publicprofiler.org/) and because I have an apostrophe in my name, LIKE YOURSELF, it gave me an error every time. I could MAYBE understand this if the developer was not that good and familiar with “special” characters in peoples names. But, yourself have one in your surname (O’Brien) unfucking believable!!
Stewart, try using a dumb quotemark. But yeah, I understand the sentiment.
I am working on a specific-area surname distribution project and would like to discuss the options for GIS mapping. Can we discuss offline?
Dear Oliver,
I am an architecture student studying in London and have focused my MA project around London trees as a sustainable resource. Unfortunately I am finding it very difficult to find information on location, type of trees and number of trees around the city of London. I am specifically interested in Camden and Islington.
I have seen your Southwark Tree Map and found it incredibly helpful.
Could you give me some advice on were I can find the information on Londons trees I am looking for?
you mentioned a map of all of Londons trees. I would be very grateful if you could point me in the right direction of who I would need to contact to be able to have a look at the map.
kind regards,
David
[…] (OOM) is a custom version of Open Street Map created by Oliver O’Brien that uses many IOF cartographic specifications (IOFmapping). The purpose of OpenOrienteeringMap is […]
Hello,
This looks like really good use of the Ordnance Survey OS VectorMap District product, well done.
You may be interested to hear that a new release of the product was recently provided. The changes (which include the introduction of key functional sites) are detailed in our blog here: http://www.ordnancesurvey.co.uk/blog/2015/09/latest-version-of-os-vectormap-district-available/#more-20479
Thanks and kind regards,
Terry Haines
Product Manager
Ordnance Survey
Hello!
You did a big job, thank you!
I want to ask you a question. Almaty (Kazakhstan) government want to launch own bike sharing system, and need expert-consultant in this area. Maybe you can help me with contacts?
Dear Oliver,
I am a msc student at Budapest University of Technology and Economics. Now I am just started to work on my paper, which is an optimization for an equalization between the Bubi’s bike stations. I saw your fantastic map here: http://bikes.oobrien.com/budapest/#zoom=13&lon=19.0500&lat=47.5000
and I thought, the maybe you could help me. I need datas from the past about the saturation of the bike stations. I called the hungarian firm – BKK – they handle this big system, but unfortunately they said that can not reach the logs, because of something system error.
So my question is, that can you give me logs from the past about the bike stations saturation of Budapest bike share system ? Or the other question, from where do you get these datas? I hope we can find a solution for my problem.
Best regards:
Géza
Hi Geza – I only store logs for a short period, apart from when doing special studies, for reasons of disk space and also due to operator concerns – showing their data and storing it is two different things. I would ask BKK again, their reason sounds highly unlikely, that they don’t have logs for their own system – how could they plan for the future if they don’t know about their own usage?! My real suspicion is that it might be quite time consuming for them, so maybe it is something to get through a Freedom of Information request?
Hi! I’m a student from Politecnico di Milano University of Architecture. I’m looking for some late 20th century map of London to show relationships between the docklands regeneration process and the town. I spent a lot of time trying but I found nothing: the most recent map is from late 1950s. Can you please help me? Any suggestion about where may I find something? Thanks a lot in advance
I would try IanVisits: http://www.ianvisits.co.uk/about/#E
His blog has mentioned Docklands regeneration a few times, including some historic maps.
Hi Oliver, we met last time at Vienna. I received an e-mail from Russell Meddin from USA who told ma that you had some troubles with Smoove cities data. Could you explain a bit more. Happyt to solve it. Yours.
Hi Laurent. I think the Smoove cities data is working fine. The problem I think was with your most recent system – Moscow I think? There appears to be no data feed for that.
What’s going on with your NYC bikeshare site? Seems to not be working.
Today on the 1 year anniversary, 24-hr passes are only $1, would be interesting to see what effect this had on the stats.
Could you please get this up and running? Thanks
Working for me.
[…] Straßen mit Radwegen und vergleichsweise geringer Verkehrsstärke, konnte der Wissenschaftler Oliver O’Brien vom University College London die Nachfrage jedoch auf folgende Routen […]
Hi Oliver,
I wanted to let you know about the upcoming OpenStreetMap conference and share some information around scholarships that might be of interest to you and your students. Please feel free to share this with them, forward to listservs, or otherwise circulate.
OpenStreetMap is a community mapping project that creates a constantly updated online map of the world, whose road data is freely available for anyone to use it as they wish. This year the annual State of the Map US Conference will be in Washington, DC April 12 & 13, 2014. It will be a great opportunity to learn about how people are using OpenStreetMap, why open map data matters, and what else is happening in the larger mapping space. It will also be a great way to meet people working and active in the geo sector.
We’re offering scholarships to students and other contributors to attend the conference, providing free admission and up to $500 to go toward travel and lodging. Details on how to apply for a scholarship can be found here. The deadline is coming up this Sunday, February 9 and the application is short and sweet.
If you have any questions about the conference or the scholarships, just reach out to me. I hope to see you and some of your friends this April!
Hi,
I’m technical manager for a company operating bike sharing schemes in France.
I’ve found your data about our contracts doesn’t match what our webservice returns.
Would you be ready to explain how you collect this information so I can help displaying accurate data. This is a concern to us as this creates a shade of doubt with our client cities who have recently checked your data.
I’d prefer we have the rest of this conversation via email if you don’t mind.
Best regards,
Benoît
Hi Benoit, please could you let me know which city you are referring to? Feel free to drop me an email, which is listed here: http://www.ucl.ac.uk/bartlett/people/?school=casa&upi=OGTOB45
hey, oliver!
first of all, i’m a big admirer of your work. i work with urban mobility in recife and your blog is a great inspiration in improving the quality of our projects.
secondly, as a fan of your bike share map, i’ve noticed you’re missing two stations in recife’s system Bike PE. i guess this must be because the stations’ numbers are out of the order of the previously installed stations. their names are “Prado” and “Politécnica”, and if you could add them, that would be great!
thanks in advance!
Hi Pedro. Thanks. I’ve investigated – and the reason the two were missing is that there are spaces inserted after the lat/lon, on the Bike PE website for these ones only. I now handle spaces correctly, and those two now appear.
Hi from Adelaide SA… just saw your link on cyclelicio.us to the world bike-sharing map. Perhaps you’d like to add us to your map? See link above.
Cheers! Kevin
Hi Kevin
I’m not sure that Adelaide counts as a 3rd-gen bikeshare system, i.e. it doesn’t use automated self-service kiosks, so I can’t get data from it for my map (http://bikes.oobrien.com/). If you mean the world bike-share map, then I don’t run that, you’ll need to talk to the people that do.
Dear Oliver,
Im a postgraduate student at CASS, and doing some research regarding the Booth maps, particularly in east London.
I cant seem to find your email, so i’m contacting you here.
Would it be possible to talk?
Best Wishes
Robin Turner
07867920083
Hi Robin
Drop me an email. You can find it here: http://www.ucl.ac.uk/bartlett/people/?school=casa&upi=OGTOB45
Mr. O’Brien:
Kudos, nice job with *Geodemographics of Housing in Great Britain.* I lived/taught in Birmingham many years ago and love the ability, now, to see neighborhoods there at a hyperlocal scale with data draped atop. I found I was able trace bicycle rides I took from King’s Heath to the Cotswolds, but now, using imagination, with some of the geodemography that was previously hidden.
Cheers, Kevin
Hi Oliver
Hope you are doing fine.
I have been searching very hard for examples of how to implement a heat map on OSM and then found the API created by Bjoern Hoehrmann and also the example implemented by you at http://oobrien.com/2011/01/heatmaps-are-simple-with-html-5-and-canvas/ .
But due to my lack of experience with JavaScript it has been very difficult for me to understand how to us Bjoern’s API.
Would you be kind enough to share your code on how you have implemented the heatmap, specifically how you are retrieving the data for the heatmap from the database?
Best Regards
ShahriarNK
Hi ShahriarNK
There is no database involved – just the webpage that I’ve linked to on the map’s page.
The rest of it is just Javascript – so just view source.
Hey. In this Post (http://oobrien.com/2010/01/simple-choropleth-maps-in-quantum-gis/) you are using a shapefile of the London wards. I am looking desperately for that. Can you give me a link or something? Thank’s in advance!
I think this might be in Boundary-Line – http://os.openstreetmap.org/data/
Mr. O’Brien–I’m VERY interested in obtaining a copy (digital or otherwise) of the Blitz map as recently featured in an Atlantic Cities article. I read on a related site that one can obtain a “history card” (which I assume is like a reader’s card at the BL?) and view the maps, but that doesn’t help me here on the other side of the pond (though I was just in London in June and had I known of this place, I would have spent some time there!) I’m writing my dissertation on landscapes of London, and a map like the Blitz one would be about the biggest help since the London Times Digital Archive…anyway, if you have any suggestions about obtaining this information, would you please reply here and/or email me? Many sincere thanks—pamela j. francis
Hi – I would recommend contacting the team at the London Metropolitan Archive – details at http://www.cityoflondon.gov.uk/things-to-do/archives-and-city-history/london-metropolitan-archives/visitor-information/Pages/Contact%20the%20enquiry%20team.aspx
Hey there, fantastic site and maps. I really dig the bike share maps and the interfaces you have created. I’m just starting to learn how to use R for mapping and I have what might be a silly question about the baselayers that you are using. Are these maps that you’ve pulled from OpenStreetMap and have cleaned up or are they being pulled on the fly from a particular server? Are there particular R packages that you are using to get these maps? Thanks in advance for any help you can provide.
Sasha
Hi Sasha – I’ve pulled the data from OpenStreetMap but then created my own custom render of the data, using Mapnik. The stylesheet is XML and I’m driving the tile-generation, using Mapnik, with a Python script. Not using R. @spatialanalysis is your spatial R expert!
I’m a geography teacher and loving the geodemorgraphics visualisation. So clear and useful. Just finding the bottom information box doesn’t drop down so am only left with a small area in the middle of the page to view the visualisation. is there anyway of changing this? Thanks.
Hi Oliver,
I compile the Infoporn pages in Wired magazine, UK. Would love to catch up and see what you’re up to at the moment. Cheers,
Dan Smith
Michael – I think they bought 8000 bikes. Many of these are in storage, waiting for the scheme to expand – it’s expanding by around 50% next spring, going eastwards. The spares are also swapped out for broken bikes, a good ~3-4% get reported as “broken” each day (often for trivial things though) as it’s probably more efficient.
Re the Bike-o-meters, different cities have different ways of showing the data and different mechanisms of making it available, so each city’s data is collected in a different way. There are some projects to combine together such datasets, such as citybik.es and WATB.
Oliver,
Regarding these different mechanisms of different cities making data available, I wonder if you could elaborate on that a bit. I’m a graduate student at Columbia in New York doing a masters in Quantitative Methods, and I’m getting a little frustrated in my search for data. I’m not sure if I’m going about it the wrong way, emailing the authors of papers that have piqued my curiosity, but I’d be glad to have your advice.
cheers
Pedro – Some cities have formal APIs with documentation, some have API-like feeds (although undocumented) serving JSON/XML, and some just have a map where the HTML or Javascript needs to be scraped. A couple of the trickier ones require sending POSTs in order to get the data back.
When started bike-0-meter with figures of 40 cities ?
London bought 6000 bikes but only 4800 bikes are installed 14 months after starting the system…
I discovered bike-0-meter recently.
Congralutations for this application…
When the data of the 40 cities were available via internet ?
Does the different citiies has to pay to transmit the uptodate information ?
In London, you have now 4 800 bikes but
the system was for 6 000 bikes….
1 200 bikes are misisng ????
michel benoit mbenoit56@hotmail.com
[…] was really impressed by the London Bike Share Map by Ollie O’Brien. This map gives real-time (as near as damn it) data about the state of Boris Bike stations around […]
Dear Oliver, we met briefly at the Sense and the City exhibition. What an inspiration. I’m keen to see whether some of your work might tie in with our development projects. Broadly speaking we’re doing similar things. Perhaps we could chat/ meet for coffee? All the best, Ben
[…] a more local scale, Oliver O’Brien, has created live bike share maps that depict real time bike share usage in a number of cities […]
The British Library would like to invite you to participate in our web archiving programme. We select and archive sites to represent aspects of UK documentary heritage and as a result, they will remain available to researchers in the future. The British Library works closely with leading UK institutions to collect and permanently preserve the UK web, and our archive can be seen at http://www.webarchive.org.uk/.
Please can you supply us with an email address, so that we can have the relevant information sent out to you.
Regards,
Permissions Officer (pp. Alison Hill, Curator)
Web Archiving, Room 150, Floor 2
The British Library
96 Euston Road
London
NW1 2DB
Tel: 0843 2081144 (ext. 7211)
Fax: 020 7412 7691
E-mail: web-archivist@bl.uk
UK Web Archive: [http://www.webarchive.org.uk/]
Hey –
Please forgive the intrusion – Love the cycle hire stats on your stunning website – just thought i would fire over an idea…
I particularly like the graphs showing the utilisation history of the bikes with the daily peaks and troughs – but it doesn’t capture the huge movement of bikes across the network.
My idea would be to group the bike stations into “inner” and “outer” london – e.g. zone 1 and outside zone 1, and then show the “available bikes” graph for each one (or stack the two onto one chart). I’m sure selecting the initial grouping might take a bit of work but it would be a great chart if you could show it – rather than just undulating between 3000 and 4000 the whole time you would see “inner” completely clear out from 6pm and flood into the outer stations….
Hoping I’ve peaked your curiosity/interest!
Kind regards,
Will