A new version of the crime maps for England and Wales was launched last night, at police.uk. These are now more granular, offering street-level detail, rather than the sub-ward choropleths that were available before. More significantly, the data behind the maps is now readily downloadable from the website, so if you don’t like the maps, you can create your own. No more will we have maps showing virtually the whole of London has having “average” crime levels, due to the outliers – the pickpockets in the West End – being so much higher than anything else.
My tweet-stream is full of people grumbling about the new system – but I rather like it:
Technical Concerns
- It’s broken
Any website launched with a fanfare will break on the first day as the media announce it. There’s not point spending huge amounts on the infrastructure for one day of use, when the rest of the time, the number of visits will be far smaller
Data Concerns
- It’s using point data for streets
Yes, it’s not ideal, but it means you don’t have a problem with (a) drawing lots of polygons which would slow things down, or (b) drawing lots of lines and having them not quite line up with the background. It is a bit of a (mis-)use of the Google Maps aggregating icon, having it show at every level, but this means there’s no “pin-point” at anyone’s door. - It’s showing anti-social behaviour reports as well as crimes. Conspiracy!
They are separated out – you can turn these on and off. They do certainly make some areas look a lot higher for crime than they actually are. - The data shouldn’t just be given away like this – people will misinterpet it and jump to the wrong inclusions
Yes, absolutely, and this is a big problem at the moment. My own maps (above and below) certainly have their problems. But isn’t it better to have the data open so people start to become more aware of the statistics around them? My hope is that, with all these public datasets becoming available, people will start to get a greater awareness that maps can lie, and be more investigative about the truth. - The data shouldn’t just be given away like this – it’s an invasion of privacy
Maybe, but the data is only at street-level, rather than house-level. In the U.S., the data is at house-level. The point-based nature of the data does make it appear that particular houses are crime-hotspots rather than the whole street, but that is a technical limitation of the way the data is made available at present. - The data will blight my area!
The truth hurts? - My street is showing up as a crime hotspot – it’s not
Not a fault of the map or the website (although perhaps it should carry a warning) – at the end of the day if the data supplied is wrong, then it’s going to show up wrong. Don’t shoot the messenger! The data may also be referring to shopping arcades the like for which this street is the nearest.
More Technical Concerns
- It’s not using OpenStreetMap (an open map dataset)
OSM isn’t complete for England and Wales – particularly in parts of north England. It wouldn’t look good if someone uses the map and finds their street is not there. Like it or not, this wouldn’t happen so often with Google maps. Additionally, very popular sites using OpenStreetMap tiles from the tileserver are frowned upon, the project doesn’t have the server resources of Google. - It’s not using custom mapping based on OpenStreetMap
This is quite hard to do, and, while allowing for theming of the mapping, would present an unfamiliar looking and still incomplete map. Plus hosting the tiles yourself means a lot more bandwidth is needed, so the site is likely to suffer even more under the high load. - It’s not using third-party suppliers of tiles, such as Cloudmade
These address the hosting problem but still suffer from incompleteness. - It’s not using Ordnance Survey OpenData (another open map dataset)
The OpenData image tiles don’t include maps that the general public is familiar with (i.e. Landranger, Explorer). People are more familiar with Google Maps now and understand them more quickly. The vector information could have been used to make some really nice background mapping, but again this requires advanced knowledge and being able to host the tiles and manage the bandwidth that would ensue. Google is happy to give you their own tiles for free and they are highly scalable. Certainly I think this is a missed opportunity for making a completely open site, but I don’t have a major problem with Google Maps here – it’s a sensible tactical decision. - It’s not using OpenLayers (an open mapping API)
Google Maps API works on mobile devices, e.g. the iPhone. OpenLayers (on a website) doesn’t really – no gesture support. - Just give us the data, we don’t need a map
You might not, but the media and public do need something they can look at immediately, rather than waiting for third-party developers to release their own interpretations.
Political Concerns
- I can’t believe they spent £300,000 on this!
Actually pretty good value for a site like this – if that includes the infrastructure, bandwidth, database support, testing, maintenance. It’s not just for building a Google Maps API map. - It’s still broken
Wait until tomorrow. Or download the data here – this link has been generally working through the day.
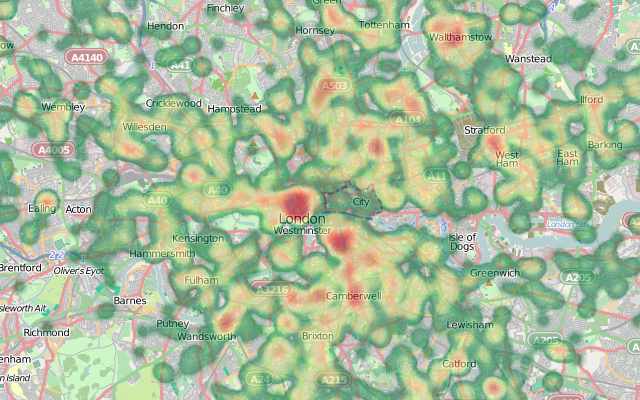
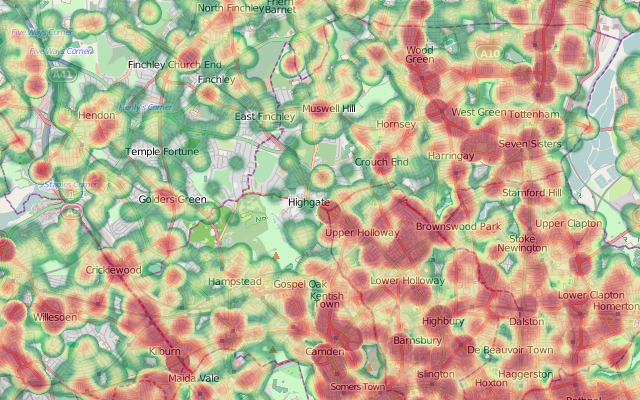
The heatmap above shows robberies in London, below shows anti-social behaviour in north London. I’ve combined the Metropolitan Police and City of London police data-files for December 2010 together. You can play with the heatmap yourself [Updated – the website is now offline] if you have an HTML5-compliant browser. The background mapping is from OpenStreetMap. More about the heatmaps.
7 replies on “Crime Maps – New and Improved”
Thanks! Should have the data up by tomorrow on MyLocalCrime.com
It will be British National Grid – EPSG27700. You also need to convert the datum from OSGB36 to WGS84’s. PHPcoord is good for this: http://www.jstott.me.uk/phpcoord/ – although I’m using the built-in transforms of OpenLayers.
Ollie- do you know what projection they are using for easting and northing? We are having difficulty converting to long/lat.
Thanks – submitted.
Nice use of the data, why not submit it as an app to the police.uk site?
http://www.police.uk/tell-us-about-your-app
[…] This post was mentioned on Twitter by Christian Heilmann, Ollie. Ollie said: @codepo8 OSM just isn't finished for the UK – imagine the ridicule if you found your street wasn't on the map. Also see http://bit.ly/ebhxJk […]
Excellent use of interactive heat maps Ollie. I agree with you about many of the points on website bandwith etc. On the “don’t shoot the messenger” argument though, the website should definitely carry an explanation of how crime stats are compiled. Paul Richard’s posts about perceptions of crime, and recorded vs. unrecorded crime are certainly relevant.