Since launching the data store in early 2010, the Ordnance Survey have been releasing a number of updates to an interesting dataset – VectorMap District – which is a generalisation and simplification of their MasterMap “gold standard” dataset for Great Britain. The updates have been appearing roughly every 6-12 months, and by comparing them in a GIS, you can start to see how places change – at least in the eyes of the Ordnance Survey surveyors tasked to keep the map current. Roads occasionally get built, but building footprints evolve more rapidly – as office blocks and housing developments get taken down and rebuilt with higher capacities or more glass windows.
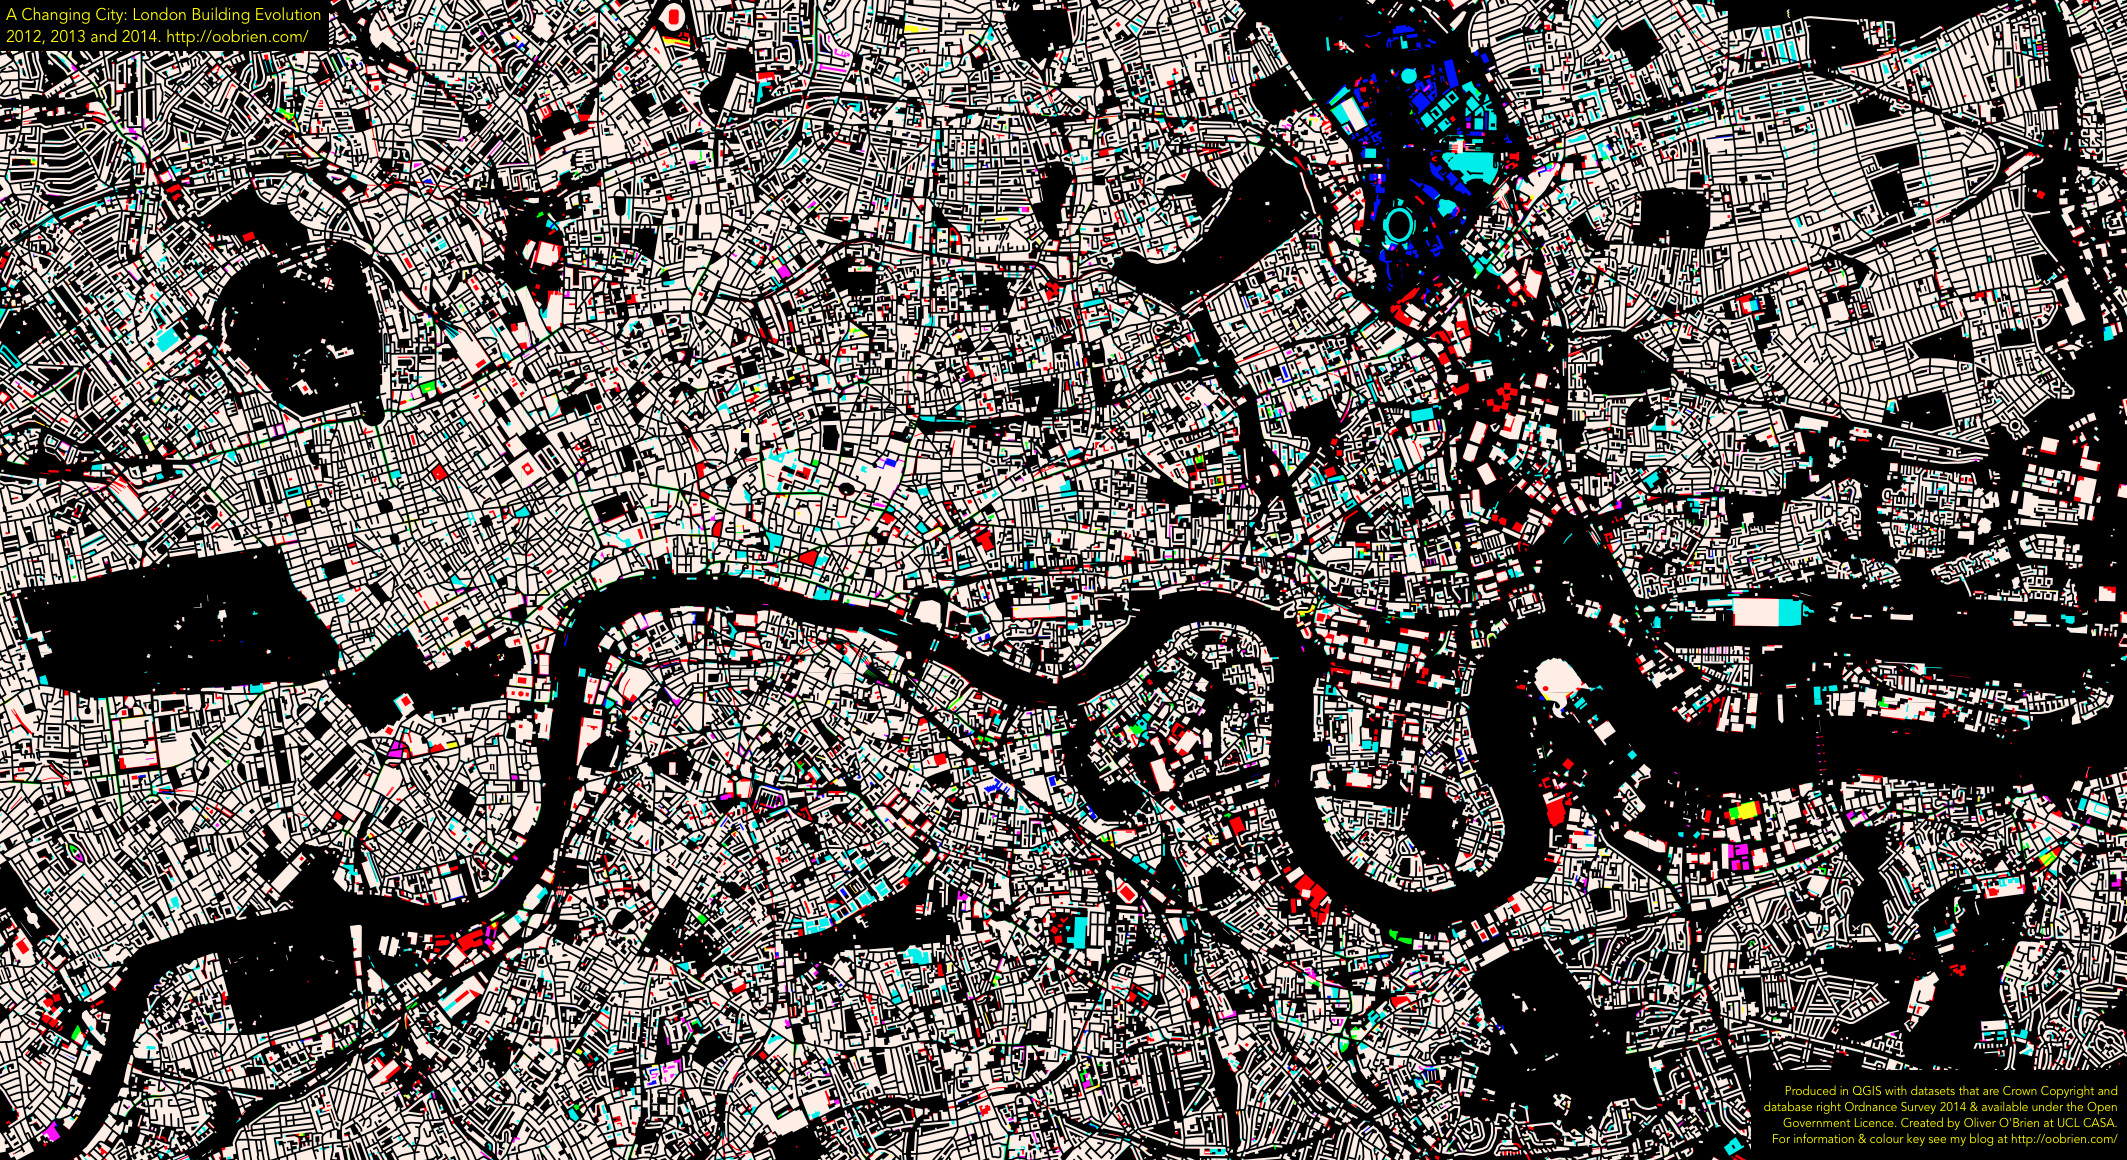
I’ve taken three of the VectorMap District dataset releases – April 2012, September 2013 and March 2014 – combined the data together and used QGIS’s layer compositing operations to show the geographical differences.
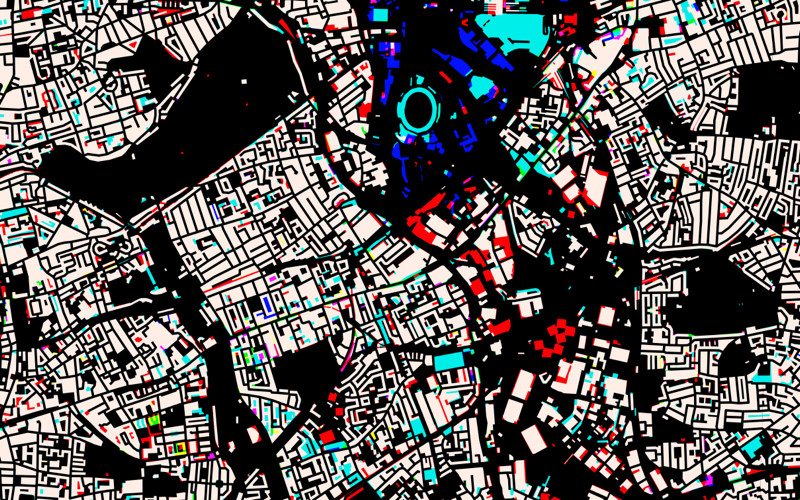
The colours tell of the age of the building – bearing in mind that there is a lag of a few months or years between buildings appearing/disappearing in real life, and on the map. For example, the Olympic Stadium, the turquoise oval above, appears in the 2013 dataset but not the 2012 one, even though of course it was finished in 2011, for the London 2012 Olympic Games.
| White | Building has existed throughout the three years. |
| Red | Building existed in 2012 only (see note below about extra detail). |
| Purple | Building existed in 2012-2013, but has now gone. |
| Blue | Building was new for 2013, but has now gone. |
| Turquoise | Building was new for 2013, still present (see note below about extra detail). |
| Green | Building is new for 2014, still present. |
| Yellow | Building was around in 2012, disappeared in 2013, but has appeared again now. |
| Black | No building existed in any of the three years. |
Above, much of the Olympic Park can be seen – the permanent new buildings (turquoise), temporary buildings for the Games only (blue) and demolished for the games and associated planned development (red). Below, the map covering a wider part of London, zones of activity can be seen. For example, demolition associated with the Nine Elms and Deptford Creek developments (red), and major new blocks such as near the Arsenel stadium (yellow).
Important Note
Between the 2012 and 2013 datasets, the Ordnance Survey changed they way they applied the generalisation on the data, so some of the 2012-2013 changes (shown as red on the maps here for reductions, and turquoise for additions) are as a result of this. For example, narrow gaps between buildings, that always existed, are shown for the first time in 2013 in red (building reductions).
As such, my map slightly overemphasises changes between 2012 and 2013. For example, the pitch at Arsenal and the Great Court at the British Museum appear as changes, but they were always there. As a rough rule of thumb, the smaller red/turquoise patches are due to the generalisation changes, the larger areas of colour show genuine change. With this important caveat, the map remains an interesting insight into London changes, and the larger coloured regions give a good indication of parts of London which are undergoing intensive building redevelopment.
The Bigger Picture
Here is the map for central London – click on it to see a full-size version.
3 replies on “A Changing City – OS Open Data Reveals a Dynamic London”
[…] earlier this month, are collectively branded as OS Open and include OS Open Map Local, which, like Vector Map District, is a vector dataset containing files for various feature types, such as building polygons and […]
I’ve just read your post on the Ordnance Survey blog and thought I’d head over to see this map in context and congratulate you on your work. This piece, in particular, is superb. I appreciate the point that you have made with regard to the changes in the generalisation techniques used but, even accounting for that, I was quite surprised to see how much has actually happened in only three years. Excellent, keep up the good work.
[…] A Changing City – OS Open Data Reveals a Dynamic London | Suprageography […]