Categories
Data Graphics OpenLayers

General Election Maps for 2015

ge_swingmap

When I first moved to UCL CASA back in 2010, the first online map I created from scratch was one showing swings in the general election that year. So it seemed fitting to update the old code with the data from the 2015 general election, which took place last week. You can see the resulting maps here – use the dropdowns to switch between headline swing, winner, second places, turnout % variations, majorities, political colour and individual party votes and X-to-Y swings.

Screen Shot 2015-05-11 at 15.09.08

My style of Javascript coding back in 2010 was – not great. I didn’t use JQuery or event AJAX, choosing instead to dump the results of the database query straight into the Javascript as the page was loaded in, using PHP. I was also using OpenLayers 2, which required some rather elaborate and unintuitive coding to get the colours/shapes working. My custom background map was also rather ugly looking. You can see what the map looked like in this old blog post. I did a partial tidyup in 2013 (rounded corners, yay!) but kept the grey background and slightly overbearing UI.

Now, in 2015, I’ve taken the chance to use the attractive HERE Maps background map, with some opacity and tinting, and tidied up the UI so it takes up much less of the screen. However, I decided to leave the code as OpenLayers 2 and not AJAX-ify the data load, as it does work pretty well “as is”. The constituency boundaries are now overlaid as a simplified GeoJSON (OL 2 doesn’t handle TopoJSON). For my time map, I was using OL 3 and TopoJSON. Ideally I would combine the two…

Link to the interactive maps.

ge_colourmap

Categories
London

Engineering Tour: The Thames Barrier

tbt4

I was recently able to have a behind-the-scenes tour of the huge Thames Barrier structure in east London, thanks to the IET London branch – I’m not a member of the IET (although I used to be) but spotted a tweet from them advertising the tour, so was able to sign up.

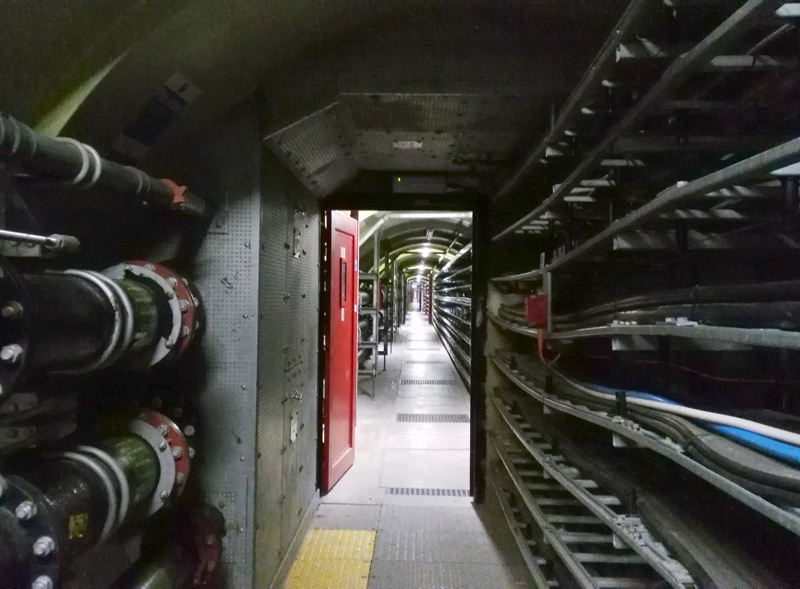
As an “engineering” tour, we were able to get right onto the barrier itself, onto one of the “piers” in the middle of the river. Accessing this is fairly involved. The operational site is under very high security indeed, as befits the importance of the barrier during a flood event and the impact that an uncontrolled flood would have on various critical parts of central London, including the Canary Wharf financial district and the South Bank. Once in, getting to the pier involves crossing a short bridge over the first barrier section that is in fact completely dry at low tide) and then accessing one of two tunnels that run almost completely underneath the Thames, with stairs (for the west tunnel) or lifts (for the east tunnel) linking to the piers themselves. The two tunnels are completely separate from each other, for redundancy/safety reasons, so if one of the tunnels was breached, full access to all the piers would still be possible. The tunnels are fairly small, they have reinforced rings like a tube tunnel, but are quite a bit smaller, and contain numerous ducting cables and pipes. They are dead straight, so looking down one makes for quite an eye-catching vista.

tbt1

tbt3
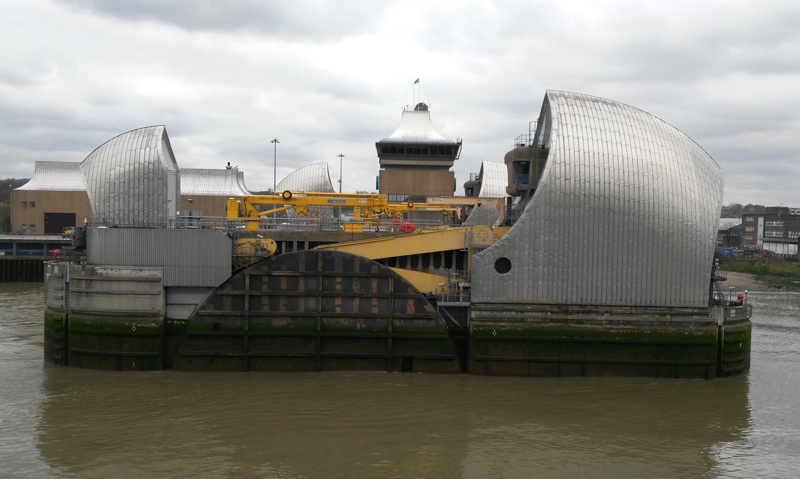
Each pier has two “hull like” buildings which are silvery on the outside, but surprisingly made of wood on the inside. The smaller one houses the top of the aforementioned lift shafts, while the larger one houses the machinery for rotating the huge barrier pieces. Normally, a close or open event takes a couple of hours – in fact, the barrier is quite capable of closing in a couple of minutes, but this is never used, partially because tidal events are fairly predictable with around 24 hours notice (being based on tide, wind direction, upstream flow and air pressure) and partially because a sudden closure/opening would have a negative impact on the ecosystem of the river – likely impacting flora/fauna in the river, and structures on the the banks (I presume this is from sudden changes in water salinity, level or pressure).

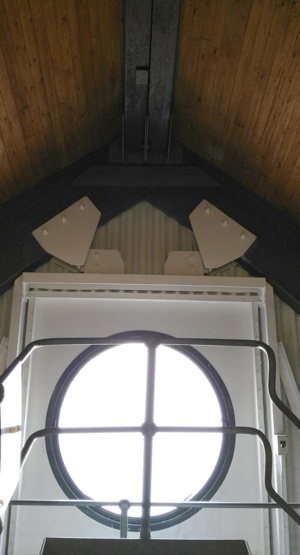
The larger pier building also has an attractive circular window, facing upstream. From the river, it is quite a distinctive feature of the barrier as you approach it. The circular shape again is a play on the barrier piers having a boat theme.

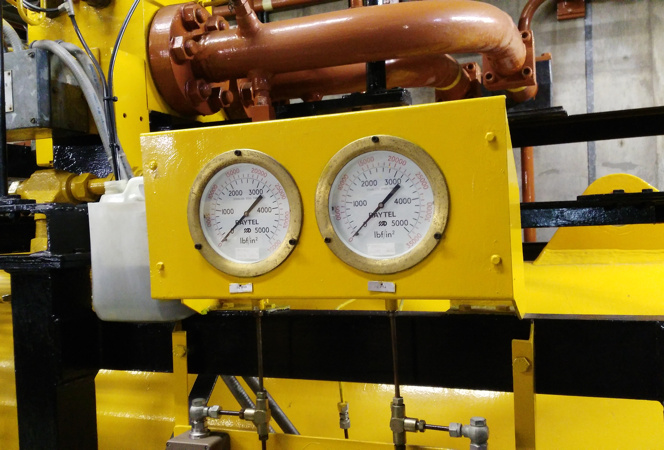
The equipment in the piers is large and impressive. Some of it looks pretty old – the Thames having been built in the 1980s but designed in the 1970s, based on 1960s technology that had to be “proven” for a decade before, so harking back to the 1950s. But it is kept in great working order and does the job well – which is just as well, as the barrier had to close during the Spring 2014 floods nearly 50 times – almost as many times as it had closed in the preceding 30 years.

Anyway, it was a fascinating tour, and thanks to the IET London branch for organising. The tour guides were retired engineers who had worked on the barrier itself for many years, so it was very informative visit.

tbt2

Categories
Data Graphics London OpenStreetMap

Street Trees of Southwark

southwarktrees_rotherhithe


Above is an excerpt of a large, coloured-dot based graphic showing the locations of street trees in Rotherhithe, part of the London Borough of Southwark in London, as released by them to the OpenStreetMap database back in 2010. You can download the full version (12MB PDF). Street trees are trees on public land managed by LB Southwark, and generally include lines of trees on the pavements of residential streets, as well as in council housing estates and public parks. By mapping just the trees, the street network and park locations are revealed, due to their linear pattern or clumping of many types of trees in a small area, respectively. Trees of the same genus have the same colour, on this graphic.

southwarktrees_thin

Why did I choose Southwark for this graphic? Well, it was at the time (and still is) the only London borough that had donated its street tree data in this way. It is also quite a green borough, with a high density of street trees, second only to Islington (which ironically has the smallest proportion of green space of any London borough). There are street tree databases for all the boroughs, but the data generally has some commercial value, and can also be quite sensitive (tree location data can useful for building planning and design, and the exact locations of trees can also be important for neighbourly disputes and other damage claims. It would of course be lovely to have a map of the whole of London – one exists, although it is not freely available. There are street tree maps of other cities, including this very pretty one of New York City by Jill Hubley. There’s also a not-so-nice but still worthy one for Washington DC.

Also well as a PDF version, you can download a zip-file containing a three files: a GeoJSON-format file of the 56000-odd street trees with their species and some other metadata, a QGIS style file for linking the species to the colours, and a QGIS project file if you just want to load it up straight away. You may alternatively prefer to get the data directly from OpenStreetMap itself, using a mechanism like Overpass Turbo.

A version of this map appears in London: The Information Capital, by James Cheshire and Oliver Urberti (who added an attractive colour key using the leaf shapes of each tree genus). You can see most of it below. I previously talked about another contribution I made to the same book, OpenStreetMappers of London, where I also detailed the process and released the data, so think of this post as a continuation of a very small series where I make available the data from my contributions to the book.

The data is Copyright OpenStreetMap contributors, 2015, under the Open Database Licence, and the origin of most of the data is a bulk-import supplied by Southwark Council. This data is dated from 2010. There are also some trees that were added manually before, and have been added manually since, by other OpenStreetMap contributors. These likely include some private trees (i.e. ones which are not “street” trees or otherwise appear on private land.) Many of these, and some of the council-data trees, don’t have information their genus/species, so appear as “Other” on the map – orange in the above extract.

southwarktrees_book