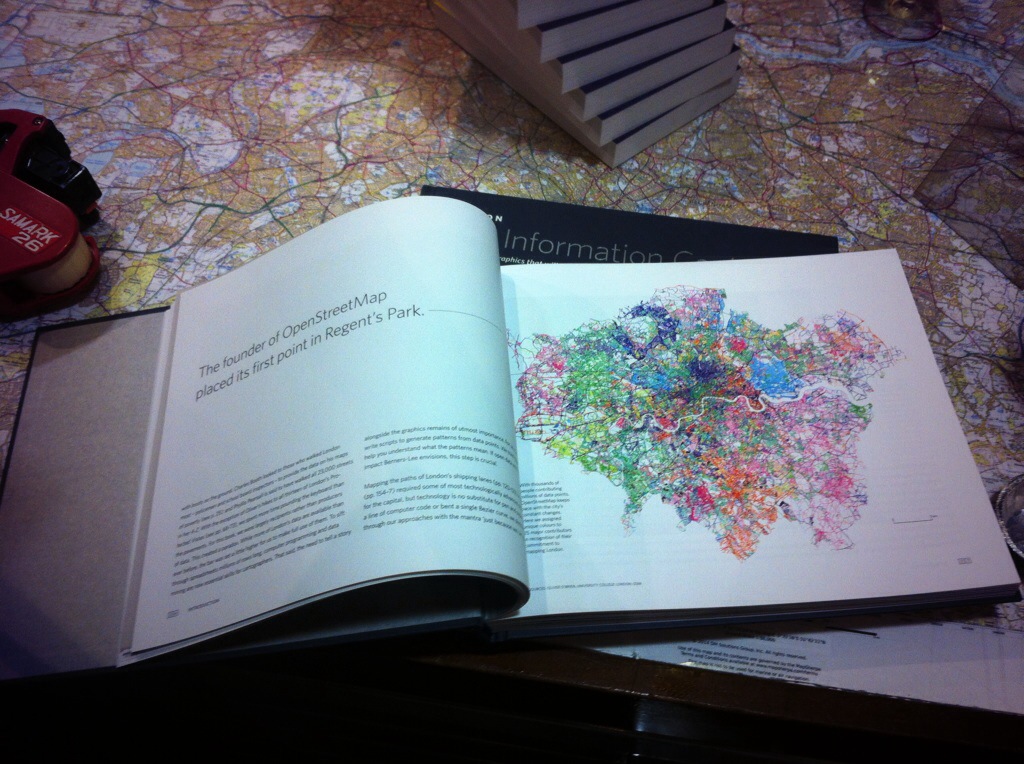
I contributed a number of graphics to LONDON: The Information Capital, a book co-written by Dr James Cheshire, also of UCL Geography. Two of my graphics that made it into the book were based on data from OpenStreetMap, a huge dataset of spatial data throughout the world. One of the graphics, featured in this post, forms one of the chapter intro pages, and colours all the roads, streets and paths in the Greater London Authority area (around 160,000 “ways” which are discrete sections of road/path) according to the person who most recently updated them. Over 1500 indivdual users helped create and refine the map, and all are featured here. I was pleased to discover I was the 21st most prolific, with 1695 ways most recently modified by myself at the time that the graphic was produced.
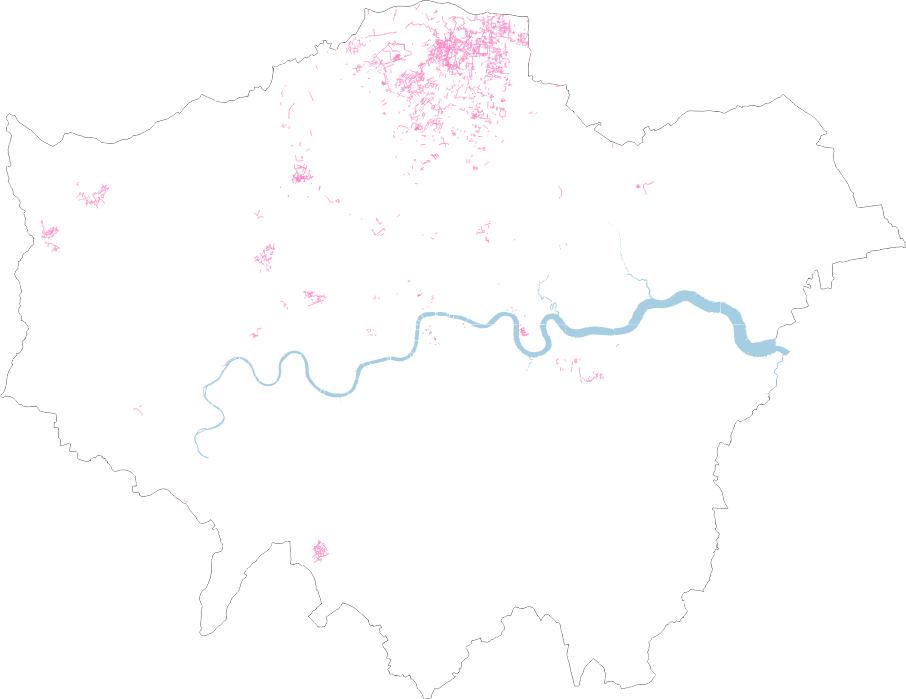
The more active users will typically have areas around home and work which they intensively map, plus other, smaller areas such as contributions made during a mapping party or other social event organised by/for the London OSM community. Here’s an example filtering for just one user:
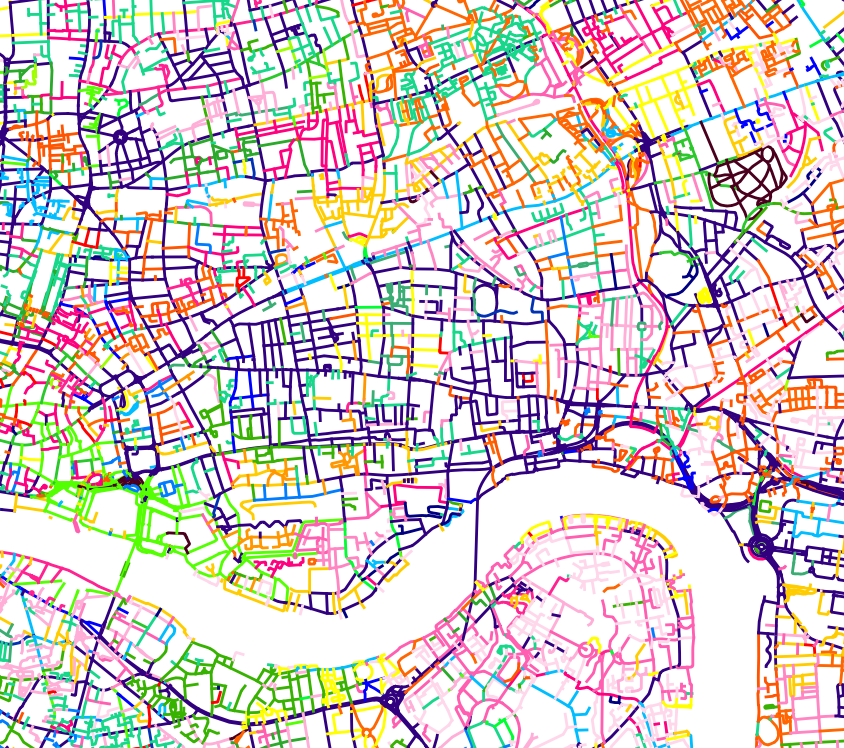
Putting the users together reveals a patchwork of key authors and more minor contributors, together forming a comprehensive map of the city. Detail levels vary, partly as the fabric of the city varies from area to area, but also as some contributors will be careful to map every path and alleyway, while others will concentrate on the driveable road network.
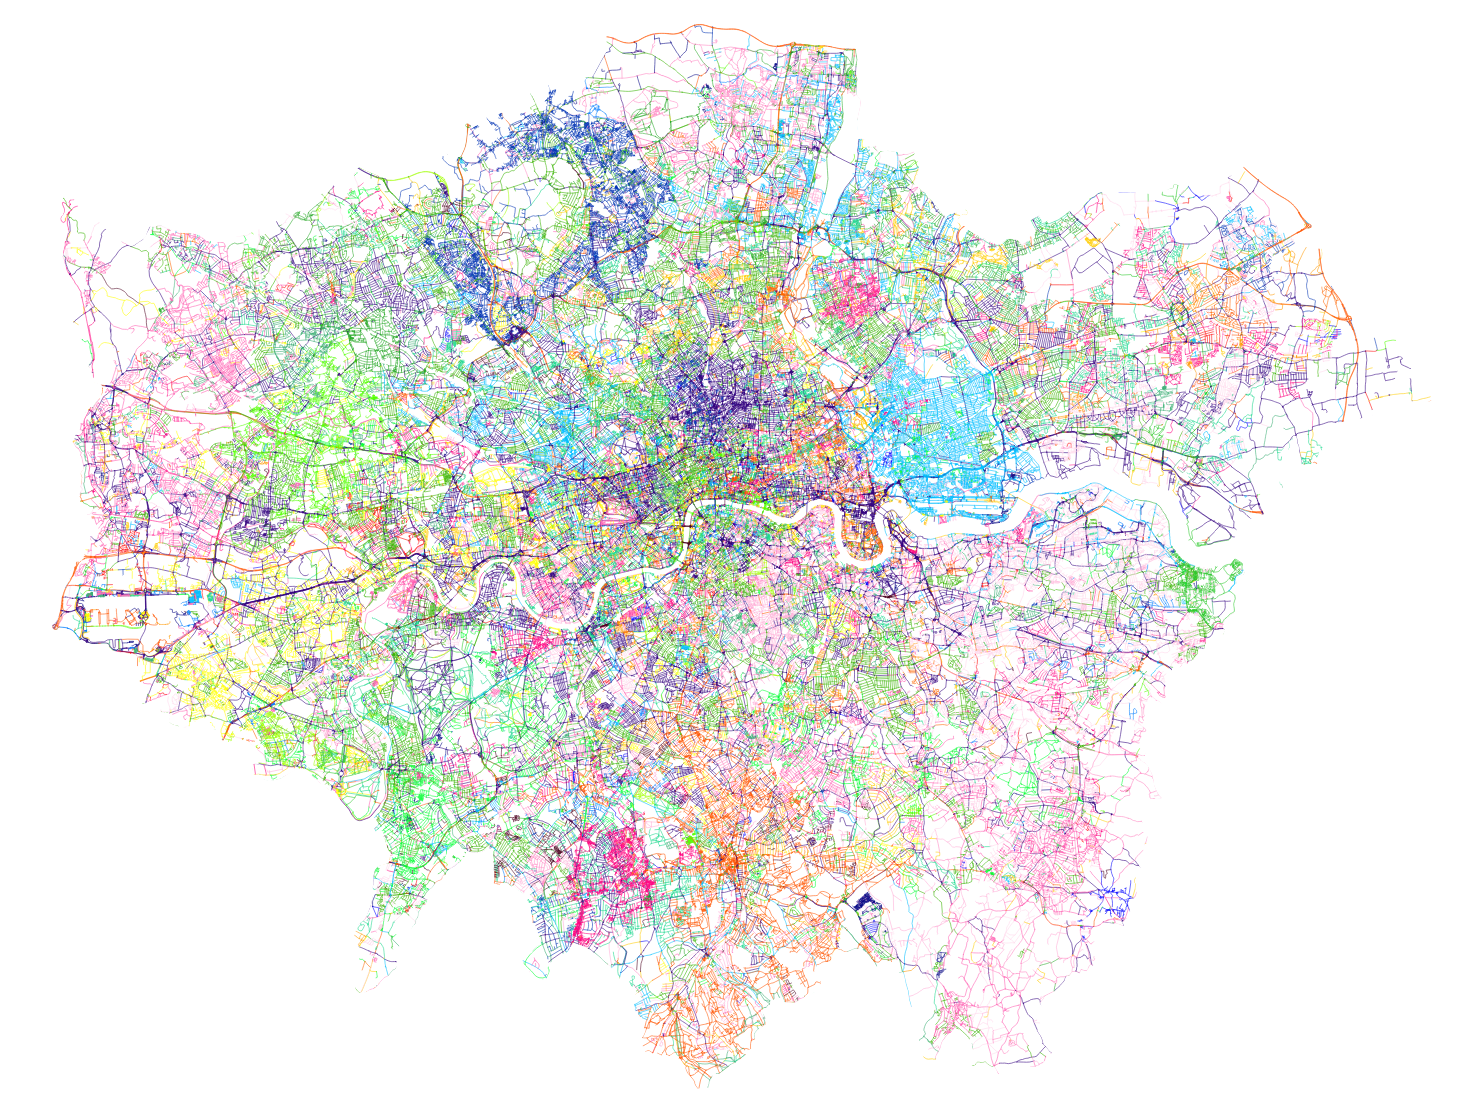
The data was obtained from a local copy of the OpenStreetMap database, for Great Britain, that I maintain for various pieces of work including OpenOrienteeringMap. You can obtain the data files from GeoFabrik (this link is to their new London-only version). The data was captured in early February 2014. Newham borough in east London (light blue) shows up particularly prominently because it looks like it had had a bulk update of all roads there by a single user, just before the capture, to indicate which were lit by streetlights (lit=yes).
I used QGIS to assemble the data and applied the temp-c colour ramp, classifying across all the contributors – I then changed the ones which were assigned a white colour, to green. The colours used in the book are slightly different as some additional editing took place after I handed the graphic over. The colour ramp is relatively coarse, so multiple users will have the same colour assigned to them. The very long tail of OSM contributions (where only a small number of people make the great majority of edits) mean that this still means that most major contributors have a unique colour assigned to them.
Download:
- QGIS 2.6 project file (with line colours), London boundary mask and contributor lines (QPS, Shapefile and GeoJSON files, zipped, 18.5MB)
- Contributor colour key (SLD format, zipped)
- Contributor way counts (TSV format)
- List of ways and versions with contributors (CSV format, zipped)
Note that these files actually are for an area that is slightly larger than the Greater London Authority extent – a buffer from Ordnance Survey Open Data Boundary-Line is used to mask out the non-GLA areas.
If you like this thing, it’s worth noting that Eric Fischer independently produced a similar graphic last year, for the whole world. (Interactive version).
4 replies on “OpenStreetMappers of London”
[…] can see most of it below. I previously talked about another contribution I made to the same book, OpenStreetMappers of London, where I also detailed the process and released the data, so think of this post as a continuation […]
[…] relative lack of completeness of building data in OpenStreetMap, for London, where the project began, is – in fact – likely due to it being where the project began. London has always an […]
[…] can see most of it below. I previously talked about another contribution I made to the same book, OpenStreetMappers of London, where I also detailed the process and released the data, so think of this post as a continuation […]
[…] can see most of it below. I previously talked about another contribution I made to the same book, OpenStreetMappers of London, where I also detailed the process and released the data, so think of this post as a continuation […]