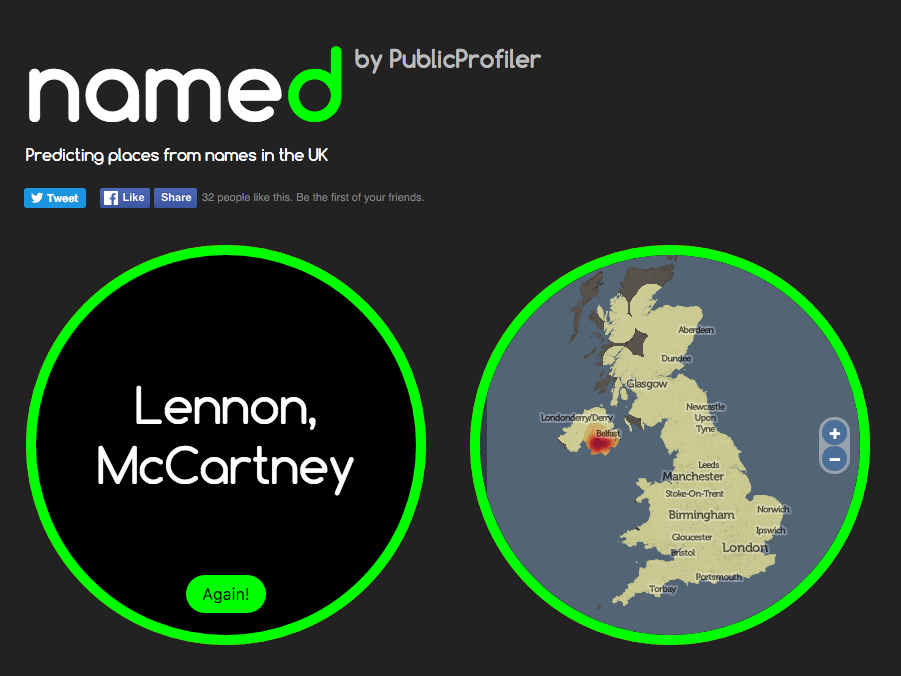
named is a little website that I have recently co-written as part of an ongoing ESRC-funded project on UK surnames that we are conducting here at UCL Department of Geography. I put together the website and adapted for the UK some code on generating heatmaps showing regions of unusual popularity of a surname, that was created by researchers in the School of Computing, Informatics & Decision Systems Engineering at ASU (Arizona State University) in the USA.
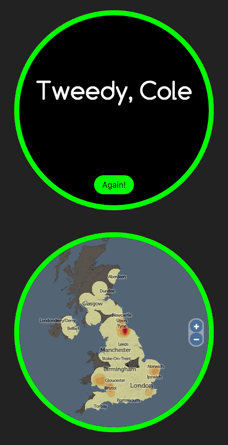
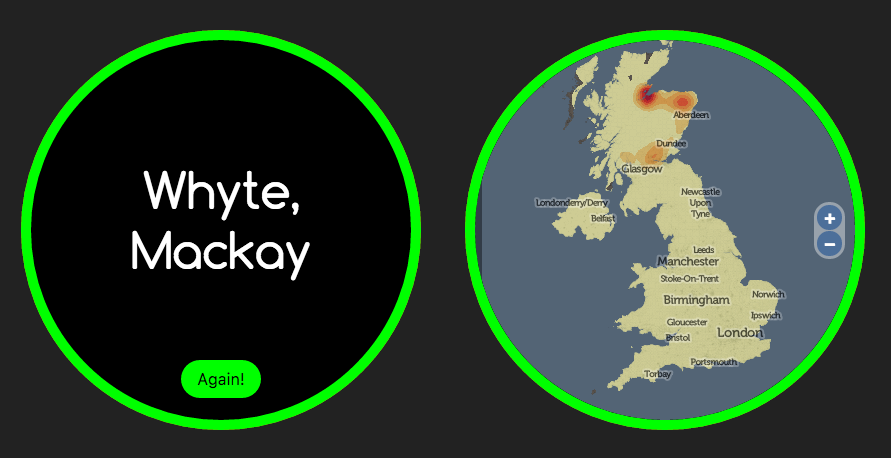
The website is deliberately designed to be simple to use and “stripped down” – all you do is enter your surname and the website maps where in the UK there is an unusually high number of people with that surname living. There is also an option to enter an additional surname (for example, a maiden name for yourself or your partner, or the name of a friend) – and, by combining heatmaps of both names, we try and draw out where we think you might have met each other, or grown up together.
The Research
 Of most interest to us is the quality of the technique with pairs of surnames. It is well known already (for example, J A Cheshire, P A Longley (2012) Identifying Spatial Concentrations of Surnames, International Journal of GIS 26(2) pp309-325) that most traditional UK surname distributions remain surprisingly unchanged over many years – internal migration in the UK is a lot less than might be traditionally perceived. One of the research questions in the underlying project is to see whether this extends to marriages and other pairings too. So we encourage you to use this mode and help us understand and evaluate pairing surname distributions and patterns.
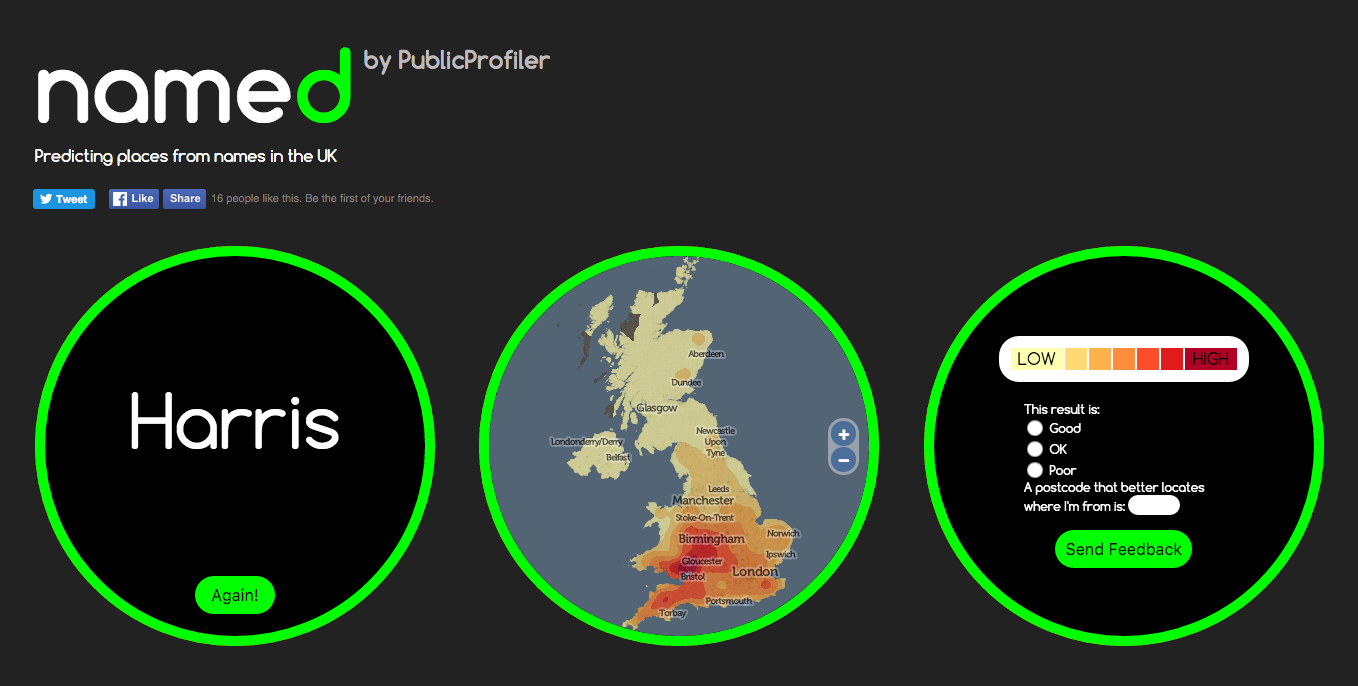
The site is also a useful information gathering tool – we are only in the early stages of evaluating the validity or accuracy of this method – we know it works well for certain regional UK names which are not too popular or too rare, at least. We ask for optional quick feedback following a search, so we can evaluate if the result feels right for you. So far, with the website been operational for around a week, nearly 10% of people are giving feedback, and around half of those suggest that it is good result for them. If it doesn’t highlight where you live now, it might be showing your ancestral home or other region that you have a historical link to. Or it may be showing complete rubbish – but let us know either way!
Try it out for yourself – visit here and see what it says for your surname. The site should be quite quick – it will take up to 10 seconds for names which have not already been searched, but is much faster if getting information that’s previously been searched for.
How it Works
The system is creating a probabilistic kernel density estimate (KDE), based on surname distributions (in a postcode) for an old electoral roll. It finds the relatively frequency/density of the surname compared with the general population in the area. So, in most cases, it will often highlight an area in the countryside – a sparse population, but maybe with a cluster of people with that surname. As such, it will only rarely highlight London and the other major cities of the UK, except for exceptionally urban-centric surnames, typically of foreign-origin. The method is not perfect – the “bandwidth” is fixed which means that neighbouring cities and other population fluctuations can cause false-positive results. However, we have seen enough “good” results that we think the simple has some validity, with the structure of the UK’s names.
Design
On a design perspective, I wanted to build a website that looks different from the normal “full screen slippy maps” that I have designed for a lot of my research projects. Maps are normally rectangular, so I played with some CSS and a nice JQuery visual effects library, to create a circular map instead which appears to be on the back of an information disc.
Data Quality and Privacy
The map is deliberately small and low on detail because having a more detailed map would imply a higher level of precision for the underlying names data than can actually be justified. The underlying dataset has issues but is considered to be sufficient for this purpose, as long as the spatial resolution is low. Additionally, for rare names where a result may appear for only a small number of people with that name (when in rural places) we don’t want to be flagging individual villages or houses. The data’s just not good enough for that, for many names (it may well be good for some) and it may imply we are mapping exact data over someone’s house, possibly raising privacy issues – we are not, the data is not good enough for that but by coincidence it may still happen to line up with a very local feature if it was high res.
It should give an indication into the general area where your name is unusually popular relative to the local population there (N.B. not quite the same as where your name is popular in absolute terms) but I would be wary of the quality of the result if you were identifying a particular small town or exact location.
[A little update as one user worried that it was just showing a population heatmap. This would only happen for names which have a higher relative population in more dense area of the UK. Typically, older common foreign origin names will most likely show this, as foreigners traditionally migrate to cities in the UK first. The only name so far that I’ve seen it for (I haven’t tested it for many) is Zhang which is a very common surname. Compare Zhang (left) with an overall population heatmap (using the same buffer and KDE generation as the rest of the maps):
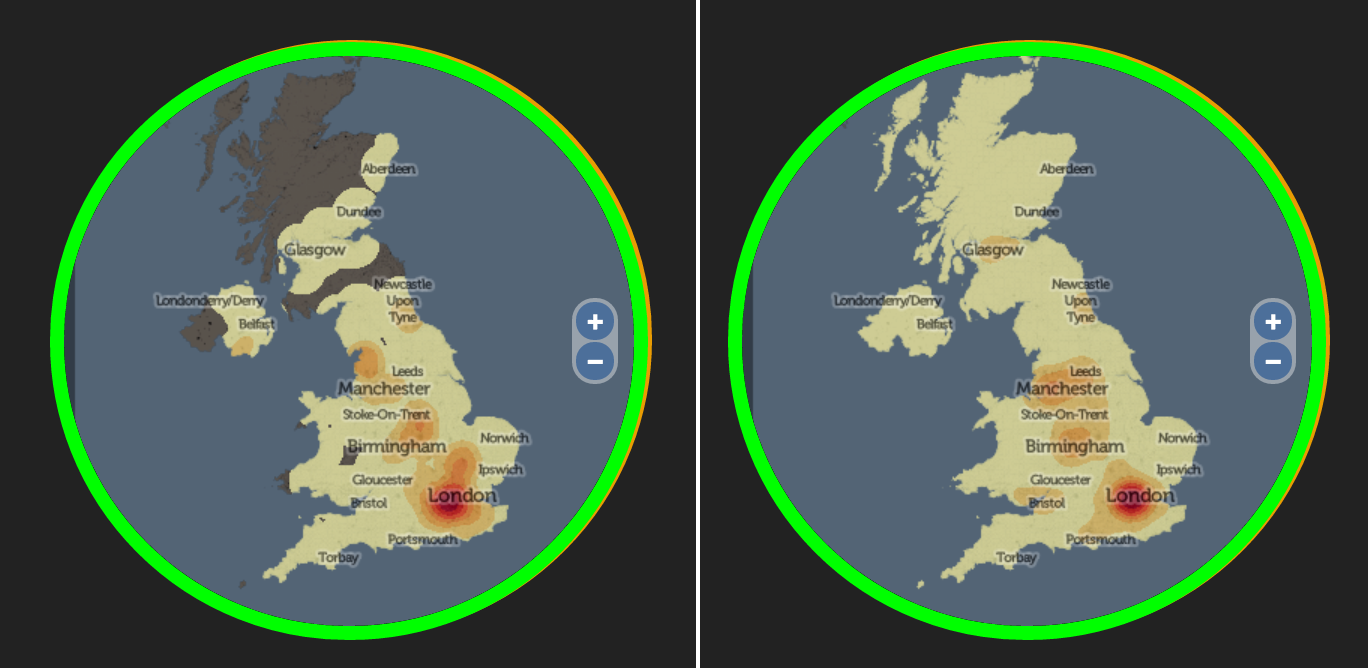
Some newer foreign origin names show an even more pronounced urban tendency, such as Begum and Mohammed.]
More…
Try named now, or if you are interested in surnames across the world, see the older WorldNames website, and for comparisons between 1881 and 1998 distributions in the UK, see GB Names.
If named shows “No Data” and you have entered a real surname, this may be because there are only very few of you on the UK – and in this case, I show the “No Data” graphic to protect your privacy. Otherwise I’d be mapping your house – or at least, your local neighbourhood.