My research lab, the Consumer Data Research Centre, is making available much of the docking station empty/full observation data that I have been collecting, at frequent intervals (up to every 2 minutes) for generally the last 5 to 8 years, for over 50 cities around the world, to facilitate and encourage further quantitative research in the field. I already get numerous requests for this data – it is very interesting for all kinds of research projects, particularly because of it spans multiple years, so introducing this new mechanism is a good way to manage these requests. You can see the cities listed at the CDRC Data product page.
For three cities (Cork, Limerick and Galway in Ireland) we have directly attached the data to the record page. It is the data that has been collected up to the point that the record was published a few days ago, and on request we will reload the data, capturing more recent observations.
For the other cities, the data record is “Safeguarded”. This is because the logistics and technical limitations of attaching the very large amount of data to the records. Namely, it takes quite a lot of time to prepare each dataset for download, and the platform we are using is not designed for hosting extremely large files – plus, it is likely that researchers would want the most up-to-date data, meaning that we would need to build a mechanism to update the record regularly. Using an application process also minimises spurious requests – we have invested time both in collecting the data and processing it, so we need to be confident that it will be used. Additionally, some systems (particularly those in the USA) come with their own data licence restrictions from the operating companies meaning that we cannot freely distribute the “raw” data. In Europe, most of the datasets are explicitly open, meaning use of the data is unrestricted (although normally requiring attribution). the Irish cities listed above have a slightly more restrictive licence, requiring us to distribute it on the same terms, which we have done.
The data is available on application to interested institutional researchers. In practice, this means academic, public sector and non-profit organisations who which to carry out public/publishable research with the data. Application details are attached to each record.
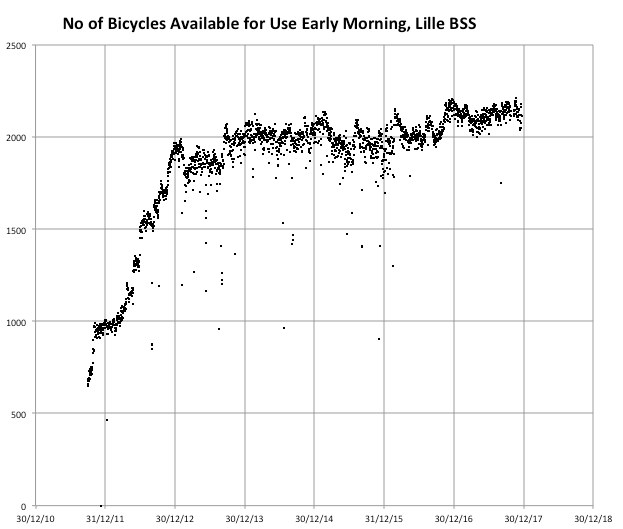
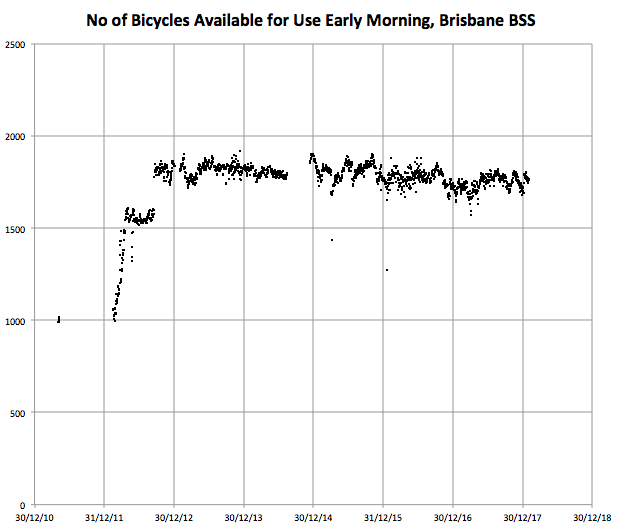
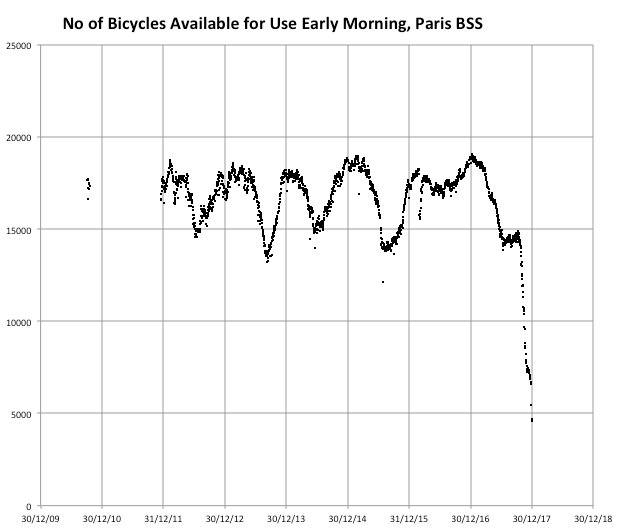
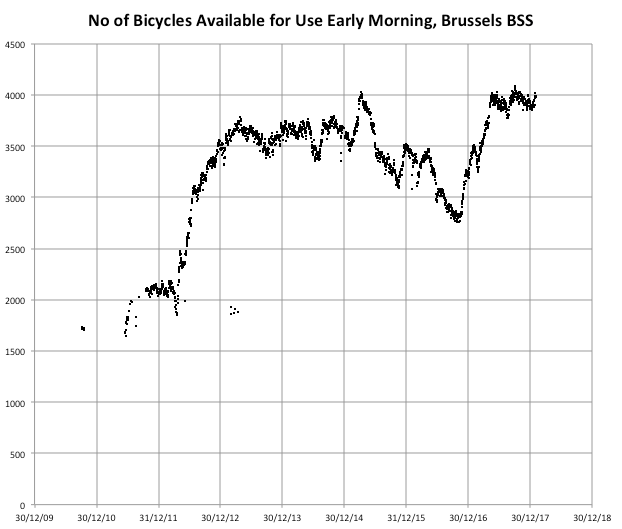
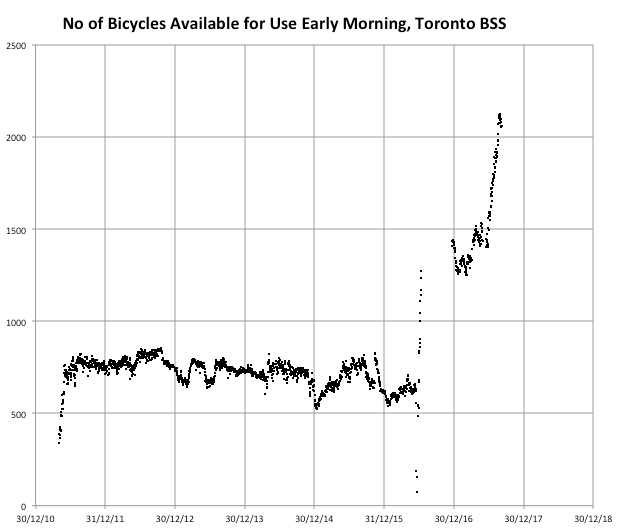
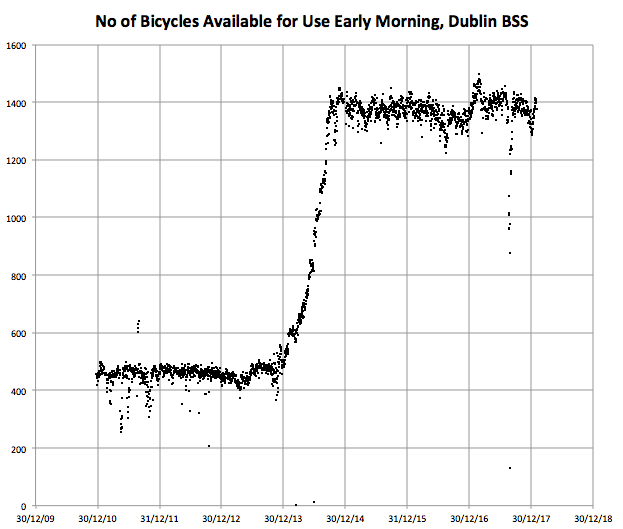
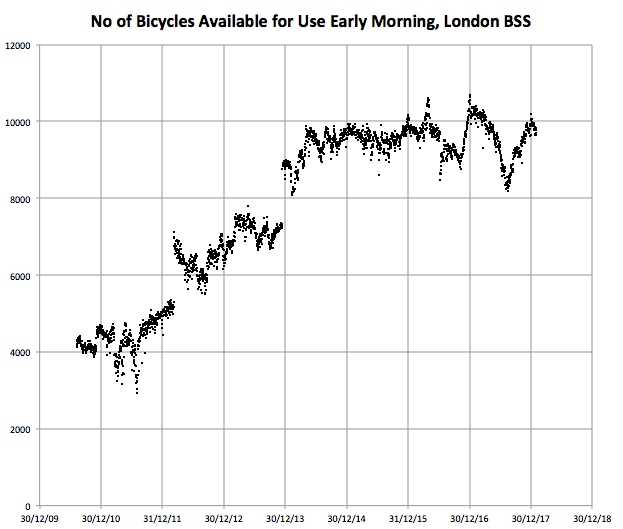
Above and below are simple graphs produced from the data for various cities. I have looked at the number of bikes available every day at around midnight and plotted it on a simple graph against time.
Stay tuned because I am planning on releasing two further “data portals” of bikeshare data, soon. These are slightly more manageable in terms of file size and administration, so I am aiming for these to be directly downloadable.
