Categories
Bike Share Conferences

Paris Workshop on Bike Sharing Systems

IMG_2856

I attended a one-day workshop last week, hosted by IFSTTAR’s GERI Animatic research group at École des Ponts ParisTech just east of Paris. The workshop was on Bicycle Sharing Systems, and as I have recently been working with a couple of colleagues, Dr Martin Zaltz-Austwick and Dr James Cheshire, on research relating to bicycle sharing data, and mapping the systems currently live in various cities around the world, I was keen to attend, particular as the agenda was packed with interesting sounding talks.

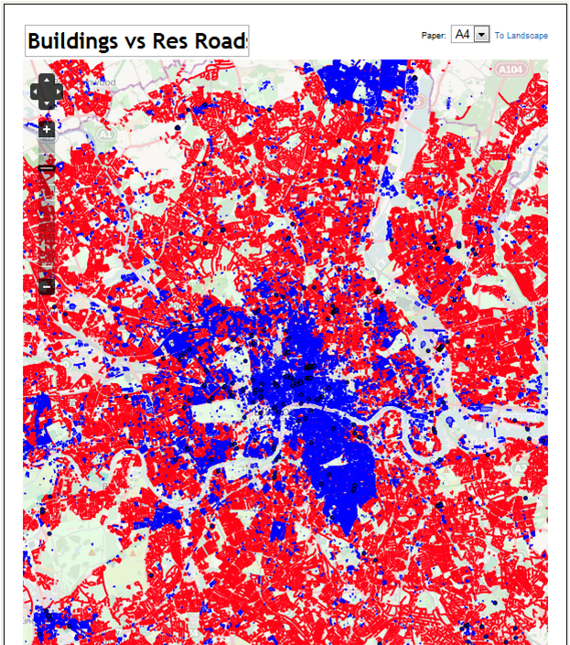
My rush-hour commute through Paris proved to be slightly more traumatic than planned (I wonder if Parisian visitors find London Underground stations as confusing as I find those on the Paris metro?) but I arrived at the École des Ponts ParisTech in time to hear the workshop organiser introducing the sessions. First up was Pierre Borgnat talking about network analysis of Lyon’s system. I had seen a paper by him on Lyon before, and the popularity and density of Lyon’s system has allowed for a rich and interesting dataset for mining and community detection. The community detection has been done using both spatial and temporal variables. Pierre’s thorough and technical treatment of the data was backed up with some excellent mapping of the data, which you can see above and below.

IMG_2859

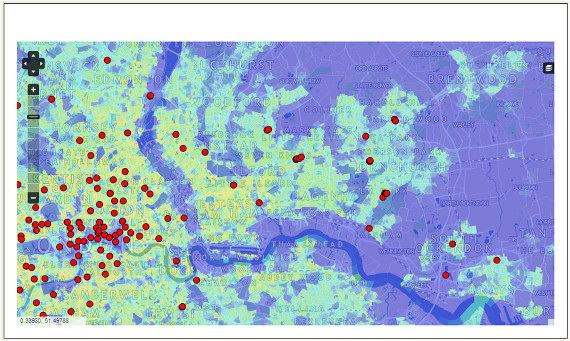
Next up was Jon Froehlich. Jon’s talk was underpinned by a discussion of the different data sources and types available in the field. He focussed on temporal cluster analysis of the Barcelona bicycle sharing system (below) – a particularly interesting city for me as, along with London and Zurich, it is a case study for the EU project I have recently started working on, EUNOIA. Barcelona’s bicycle sharing system is not unlike London’s, in terms of its size, shape and usage characteristics – although the general downward slope of the city causes headaches for its operator. Jon gets bonus points for including not only a quote from this blog on his presentation, but Martin’s beautiful routed bike-flow animation for London, and Dr Jo Wood’s more recent bi-directional flow animation, again of London.

IMG_2887

Etienne Côme, from the hosting school, was next on, with an analysis of the biggest system (outside of China) of all – the Vélib in Paris. The Vélib is perhaps the holy grail of academic research in the field as its size, and Paris’s multiple commercial and residential zones, means that community and network analysis is likely to be eye-opening. Similar to Pierre, Etienne outlined eight detected communities, by looking at temporal variations in the origin-matrix between the 1200-odd stations on the Vélib network.

IMG_2914

After lunch, Vincent Aguilera was first on, with a switch away from bicycle sharing systems but showing some techniques that have potential for the field – Vincent looked at using mobile phone network data to detect station dwell times and true journey durations on a section of the RER metro in Paris. He compared this data with Twitter messages with appropriate hashtags (below), and the real-time running supplied by the operator on its website. The availability and structure of the cell-towers on the network allowed a direct comparison to be made – indeed, such data may actually be of better quality than that currently available at the operator’s disposal, allowing more fine-tuned operation and monitoring.

IMG_2925

Neal Lathia was next with a look at London’s system – specially effects caused by the addition of casual (i.e. non-key, non-member) availability in December 2010. The additional option did see some changes in the usages of certain docking stations. The comparison was done by clustering the network’s docking stations by time, before and after the transition, and then seeing which stations changed cluster. One of the main areas of change was in the very heart of London, around the Trafalgar Square area, suggesting a slight shift away from the (still dominating) railway station-based usage patterns.

IMG_2948

Fabio Pinelli’s talk was wide-ranging – it included system design, routing for Dublin’s (over)used system, a look at the reliability of the Vélib fleet.

IMG_2950

Finally, Francis Papon from the hosting school took a step back from the modern electronically managed bicycle sharing systems and mobile/social data sources, and looked at change in uses of urban cycling more generally. His dataset stretched over a hundred years, rather than the typically five-year maximum historical range that bicycle sharing systems have. A key trend is that in the largest French cities studied, including Paris, there is a recent (post-2000) renaissance in urban cycling usage, but this is not matched in many of the country’s smaller cities.

The workshop concluded with a general discussion of the research field to date and its direction. What was particularly interesting was that several bike sharing operators were in attendance, they were fully engaged with the academic research being carried out, asking questions but also revealing some nuggets of information about how the systems are rebalanced, relative costs of operations and why they thought some systems were more successful than others.

Hopefully there will be more such workshops in the future in Europe – with UCL CASA, Cambridge, City University London and LSHTM all involved in the field, maybe there should be one taking place in London next year?

Categories
Conferences

Behind the Scenes at the British Library Map Room

I was lucky enough to be on a private tour of the British Library Map Room, as part of the Society of Cartographers conference at the beginning of the month.

The tour showed some of the treasures of the Map Room, including the world’s first printed colour map, proofs of the world’s largest atlas, and a fragile nested set of globes; followed by a walk through the huge, industrial map storage facility in the bottom basement underneath the British Library (the Northern Line could be heard rumbling above!) and a quick look in the Map Reading Room. Some of the older maps of (real) places look like they are straight out of a fantasy novel – presumably the latter being heavily influenced by the former. A good example is above.

Thanks to the SoC for organising and the Curator of Antiquities for showing us around.

Categories
Conferences London

Mapping London Presentation for the Society of Cartographers Conference

I presented on the Mapping London blog, at the Society of Cartographers’ 48th Annual Conference which was at UCL this year, showing a general outline of the blogs and some maps featured on it, plus some work done by James and I. My presentation is here (6MB PDF). Note that the attribution for the many maps featured on the presentation is at the end.

Categories
Bike Share Conferences

Velo-City Review

I was in Vancouver at the end of June for the Velo-City conference – which is the cycling industry’s conference on bike sharing and urban cycling.

The lead sponsors were PBSC who are behind the technology for many of the larger North American systems (Montreal, Minneapolis, Washington DC) so there was was a strong bike sharing theme through the conference, and they had a prominent stand with bikes in the various scheme liveries. The stand also had a couple of design updates from the ones you see in London and elsewhere – a “totem-pole” for capturing sunlight to provide power, and a slots that takes credit cards as well as the existing key-fobs. There is no indication that these updates will be making it to London anytime soon though. B-Cycle, who supply and run many of the smaller systems in the US (e.g. Denver, San Antonio) also had a stand with their own Trek-built bikes, which have a distinctly different look.

I presented on my Bike Sharing Map showing the detail for various cities around the world, it was the middle part of a 90 minute presentation at three geographical scales – the first segment given by Russell Meddin on his global map of bike shares, and the last segment being given by Andrea Beatty on detailed information available for a single city through mobile apps.

I also sat in on several other presentations – some of the most interesting being given by far-eastern presenters, particularly the Chinese. This is because China has 7 of the largest 10 bike sharing systems in the whole world, but getting information on them can be difficult, so it was interesting to find out the information from people on the ground.

One of the most interesting talks focused on the modal shift in Chinese and Western cities – many of the former are shifting from bicycle to car, while the rise of the bus in Western cities was cited by the contrast between Thatcher’s 1968 “A man who, beyond the age of 26, finds himself on a bus can count himself a failure” with the 2008 appearance of a red London bus in Beijing during the 2008 Olympics closing ceremony! In China, lanes that were once dedicated for bicycles have been turned over to extra space for cars.

My personal highlight was being able to borrow one of the PBSC bikes and take it for a spin around Stanley Park – a lovely circuit and on a very pleasant afternoon. Apparently Vancouver does not have very many rain free days in the summer, but it was warm and sunny throughout my stay.

Vancouver is itself getting a bike sharing system, probably next summer. Vancouver’s existing cycle insfrastructure is brilliant – properly segregated cycle lane, with planters and cycle parking to separate the lanes from the cars. The operator will have its work cut out for the scheme to be a success though – helmets are required by law in Vancouver. There was some talk of a system where every docking station comes with a helmet vending machine, and on return the helmet gets safety-checked and automatically cleaned ready for the next user.

Thanks to Russell and Paul for letting me crash in the apartment they rented, B-Cycle for covering my conference fee, and CASA for flying me there.

Categories
Bike Share Conferences

Velo-City Preview

[Updated] I’ll be presenting at Velo-City in Vancouver later this week. Velo-City is the “world’s premier cycling planning conference”. It is likely to have a significant bike-sharing flavour – the lead sponsor being PBSC which designed the 6000-odd “Boris Bikes” (aka Barclays Cycle Hire bikes) that are a distinctive sight in central London, as well as equivalent systems in Montreal, Washington DC, Minneapolis, Boston and (shortly) New York City – known generically as Bixi bikes. Vancouver does not have a bike-sharing system of its own, but PBSC have imported a whole load of their Montreal bikes for delegates to borrow for the week, although a recent collar-bone break means I unfortunately won’t be taking up the offer. I did however spot a PBSC/Bixi bike “in the wild” in Vancouver’s beautiful Stanley Park – see above.

I’ll be talking about some new insights into bike-sharing cities worldwide that have been revealed by my Bike Share Map, as part of a three-part presentation on looking at bike-sharing cities at different scales – my co-presenters being the author of the Bike Sharing World Map, and the software developer behind the B-Cycle bike sharing systems.

My presentation is on Wednesday morning (Pacific time) and I’ll write/tweet about it on the day, wifi-access permitting.

To prepare for the presentation, I’ve added a few new cities to the Bike Share Map: Suzhou, Zhongshan, Wujiang, Shaoxing and Heihe in China; and Kanazawa in Japan. One early insight coming from these new maps could be that the Chinese really do work hard (if you excuse the gross overgeneralisation) – typically 11 hours between morning and evening commuter peaks, and seven days a week!

Hehei is shown below – it’s right on the Russian border, opposite a much larger Russian city – hence the Cyrillic (although no bridges across the river near there!)

Note that, in the maps of the Chinese systems, the docking station locations are slightly misaligned with the background maps because of location obfuscation carried out by that country – I’m using OpenLayers rather than the Chinese-based map service that corrects for the errors. The resulting offset is typically only 1-400m though so you can still get a good idea of the shape and size of each system.

Categories
Conferences

WhereCampEU 2012

I was at the third WhereCampEU “unconference” which took place in Amsterdam over the last weekend of April, following previous editions in London and Berlin which I was also at. The meeting was an ideal opportunity for me to feature CityDashboard which I unveiled at the CASA Smart Cities conference a week before, and to show a couple of the items that were popular at the exhibition that accompanied Smart Cities – namely the London Data Table and PigeonSim.

Amsterdam proved to be a challenging city (financially) to visit for the conference, as it was the weekend before Queen’s Day – which is essentially a massive party throughout central Amsterdam, resulting in expensive transport to get there and all the central hotels being booked up or extremely pricy. So it was that I ended up on the outskirts of the city, overlooking a motorway, although this did mean I got to use the very fast and efficient metro service into town each day. Pre-conference drinks were held upstairs in De Waag, the oldest non-religious building in Amsterdam and a fantastically atmospheric venue. The conference venue was a short walk from here.

To get to Amsterdam I took the Eurostar to Brussels, spent an hour and a half cycling around the city on one of the Villo bike-share bikes, and then got another high-speed train to Amsterdam. A nice way to see the countryside, but it did take six hours in total. My return was a 40-minute flight.

Unconferences have no set speaker schedule, but instead participants put a post-it note with their talk title on a grid of times and rooms, and everyone looks at the grid to determine what to go to next. The plan had been to present early on the Saturday and then just relax and enjoy the rest of the meeting, but the Saturday grid was very quickly full, and it wasn’t until Sunday lunchtime that I was able to squeeze in my talk. Although 26 minutes of my 30 minute slot was spent on CityDashboard, most of the tweeted photos were of PigeonSim (that I squeezed in the last four minutes) and my attempts at demonstrating the flying gestures…

There was as usual a wide range of geo and tech talks, one of the most unusual being a psychogeography session with Tim Waters – this unexpectedly involved a practical where we went out in groups and followed and observed pedestrians going about their business (an initial “meta” idea to follow the followers having been vetoed by Tim). I also enjoyed Jeremy Morley’s update on the OSM-GB project at Nottingham to quantify the quality of OpenStreetMap in the UK, and Peter Miller’s peek at a 2.5D rendering of OSM data. Peter also showed behind the scenes of ITO Map’s map layer scripts, these produce simple overlays highlighting particular OpenStreetMap content – these were the inspiration for similar functionality I incorporated into GEMMA. Finally, a short Geo-yoga (mimicing the shapes of countries) session was certainly an eye-opener. Parallel sessions meant I missed some more interesting talks, including one from Google on why Google can work with OSM.

Thanks to all the organisers for putting on another excellent, and free, WhereCampEU!

Categories
Conferences Data Graphics London

The London Data Table

The London Data Table was one of my personal favourites from the exhibition accompanying the CASA “Smart Cities” conference which took place at the University of London last Friday. The concept was thought up by Steven Gray and it consists of a wooden table, cut by programmable lathe into the outline of London. A special “short throw” projector with a fish-eye lens was purchased. It was mounted vertically on a converted basketball hoop stand, pointing downwards and outwards, allowing the content to be approached and examined without the projector getting in the way. Steven has blogged about the construction process.

I created a generic dark grey background map (from Ordnance Survey OpenData) with a blue River Thames as the main identifying feature. This was used by several authors, including myself, to create either Processing “sketches” in Java, or pre-recorded videos, which were displayed on the table during the exhibition. A simple Javascript script running on Node.JS was written to automatically cycle through the animations.

By ensuring that the background map and accompanying sketches/videos where “pixel perfect”, we were able to take advantage of having control of every individual pixel, producing the quite pleasing pixellated effect as seen in the below closeup of one of the sketches (a photo taken of a part of the table) – it is showing a bike share station animation that I created, based on the same data that powers the equivalent website.

The photo above shows the table running another Processing sketch, showing point information from CityDashboard and similar to the map view on the website, except that points are randomly and automatically selected to be displayed, as people stand beside and watch the table.

The most interesting sketch presented on the table (and shown on the right – photo by Helen) was built by Steven Gray and connected to a airplane sensor box, that picked up near-real-time broadcasts of location, speed and aircraft ID, of planes flying over London. The sketch stored recently received information, and so was able to project little images of plans, orientated correctly and with trails showing their recent path. Attached to each plane image was a a readout of height and speed, and most innovatively of all, a QR code was programmatically generated and rendered behind each plane, allowing smartphone users to scan it. QR codes are normally encoded URLs, and these ones were set to point to a flight information website, with the aircraft’s details preloaded, showing a photo, and the origin and destination at a glance.

The QR codes were able to be made very small – using a single projector pixel per QR code pixel and little error correction. Various smoothing and blurring digital effects having been switched off, and a digital connection between computer and projector used, to allow the sharpest possible representation. As a result, my iPhone was able to tell me more about the planes I was seeing fly, in near real time, around the table.

Categories
Conferences London

CASA Smart Cities

[Updated x2] Just a note to say that I will be presenting some of my work, at the CASA Smart Cities free one-day conference. Over 200 tickets have already gone, but there are, at the time of writing, a few left.

There will be an exhibition at the conference, some people in the department have been building some very cool things which will be unveiled there. Unfortunately I’m not allowed to talk about the very coolest one of all, but I have been allowed to post the above graphic which has got something to do with it…

(If you want to have a guess at what it is, leave a comment!)

[Update 3/4 – Tickets are sold out, however I think an extra batch will be available soon.]
[Update 13/4 – A few more tickets now available.]

Categories
Conferences London

Magical Maps: An Evening at the Art of Mapping Exhibition

I was at a talk last night organised by the Londonist – Magical Maps. It took place in the TAG Fine Arts‘ Air Gallery in Mayfair. TAG Fine Arts currently have an exhibition there – The Art of Mapping, and the audience was surrounded by the various artworks – some made from maps, some as interpretations of maps and some simply with a geographical theme.

The speakers were Stephen Walter, an artist who drew the “Island” London map that was a hit at the British Library’s recent Magnificent Maps exhibition; John Kennedy, a London cabbie, blogger and chronologer of bollards and other London objects; and UCL CASA’s very own James Cheshire, recent PhD, now lecturer.

James was up first and showed some of the recent visualisation work by CASA. You can see most of what he showed in an article here.

Then John explained The Knowledge, taking the audience on a verbal taxi journey, from the gallery to the Elephant and Castle – “the true centre of London” – and back, taking into account various banned turns and other taxi restrictions! His journey was peppered with anecdotes of the various places encountered.

Finally, Stephen outlined his artistic career, showing how he switched from traditional photography and painting, to producing the monochromatic repeated symbols on landscapes, that envolved into maps and finally his famous Island map. He also showed some works in progress, such as a map of London’s underground structures (tube lines, water pipes, the Mail Rail etc).

Matt from the Londonist then chaired a Q&A session with the panel, and finally there was another chance to look around and think about the artworks on the walls. I was most intrigued by the below image, which lists and shows all the bridges across the Thames in London, the top line being Teddington Lock and the bottom being the Thames Barrier – but I don’t know why the lines cross over and wiggle. Perhaps it is just purely artistic, but the data visualiser in me hopes there is a deeper meaning and an embedded infographic…

An excellent evening with three very different but equally engaging speakers and some very interesting things to look at.

The exhibition is open for another week, it’s quite small and free, and there is a complementary exhibition book, so take a visit to Mayfair and have a look! There is a talk tomorrow by some of the artists.

Categories
Conferences

Vienna: Previewing GEMMA

At State of the Map EU I presented a preview of GEMMA, my current UCL CASA funded project, focusing particularly on the OpenStreetMap Feature Highlighter, that will be one of our key data sources – it being an OpenStreetMap conference, I thought this would be of most interest to the audience. GEMMA is more than that though – it will both be a portal of content and created maps, and a mobile application for collection and viewing of data.

Unfortunately my talk clashed with a cartography talk but quite a few people were in my track and saw some screenshots of OpenStreetMap data being highlighted in GEMMA. I also talked about integration with other CASA data sources – GEMMA is a consolidation project to tie together a number of CASA products – and mocked up some examples, focusing on a need to understand more of the demographics of London bike-share cyclists, a current personal interest of mine.

GEMMA is a JISC-funded project that I am working on with Steven Gray. It’s one of the JISCGeo projects, and should launch this autumn. It has its own website and also a blog, where I go into more detail about the project. This is the first CASA project, I believe, to make significant use of OpenStreetMap, and its great that we are now able to take advantage of such a rich and expanding dataset.