Categories
Leisure OpenStreetMap

Nike Grid is Back

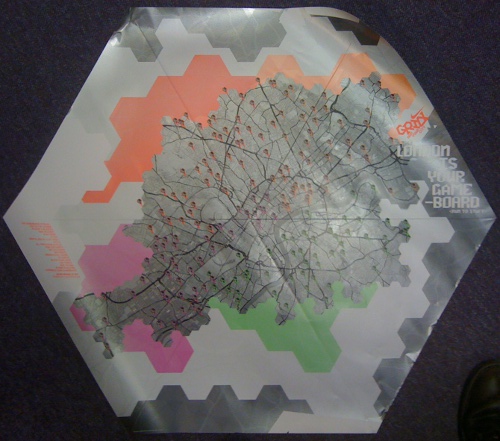
Nike’s alternative reality game/metrogaine/street-o – Nike Grid – is coming back to the streets of London. This time it’s over two weeks rather than just a weekend, and involves an element of teamplay – you can join a team based on your London quadrant (N, E, S or W) or university, or an adhoc one.

Of note, the map in the player pack is a rather nice (I think) restyled silver-and-black version of the green-and-black fold-out maps used in the original game. The source data is OpenStreetMap and the cartography reminds me somewhat of 8-Bit City – it’s not particularly useful for precision navigation, but is a nice example of Boing-Boing cartography, to borrow an expression from a talk at the recent Society of Cartographers conference. Oh, and they have credited OpenStreetMap contributors this time – yay!

Categories
Data Graphics

Girona’s Commuters the Perfect Bike Hire Users?

An interesting pattern spotted on the bike hires this morning – I’m not reading too much into it as obviously Girona’s scheme is far smaller than London’s, but it appears that Girona’s commuters this morning managed to almost perfectly distribute the bikes around the town – a marked constrast to London’s who bunch them all in the City and the West End after each morning commute. Either that, or no one’s using them at all in Girona and the redistribution vehicle got to work very efficiently.

The key measure is the grey graph – this shows the number of bikes that would need to be moved to another dock, in order for all the docks to have same proportion of full and empty slots, i.e. a perfectly balanced system.

Girona at 10:50 BST (11:50 local time):

London at 10:50 local time:

The drop in the imbalance figure in Girona started at about 9am local time – London’s rise started at about 8am local time.

Categories
Orienteering

Urban Orienteering this Year

The Warwick Town Race was the final urban orienteering race in this year’s Nopesport Urban League, so I thought I would recap the six urban races I enjoyed the most this year – most of them Urban League but with some non-league ones too:

Best 6:
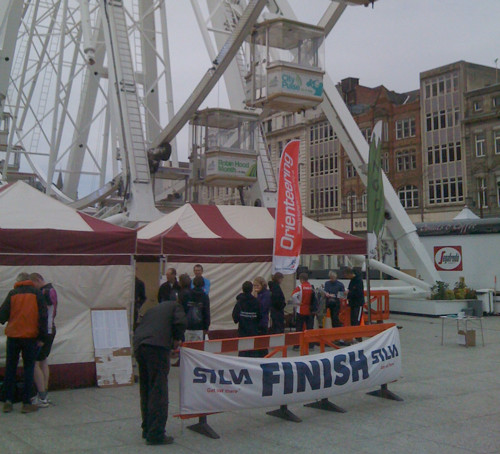
6. Nottingham
I had been meaning to visit Nottingham for ages, and enjoyed this great city centre race, which included the ceremonial Park Estate, an interesting leg up and through the castle complex, and a start/finish in the city’s central square, right underneath a big wheel!

5. Carlisle
A bit of a trek to get to this one, but it was worth the effort, as excellent course planning took us on the sights and included some classic route choice legs, a shopping-centre control near the end, a maze control, and, like Nottingham, a start and finish right in the main town square – excellent for promoting the sport!

4. Lincoln
My third outing here for an urban race, and finally the event is getting the numbers and recognition it deserves. We didn’t get to go in the castle this time, or the city walls or university campus, but instead, like Carlisle, we got a maze control, and a good mix between modern urban areas and the historic centre. Lincoln is one of my favourite orienteering cities and on my must-do list.

3. Didcot
An unexpected delight – the make was entirely in a Milton Keynes-esque housing estate with wiggly roads and unanticipated barriers. Some excellent planning kept the technicality going all the way around. I fell into numerous route traps.
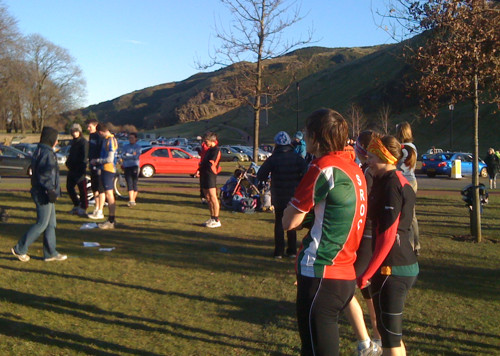
2. Edinburgh
This race is always very early in the year, so is chilly, but the weather was once again sunny. This year’s courses didn’t focus so heavily on the intricate Royal Mile, housing estate and university areas, but the less technical focus was more than made up by the spectacular views on Calton Hill, a section through Princes Street gardens, and some spectacular leg choices including a possible route right through the city station.
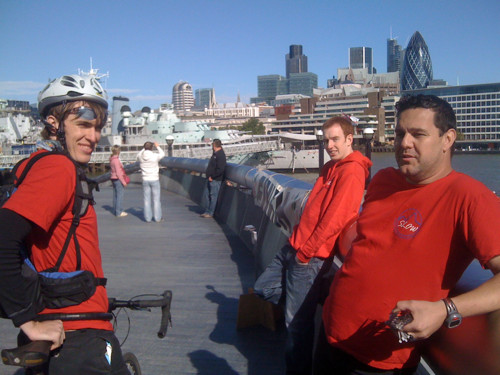
1. City of London
A bit cheeky perhaps to put the race I founded and my club organises at No. 1, but this year’s was even better than the first two years. We had a huge turnout – over 700 running on the day – and the race also got the club together spectacularly, running the show smoothly on the day. With Alan as Race Director and Matthais Mahr (of Venice Street Race fame) as the Course Designer this year, the courses and situations were both superb – the weather being perfect, for the third time in a row, also helped. The second half of the courses were in Bankside and Bermondsey, which meant crowds of passers-by were encountered by the competitors – not something experienced in the City proper at the weekend. Next year’s race is already in the planning and will hopefully be even bigger and better.

Cities that I most want to run an urban race in:

  • Bristol
  • Bath
  • St Albans (happening in 2011!)
Categories
London

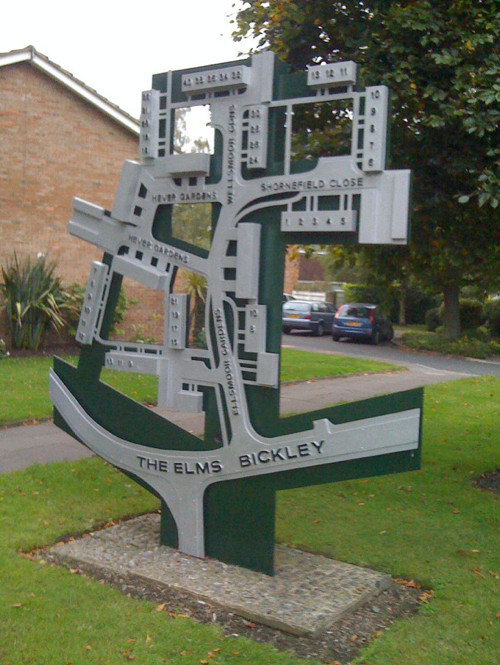
Three-Dimensional Estate Map

I spotted this rather fantastic estate map in Chislehurst, while heading to the Bromley parkrun on Saturday morning:

Categories
Mashups

Bike Hire Around the World

My map/visualisation of the Boris Bikes – the London cycle hire scheme – is now available for four eight fifteen more cities. The complete list:

Paris has so many docking stations that many browsers and computers will struggle to show everything – although the site and animations work very well in Webkit-based web browsers such as Apple’s Safari and Google’s Chrome. The maps are all at approximately* the same scale.

Montreal’s scheme is similar to London’s – indeed the underlying technology (Bixi) is the same and in fact the London system was bought in from Montreal. Paris’s scheme (Vélib) is quite different and, because a separate webpage has to be loaded for each one of the 1200 docking stations, the map only updates once every 20 minutes. Seville and Brussels also use Vélib and update once every 10 minutes, while Montreal, along with Denver, Girona, London, Washington DC and Melbourne, update every two minutes.

More cities to follow soon!

* There is a slight difference in scale depending on the latitude of the city, the difference equal to the difference in the cosines of the respective latitudes.

Categories
Mashups

Animation of Cycle Hire Patterns

I’ve now added a historic view of my cycle hire dock visualisation – you can “replay” the dock capacity changes over the last 48 hours by clicking on the “Animation” link or going directly to the animation page and then clicking “Start Animation”

By default, a different colour/shape scheme is used – the circles grow or shrink and become redder or duller, as the docks fill up or empty respectively. You can change the colours used with the drop-down, as normal.

The circles are being redrawn by your browser for each frame of the animation, and speeds vary greatly on your browser. Each frame represents 10 minutes of real time. The redrawing is intensive and might occasionally lock up your computer!

On my reasonably fast computer, the maximum frame rate I can get is:

  • Chrome or Safari: 7 frames a second
  • Firefox: 3 frames a second
  • Internet Explorer 8: 2 frames a second (zoomed in)

If Internet Explorer is zoomed out to match the default zooms in the other browsers, the rate drops to 1 frame every 8 seconds…

The distinctive weekday commuting patterns are easy to spot, with the morning rush into the centre, followed by the evening rush back out to the edges and the station terminals. Distribution vehicles movements can be inferred, particularly during the wee small hours when there is little other activity.

Categories
Orienteering

Orienteering 2.0

At tomorrow’s City of London Race I’m trying something a bit interactive – a Twitter Wall and Photo Wall for the event. Tweet your photos and comments with hashtag #cityrace and they’ll appear up at http://cityrace.org/live/.

I’ll be taking a few photos of the event and posting them up during the course of the day.

Categories
Mashups

London data in MapTube

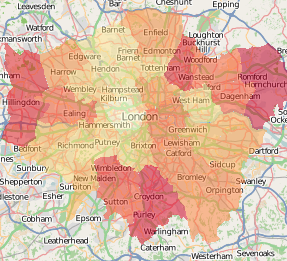
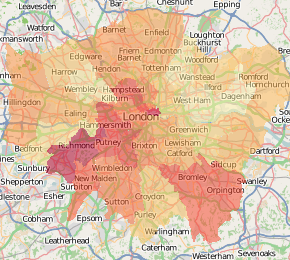
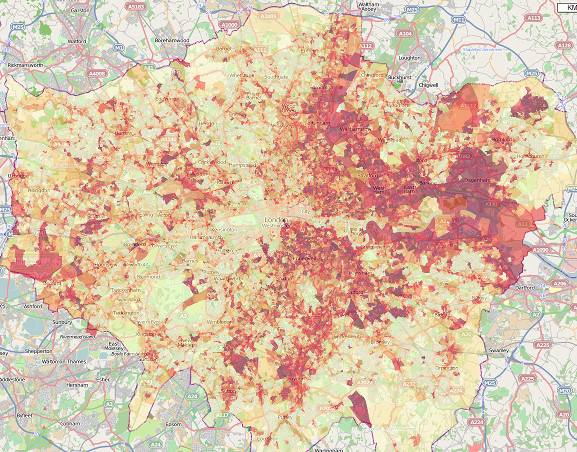
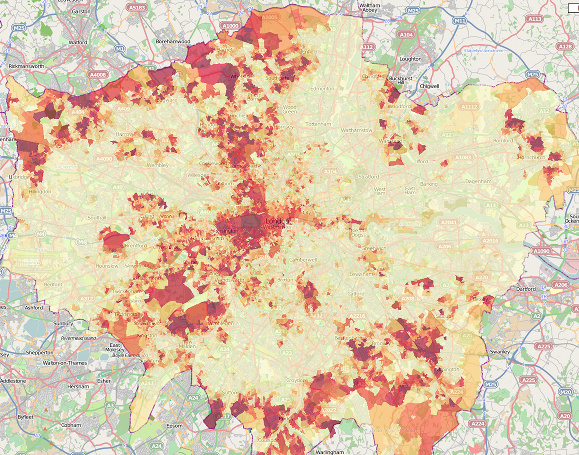
I have uploaded a number of spatially-referenced, recent datasets from the London Data Store, to MapTube. Here are some of the more interesting looking ones.

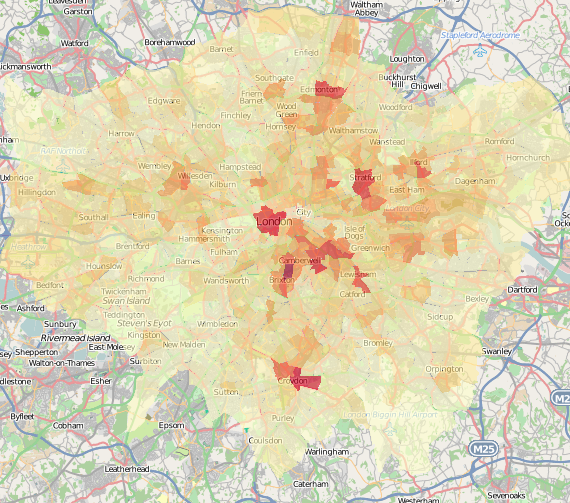
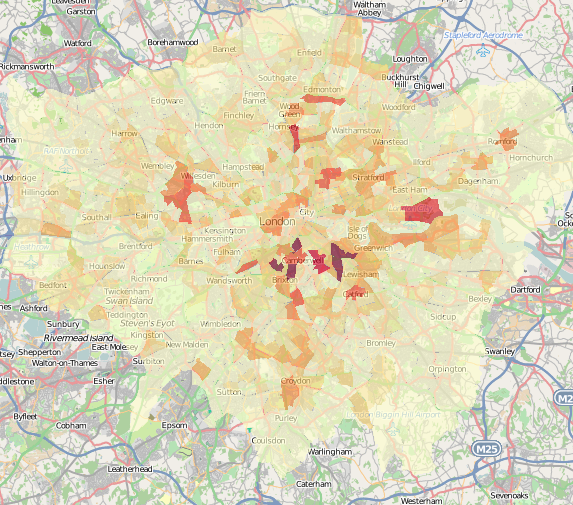
(1) Data from the London Ambulance Survey (LASS) – here comparing the numbers of ambulance callouts to assaults with knife injuries vs gun injuries for each London ward in the last 24 months to May – please note the category scales across the two maps areas are different, so cannot be compared directly. Darker, redder values are higher. Click a picture to see the interactive map and legend, and download the source data.

Knives
Guns

(2) The Active People Survey – an interesting difference between the boroughs for volunteering rates compared with participation rates. Darker, redder boroughs indicate higher proportions of those surveyed in that borough say they volunteer or participate in active sports.

Volunteering
Participation

Volunteering much better in the outer London boroughs right around the centre, while participation is concentrated in the south-west.

(3) Houses in council tax bands A, B and C (the lowest rates) vs those in F, G & H (the highest rates), at output area level – very detailed! Not necessarily a proxy for affluence. Again, darker, redder areas have a greater proportion of houses and other dwellings in these bands.

A, B and C (Lowest council tax rate bands)
F, G and H (Highest council tax rate bands)
Categories
Orienteering

Third City of London Race – Just A Few Days Away!

The 3rd City of London orienteering race is happening this Saturday, and the entry this year is huge – over 700 people have pre-entered online, and entries on the day will also be taken – assuming there’s any spare maps and start times that is.

With these numbers, I am wondering – is this the second biggest standalone urban orienteering event ever, after Venice?

After last year’s race, which moved a bit west to take in the Temple complex, this time we go south a bit, adding Bankside and Bermondsey to the map. Many courses will start and finish on different sides of the river, ensuring at least one crossing of the Thames during the race will be needed.

My tips for competitors would be:

  • Unlike the City of London itself which is quite at the weekends, parts of Bankside, especially close to the river, can be very busy with pedestrians indeed.
  • We will be enforcing the out-of-bounds rules even more seriously this year, particularly as most courses go near busy roads. If you cross a road marked as out-of-bounds on the map (purple striping) then you will get disqualified. Don’t assume a marshal is going to give you the benefit of the doubt, tell you of or warn you. They will simply disqualify you without notifying you. I was amazed at some people trying to cross a four lane dual carriageway last year, right by a tunnel mouth, with a large barrier and a concrete slipe in the central reservation. Don’t do it! (There will be no tapes on the ground to mark such roads.)
  • The south side of the river is more residential than the north, particularly in the Bermondsey estates. Please be courteous to any residents you meet. Remember, it’s just an urban race, not a championship, and there is no prize money at stake for taking the racing line. Please take particular care not to barge through crowds on the riverside or near Borough Market, even though they may slow you down.
  • If you are on one of the longer courses, your route to the start goes across Tower Bridge – if the bridge has to lift for river traffic, you might be waiting for around 10-15 minutes to cross. However it’s quite a spectacle to see.
  • Don’t forget to go straight to download, which is at the Assembly in T47 Sports Venue, as soon as you finish. You can then return to the Finish to spectate, if you want.
  • Unlike in previous years, we have a licensed bar at the Assembly!
Categories
Conferences OpenStreetMap

OpenStreetMap – The Quality Issue

This was the title of a presentation I gave today at the 46th Society of Cartographers Summer School (Lanyrd), which was in Manchester.

The abstract was:

OpenStreetMap is coming of age, but as it starts to be used more in the mainstream, the age-old questions of quality and completeness are coming to the fore. A range of data sources have been used to build up the map in the UK, from GPS traces to aerial imagery, historic mapping, NaPTAN and the OS Open Data release, each with their own benefits and limitations. This talk looks at a number of studies and tools developed to quantify, compare and address accuracy and coverage of the project in the UK, in an attempt to answer the key questions – is it complete yet and just how good is it?

OpenStreetMap – The Quality Issue

View more presentations from oliverobrien.

The presentation makes references to two animations, which are the Milton Keynes Mapping Party traces and the US TIGER import sequence.