I’m presenting a short paper today at the Uncertainty Workshop at GIScience 2014 in Vienna, looking at cartographic methods of showing uncertainty in the new OAC 2011 geodemographic maps of the UK using textures and hatching to the quality of fit of areas to their defined “supergroup” geodemographic cluster.
Mapnik was used – its compositing operations allow the easy combination of textures and hues from the demographic data and uncertainty measure onto the same tile, suitable for displaying on a standard online map.
These are my presentation slides (if you get a bandwidth message, try refreshing this webpage, or download here):
You can download a PDF of the short paper from here.
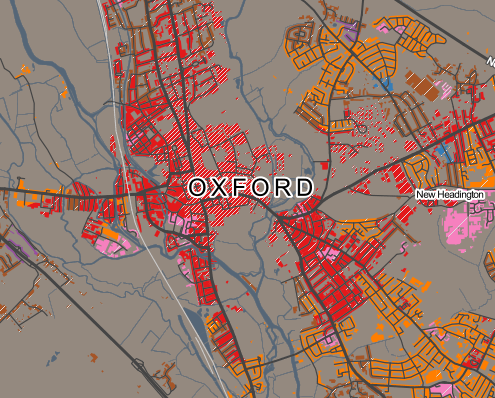
A special version of the OAC map, which includes the special uncertainty layers that you can see in the paper/presentation, can temporarily be found here. Use the extra row of buttons at the top to toggle on/off uncertainty effects, and see the SED scores at the bottom left, as you mouse over areas. Note that this URL is a development one and so likely to change/break at some point soon.
Background mapping is Crown Copyright and Database Right Ordnance Survey 2014, and the OAC data is derived from census data that is Crown Copyright the Office of National Statistics. Both are used under the terms of the Open Government Licence.
One reply on “Mapping Geodemographic Classification Uncertainty”
[…] was in Vienna for most of last week, presenting at a satellite workshop of the GIScience conference, before joining the main event for the latter part of the […]