The ONS publish small-area population estimates annually, for England and Wales, and the NRS similarly do for Scotland. By taking two of these datasets, we can see how the population of Great Britain is changing – births, deaths, internal and international migration and military deployments/homecomings all act to fluctuate the population.
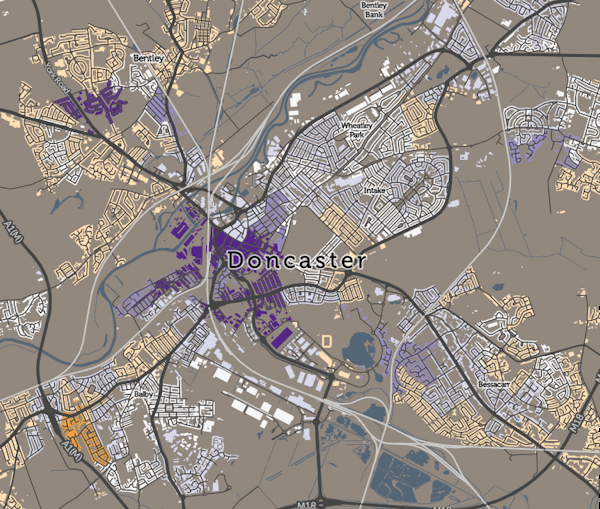
I’ve taken the 2011 and 2014 “mid-year” population estimates for LSOA and DZs – statistical areas with a typical population of 1000-1500 people – and compared them, to derive small-area population changes. You can see the resulting map here.
In London, a couple of striking patterns appear. Inner West London – Kensington & Chelsea, Fulham, Wandwsorth – is seeing a striking depopulation (orange on the map). This may be due to the tendency of landlords in these wealthy areas to convert old housing stock, that was split into multiple flats, back into houses for the (very) rich. In a few exceptional cases, houses themselves are being knocked together. The unaffordability of the area and its old-age population may also have something to do with it. Further east in Tower Hamlets, increased immigration and a high to-immigrant birth rate may be contribution to the rapid rise in the population here (10%+ in many area – dark purple on the map) in just 3 years. The increase across GB in total, from 2011-14, is 2.1%. Some of the large increases can be due to new university campus accommodation opening up, while large falls are often an indication of housing estates being demolished and redeveloped.
Many cities across Great Britain show a characteristic of newly-desirable city centres increasing in population, as denser housing developments pack people in, while the suburbs decrease in population. The Liverpool/Wirral conurbation is a fine example of this. An exception is Milton Keynes, where no Green Belt constraints its expansions, and new housing estates keep being built in the outer “blocks” of this grid city. Some smaller places with special employment constraints on them seem to be almost universally decreasing, such as Barrow in Furness, as well as Thurso and Greenock, both in Scotland.
Explore the map on CDRC Maps, and Download the data on CDRC Data.