Categories
Technical

Easy Webpage Scraping with Python

To produce the tube station usage mashup I obtained the data from the TfL website. Unfortunately the data is not in an immediately usable format – rather than there being a CSV file to download, or a large HTML table, the data is presented as a separate webpage for each station and each year.

Luckily, Python makes it easy to get the data as a CSV file – although you do need to know a little Regex too, to extract the data you want. To construct the regular expressions needed, I used an excellent online tool, RegExr.

Once you have your regular expressions ready, you just use Python’s Urllib, RE and CSV libraries, and some loops, to download the webpages, get the data, and write it into a CSV file.

Here’s the script I used – note I’m using the back-slash character at the end of some lines below to indicate line continuation:

import urllib2, re, csv

stationnums = {2003:4, 2004:4, 2005:4, 2006:4, 
2007:4, 2008:6}

addressPre = "http://www.tfl.gov.uk/tfl/corporate/
modesoftransport/tube/performance/entriesandexits.asp"

indRE = '.*?salign=right>([0-9]{1,9}?)</td>.*?'
totalRE = '.*?smillions)s=s([0-9.]{1,9}?)</strong>.*?'
nameRE = '.*?selected>(.*?)</option>'

resFile = open('results.csv', 'w')
resWriter = csv.writer(resFile, quoting=csv.QUOTE_MINIMAL)

for i in range(2003, 2009):
	for j in range(1, stationnums[i]+1):
		address = addressPre + "?id=" + str(j) 
		+ "&agekey=" + str(i)
		html = urllib2.urlopen(address).read()
		indRes = re.findall(indRE, html)
		totalRes = re.findall(totalRE, html)
		nameRes = re.findall(nameRE, html)
		if len(nameRes) > 0:
			resWriter.writerow([i, j, 
			nameRes[0], totalRes[0]] 
			+ [e for e in indRes])
resFile.close()

Change the stationnums values for each year to 304 (except 2008, to 306) to get all the data.

Categories
Data Graphics Mashups OpenLayers OpenStreetMap

Tube Stations in London – Visualisation

I was inspired by seeing this map and associated article on the New York Times website, linked from Going Underground, to create a similar mashup/visualisation of entry/exit volumes from the 300-odd tube stations in London. On their website, Transport for London provide the metrics for entries/exits from the stations, between 2003 and 2008, broken up into rush-hour, regular and weekend travel.

Each circle’s area is directly proportional to the flow numbers for that station (click on the circle to see the numbers.) The circles are rescaled between the first metric (total flows) and the rest, so direct comparison of metrics is possible except between the first and others, Blue circles represent an increase in flow and red a decrease.

If the mass of circles are obscuring each other, zoom in!

You can try it out here.

Some technical notes:

The background map is a custom render of OpenStreetMap data, with the tube lines highlighted in their traditional colour – it doesn’t always look quite “right” when you zoom in, due to the way the lines are tagged in my own copy of the OpenStreetMap database. The stations are even harder to disambiguate, so I’m using a free source from Wikimedia Commons, this means they don’t always line up.

Because your browser gets a copy of all the flow data when you load the page (yes I’ve heard of AJAX) it does run a little slowly in Internet Explorer, particularly the slider bars – these allow you to “drag” through the range of metrics or years.

Categories
Leisure Orienteering Orienteering Events Log

E9: Gridded

So, I ran in the Nike Grid ARG (alternative reality game) on Saturday, concentrating mainly on the E9 postcode in Hackney, but also going jogging around the City of London (EC1, EC2, EC3 postcodes) doing an informal City of London Race. The aim of the game was to log runs between four specially designated phoneboxes in each postcode, dialing in at the start and end of each leg. The more legs done, the more points you got – bonus points were available for running early/late, doing a fast run, completing every possible leg, and the most number of legs.

My strategy was hampered by having a severe hangover from the night before, so I didn’t make it out of the house until 3pm (the game ran from 8pm-8pm) and was pretty dehydrated. It was also a very warm day – and, to make things worse, the phoneboxes themselves acted as heat reservoirs. One City leg went via a supermarket and its chiller cabinet…

In my first session I essentially ran all of the six possible legs between the four phoneboxes, and several extra legs between the two closest ones. In the later session (after my jog around the City) I again aimed to run all six possible legs, getting the fastest split bonus for each, but realised near the end I wasn’t going to make it to/from the far one, so repeated some of the smaller legs. The many people enjoying a cool drink in the garden outside the Royal Inn on the Park, immediately opposite the most southerly phonebox, must have wondered what was going on.

The map below shows the routes I took between the four phoneboxes, marked with green rectangles:

In total I ran around 16.5km (10 miles) in the E9 postcode. The phonebox dialing process meant I essentially had a two minute rest after every leg – the longest of which I did in just under 10 minutes. My shortest leg was 1m 26 – I tried this one again and again but my times kept getting worse with each attempt!

I ran into the last box about 10 seconds before the game closed – I had to push it for this final leg and got bonus points for running this leg in the fastest time. (In fact I think I picked up all six of the fastest leg bonuses during the day.) The Nike team were filming this last phonebox and interviewed me afterwards.

I was extremely unlucky not to win – notice how close I finished to the eventual winner in the leaderboard below. However I did get 110 of my points in the dying seconds of the race. The guy who finished third appeared at the same phonebox a minute later (i.e. too late) and, had our arrivals been reversed, he would have finished in front of me.

Although I didn’t win, a friend won not once but twice in a different postcode, so I’ll at least get to see what prizes I missed out on!

There were some “bugs” in the game – certain phoneboxes in the City had quite unresponsive keypads which made it difficult to clock in at the end of the leg. Quite often, the automated service appeared overloaded and stopped talking half-way through, leaving you wondering whether the run had been correctly logged or not. The game leaderboard was updated in real time, which was impressive, but it was written in Flash so I was unable to see how I was doing on my iPhone. (A dedicated iPhone app would have been cool.) There luckily weren’t many players in my postcode, but many more would have clogged up the system – it took 1-2 minutes in the phonebox to stop and start each leg. Some clarity on how many points were on offer would have helped me refine the strategy, although I suppose part of the challenge is figuring it out for yourself. A couple of “test” 3am short legs I tried on my way back from the pub didn’t count for “early” bonus points, although game messages suggested they would at that time. Finally the maps weren’t too great – some phoneboxes were in the wrong place. I had however done a bit of online research first though and used a marked orienteering map instead, so this didn’t affect me. A friend of mine greatly benefited from one phonebox not being themed – he was the only person in that postcode who realised it was still a game phonebox and so completely destroyed the opposition.

It must have been a nightmare to organise, with nearly 150 postboxes scattered across many miles that needed theming, maps distributed to them, checking and fixing them – not to mention answering the many and varied questions and complaints on the Facebook event page, and writing the software to handle the automatic logging, updating and cheat detection.

Overall I really enjoyed the style of the event. There was definitely something of “The Matrix” about sprinting through the grimy streets to a phonebox (themed in green and black, too!) and breathlessly grabbing the receiver in front of surprised bystanders. All things considering, it was a nice “Real Life 2.0” take on the street orienteering theme. Not sure we’ll see this repeated – Nike generally organise a “concept” event in London yearly but each year’s idea changes dramatically to keep things fresh – however I would certainly love to try it again.

Categories
Mashups OpenLayers OpenStreetMap

Manchester Map Mashup

I’ve created a mashup of lots of maps of Manchester as a proof-of-concept of how easy it is to mashup using OpenLayers. It’s not particularly pretty but does involve lots of maps.

See it here.

The layers are:

  • OpenStreetMap
  • Ordnance Survey Street View
  • Ordnance Survey 1:25000 First Series (1959)
  • Ordnance Survey New Popular Edition (1948)
  • Marr Map of Housing Conditions (1904)
  • Swire Map of Manchester (1824)

The first four maps are all hosted on OpenStreetMap servers.
The Swire map also contains an inset, dated 1650!

Categories
OpenStreetMap

OpenStreetMap: 250,000 People

The OpenStreetMap project, as of today, has over 250,000 registered users. It is fair to say that most of these will never edit the map, or have just edited it to put their house in and then don’t return, but there are also a large number of active contributors to the project, such as the London community. Over 40,000 “ways” (generally, roads) are being added to the project every day. The project is continuing to grow, and the release of usable Ordnance Survey (OS) data covering the country, at the beginning of the month, looks like it will advance the project, rather than reduce its relevancy in the U.K. For the first time, a quick way to “complete” the roads is available, but there are many other features still to add which will keep contributors busy for years to come. For one thing, none of the OS data includes paths and tracks, and it’s not completely up to date, unlike OSM which sometimes gets roads added on the day they open – or before!

The London community at the moment is concentrating on filling in the building areas in central London, so the map here looks less like a “patchwork quilt” of filled and unfilled blocks, and more like the contiguous mass you see in other cities like Stockholm, Frankfurt or Milan. (Having said that, we are well ahead of Paris, Barcelona, and, suprisingly, Berlin.)

Our next pub/map meetup is in Holborn on Wednesday evening – come along!

Categories
Leisure OpenStreetMap

Nike Grid – Nice Idea, Shame about the Attribution

[Update – Nike Grid is back in late October! – and they sorted the map this time.]

Nike are running an event next Friday/Saturday in inner London called Nike Grid. It’s a great idea – basically players run between any two specially marked phoneboxes in a postcode area (e.g. E9). Typically there are 3 or 4 such phoneboxes in each area, each temporarily branded with the event logo. At the beginning and end of the leg, the player phones a special number from the phonebox, entering their player code. As the call comes from the phonebox, it’s proof that the player is there then. Players then earn badges by doing the most number of runs in a postcode, doing all the possible combinations, the fastest run, the hilliest run, etc.

Like I say, a great idea. It’s a technologically advanced version of street orienteering, similar to what my club has been running in similar locations in central London over the winter and it’s a shame that Nike doesn’t mention the “o” world anywhere in their publicity for the event – but maybe orienteering is a bit anoraky for their brand experts? (Nike don’t make orienteering shoes anyway, but their big rivals, Adidas, do – my current o-shoes are Swoop 2s.) It’s a missed opportunity to promote the (sub)-sport to a market that likes running, is happy to be holding a map as a different challenge, but has never heard of orienteering.

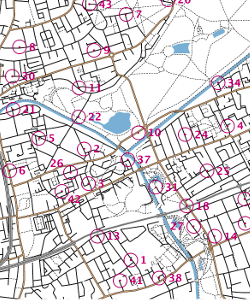
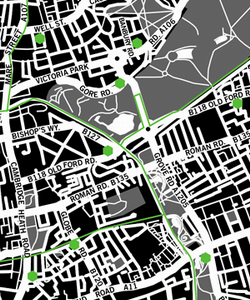
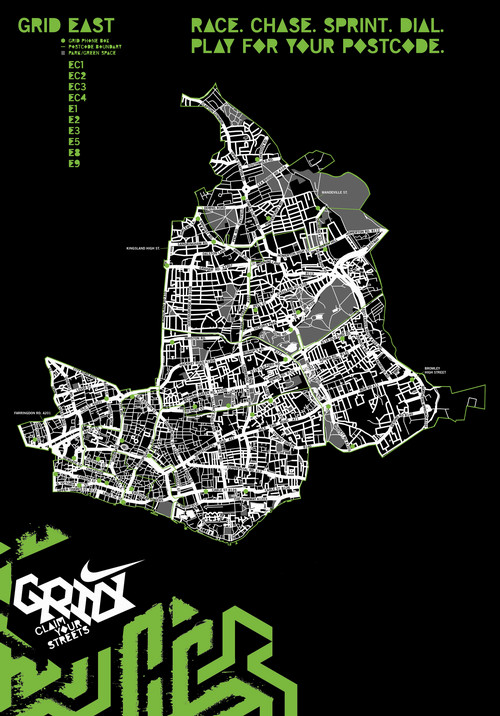
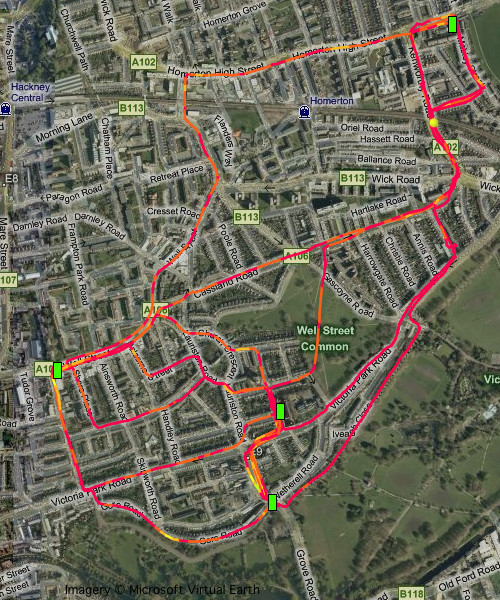
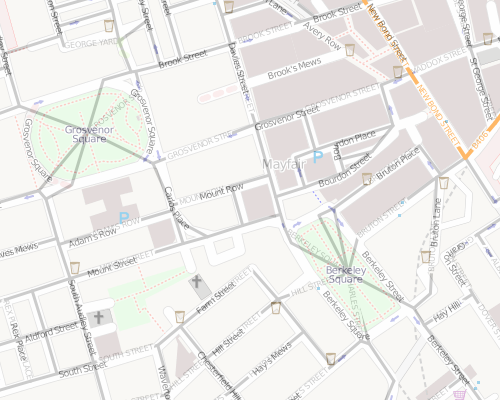
On the left is part of the map my club used for a street-o in Bow, below it is Nike’s version.

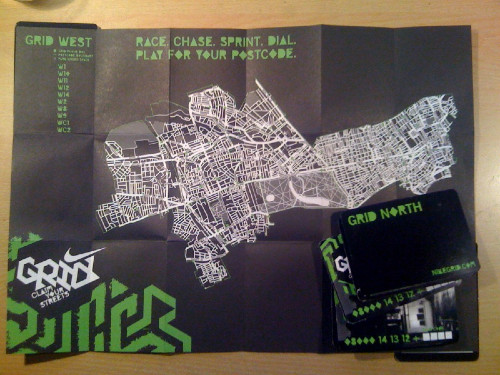
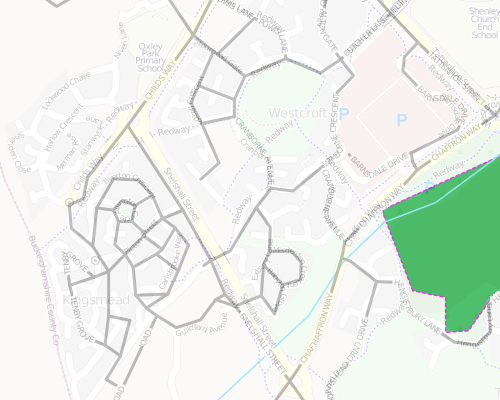
To pick your way between phoneboxes, you get a map – downloadable from the website, or collectable in paper form from the phoneboxes themselves or the Nike stores in London. There’s four maps, representing south, west, north and east London – the coverage generally extends out to the edge of zone 2. I visited a few of the phoneboxes this evening and picked up the north and the west maps (the south and east ones haven’t been put out yet, or have all been swiped already). On the maps, the phoneboxes are shown as green hexagons and the rest of the map is a rather pleasingly mimimalistic white-on-black design, rather like some of the other great cartography you can create out of the OpenStreetMap data for inner London that I and other project volunteers have collected.

In fact, wait a minute. Some of the detail on the maps around my home area looks rather familiar. Yes, they have actually used OpenStreetMap data for the map. I can see the characteristic kinks in the paths in my local park that I surveyed and that don’t appear on OS/Google/Teleatlas/Navteq et al map data. Nothing wrong with that – using OpenStreetMap data commercially such as promoting a brand of shoes is just fine. Except they haven’t attributed the project or stated the licence the maps fall under – both requirements of using OpenStreetMap data to create a derived work, especially in printed form. Oops.

Why am I bothered? Contributors of open data don’t do it for the money (mostly) but for the “kudos”. In the case of OSM, the project itself typically gets attributed rather than specific contributors, for practical and logistical reasons. The contributors are still acknowledged in the data itself. The project benefits from acknowledgement because publicity will help increase the number of contributors to the project and so increase the quality and completeness of the map data, making it in turn more viable for future uses. Everyone wins.

All they need to do is (a) add a line to attribute the project, such as “Map data (c) OpenStreetMap and contributors, CC-BY-SA”, to the maps concerned on their website and future printed copies, and (b) not be surprised if people make derivative works from the maps, which is allowed by the licence the data has been used under. I’m tempted to create an interactive map for the whole of London or indeed the world, in the same style – the cartography is very nice.

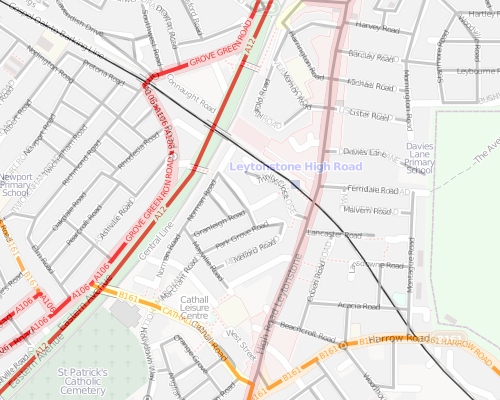
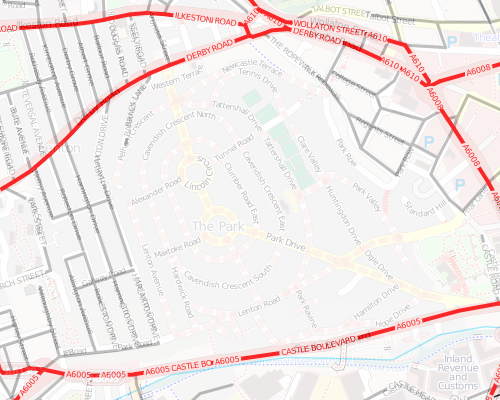
Incidentally the map is created using quite an old copy of the data, from before last September – some of the more recent roads I and others have added to the project don’t appear. The designers have also enhanced the widths of some of the major roads, and added in road names and numbers. Roundabouts have also been added in as proper circles. There are some mistakes in the process they’ve used – the main track (highway=bridleway if I recall correctly) around Victoria Park doesn’t appear, but the paths (highway=path) that lead to it do, resulting in a rather odd “gappy” looking bit of cartography around there, ironically a similar quirk of the Google maps of the same area.


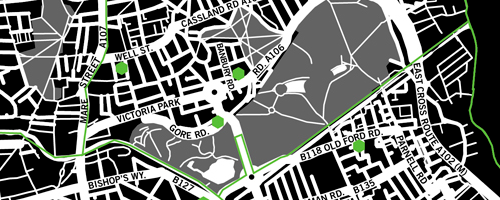
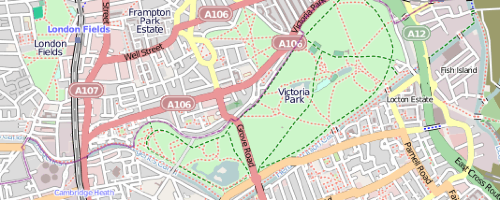
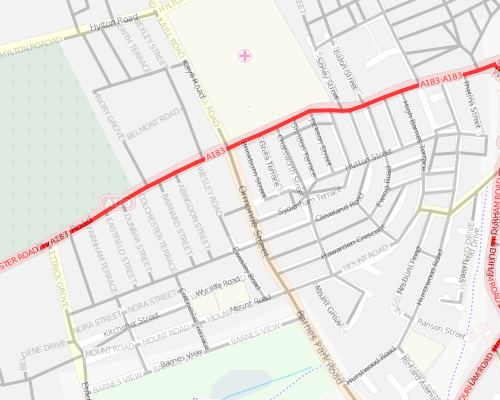
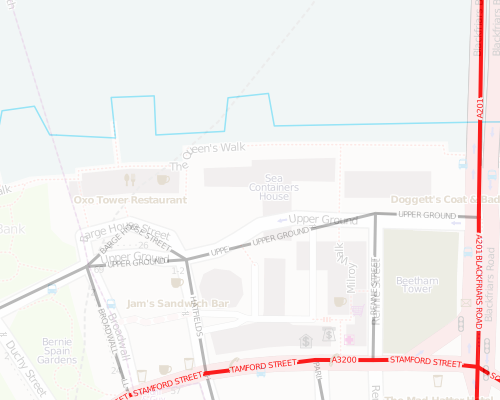
Also, I’m not sure where the postcode boundary lines come from, but they mis-align somewhat with the OpenStreetMap data – in some places the lines wander near, but not exactly along, the centreline of a boundary road. You can see a particularly bad mismatch between the green line (postal boundary) and the white line (here a canal) on the left of the first map above. Just a cosmetic quirk.

It is a really great idea, and a really nice bit of marketing. I will, hopefully, have a go at getting a few of the badges during the 24 hours the game runs. Let’s hope they get the attribution sorted out.

(I notice it’s happening the same weekend as the London Marathon, who have Nike’s rivals Adidas as a key sponsor. The timing is not a coincidence, I’m sure!)

By the way, Nike have made it very hard to be contacted about this – there are no contact details on the game’s website and it is not possible to send private messages to the owner of the game’s page on Facebook, thanks to the way the social network sets up fan pages. Sigh. Of course, people in glass houses and all that, I should attribute the screenshots in this blog post – all the screenshots are of maps created using map data (c) OpenStreetMap and contributors, CC-BY-SA.

[Update – I have made minor edits to improve the clarity of the article and add the note about Google.]

Categories
Conferences OpenStreetMap

GISRUK Navigation Challenge

This is the map GISRUK 2010 attendees are using to get from UCL, where the conference is, to the River Thames, where the boat await for the evening cruise. On the way, some of them are doing the challenge, which is to take the optimum route to visit any 6 of the 12 control points – a blue plaque at each one to prove their visit. The map was made using the OpenOrienteeringMap map builder.

[Download PDF]

(Note: The start point was actually from just east of “B” rather than the triangle.)

I haven’t yet computed the best route, I think it’s probably BAJFED or maybe BMCKED. There is no “trick” best route, as the points were fairly fixed by the locations of the blue plaques. But the solution is apparently not immediately obvious to the human eye.

Categories
Conferences

Spatial Interaction Models for Higher Education

I gave a talk on spatial interaction models, geodemographics, and flows from schools to universities, at the CASA conference on Tuesday. This was on the work I did last year with Dr Alex Singleton.

My slides are here on Slideshare and below:

View more presentations from oliverobrien.
Categories
Olympic Park

London Olympic Park Construction

Last weekend I cycled around the perimeter of the building site that will be the Olympic Park in 2012. It’s a big site – over 9km all the way around.

Here’s some photos I took – click through to the Flickr pages for some slightly pithy commentary to go along with them:

Direct link to the photo set.

Categories
Mashups OpenLayers OpenStreetMap

Accuracy vs Completeness: OSM vs Meridian 2

[Updated x2] Yesterday’s Ordnance Survey OpenData launch has provided the OpenStreetMap community with a potentially rich set of data to use to complete the map of Great Britain. OpenStreetMap’s accuracy and detail is generally excellent, however a problem which is (very arguably) more important than either accuracy or detail, in a map is that some parts of the country are substantially incomplete.

It’s not that the data quality is poor, it’s that someone with a GPS (or a satellite photo) has never been to that part of the country to gather the data in the first place. There are still significant parts of Scotland and Northern England which have many missing roads. The NPE (out-of-copyright) maps have been useful in starting to fill out these sections, but there’s always going to be a roads missing from a 60-year-old (or older) map.

So, the OS datasets could be very useful. Perhaps the most interesting of the datasets is Meridian 2, it is a vector dataset covering the whole country. One thing that needs to be watched out for though is that Meridian (which is a “complete” dataset of the country) is relatively inaccurate Pixellation or resolution isn’t a problem, it being vector based – but data is quite simplified.

I’ve built a mashup which allows direct comparision of the Meridian and OSM data for Great Britain. I’ve added in most of the available layer files that come with the Meridian package that has been released as part of the OS OpenData initative. The only two areal ones I’ve added are for woodland areas and lakes – everything is linear. I’ve added in labels for the roads and rivers, but no boundaries or point features, at this stage.

You can access the mashup here [now offline] (N.B. Not tested in IE so will probably break horribly in it.) Zooming in reveals the relative coarseness of the Meridian data – although crucially it is “substantially” complete for all but the smallest of roads, for the whole of the UK – not just for the major cities where the OSM contributors mostly live!

Completeness
In the pictures below, the “solid”, thinner roads are Meridian and the fatter roads with “borders” are OSM.

Spot the missing roads in Meridian around Leytonstone in East London [Update 1 – Some sections of motorway are missing from my rendering but are present in the data – it is possible this problem extends to smaller roads too so take these screenshots with a pinch of salt]:

…but go further out of London, and it doesn’t look so good for OSM:

Interestingly, the Park Estate in central Nottingham is missing entirely from Meridian:

The Park Estate is a private estate and the roads are not maintained by the council – this might have something to do with it. I’ll be running around the Park Estate next weekend.

Accuracy
[Update 2 – Meridian is not intended to be used at scales larger than 1:50000, as per its documentation, so I shouldn’t really be comparing it with OSM which generally is based on data recorded at larger scales. So, bear in mind these screenshots are all larger than 1:50000 scale.] It’s difficult to authoritatively judge the relative accuracies of the two datasets without getting out on the streets or looking at aerial imagery – but you can infer a basic measure of accuracy by looking at how roads “wiggle” – or, in the case of the Mayfair squares below, how Meridian converges the square to a point:

Detail
A little unfair to compare the two here, as Meridian 2 was always meant to be a medium-scale dataset, whereas OSM can be all things to all people!

The tiles that make up the imagery are generated on demand (and cached for subsequent use) so may run slowly. You’ll need to zoom in quite a long way before all the features get added to the map. Use the slider on the top left to fade between the OSM and Meridian layers.

The images are derived from Ordnance Survey data © Crown copyright and database right 2010 and OpenStreetMap data which is CC-By-SA OSM and contributors.