From the Mapping London blog:
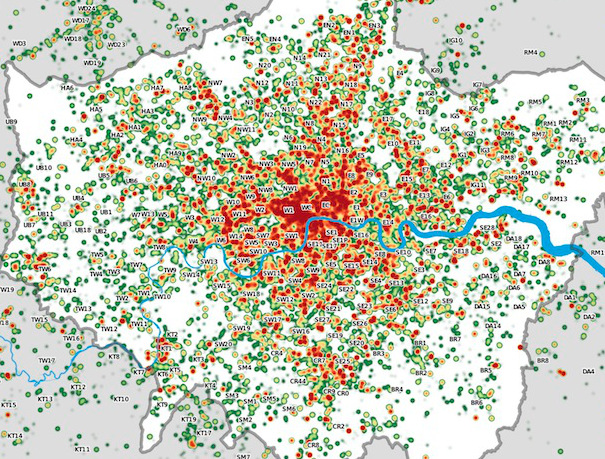
Many Twitter messages, or “tweets”, are sent with latitude/longitude information, allowing an insight into the places where the most amount of tweeting happens. For a magazine article, I produced the above map of London, with help from a colleague Steven Gray, who collected the data across several weeks using some technologies he has developed. It is a heatmap of sorts, with particular locations where the level of tweets are very high. The data is collected in a 30km radius around central London.
London’s city centre stands out, as would be expected, as well as a distinctive streak of tweets heading directly north – an arm of London where the typical Twitter demographic – young and connected – makes up a particularly high proportion of people living there. Other features – such as along a road in the North West that suffered severe roadworks during the collection period, the A13/Eurostar travel line running along estuarine Essex, and the runways of Heathrow Airport, also appear. It’s also interesting to see how large parts of surburban London are “empty” of tweets.
Further detail on Steven’s Big Data Toolkit blog.
The map contains data which is CC-By-SA OpenStreetMap and contributors (the River Thames) and which is Crown Copyright Ordnance Survey (OpenData) 2011.
One reply on “Tweets in London”
[…] by urban data. Slides 4-5: More information. Slide 6: More information, live version. Slide 7: More information. Slide 8: More information about CityDashboard, live version. Slide 10: Live version of […]