Diamond Geezer escaped from London by plotting the shortest distance (as the crow flies) from his home to the London boundary, and then taking the shortest walking route that gets to that same point on the boundary. He identified a pub in Woodford Green as the closest point on the boundary from a nominal start location at the Bow Roundabout in east London. A great example of experimental travel.
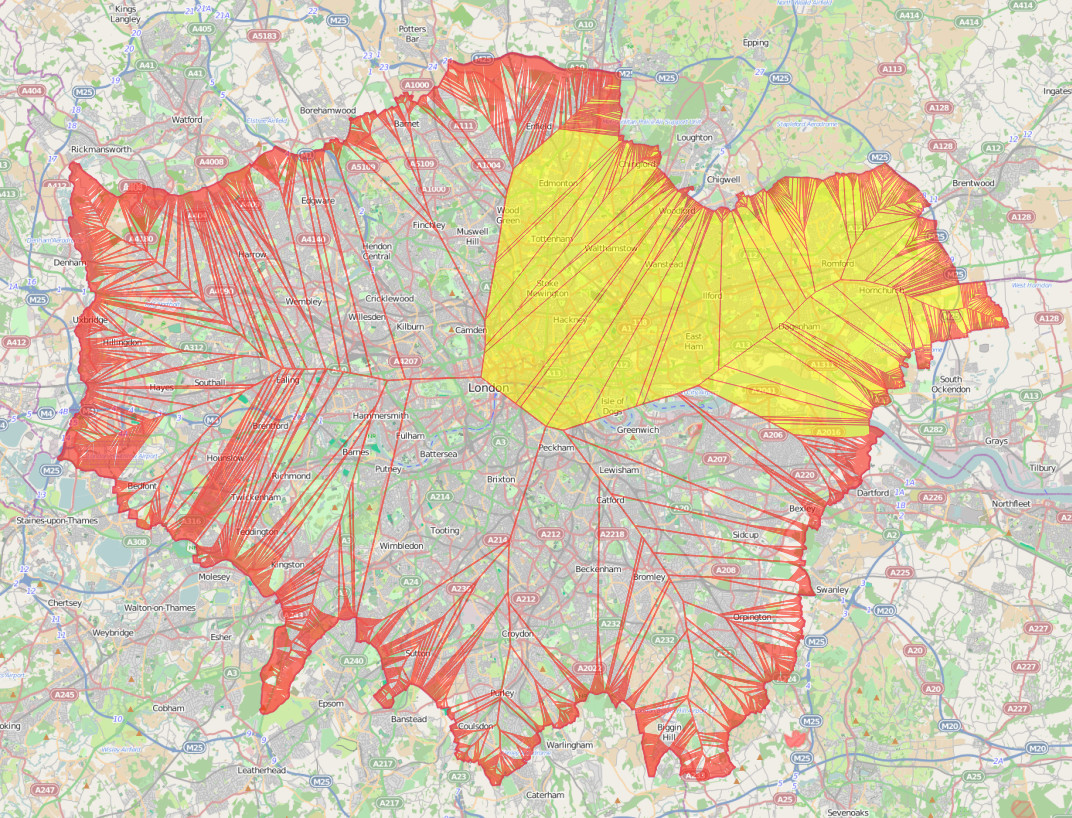
Being an occasional spatial analyst I wondered if there was a way to do the first step – identifying the closest point to me that is outside of London – using a GIS. In so doing I identified that there are five key exit points to where a large portion of Londoners could “escape” to. Additionally, it’s a novel way of identifying the location of a north/south London line, an east/west London split, and a way of working out which home county is your closest. Most of these are obvious if you are in outer London (Zones 3+), but are not so apparent if you are an inner-city dweller. The map above shows the parts of London where The Only Way Is Essex if you are looking for the shortest route out as the crow flies. This includes, somewhat surprisingly, the northern corner of Burgess Park, on the Old Kent Road in what most people would consider south London.
It turns out it is relatively straightforward to produce such a map – however with the important simplification that it is necessary to treat the boundary as a series of points, rather than as a border “line”, to avoid the problem with huge numbers of very small areas when increasingly close to the line. I used QGIS to create the resulting map, shown above. To create the map, follow the steps at the bottom of this post.
The bit of London’s border which has the largest part of London as its go-to point, shown on the map below, is just behind The Midas Touch pub, just south of Worcester Park station. This is the closest point on the London border for a huge area, including such places as diverse as Hyde Park, Kensington and Elephant & Castle.
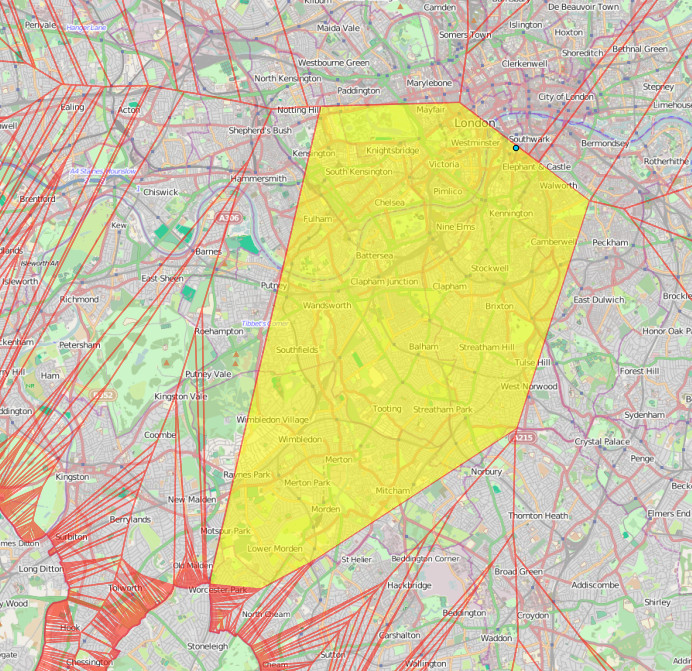
The blue dot near Waterloo in the map above, by the way, is the geographical centre, or “centroid“, of London.
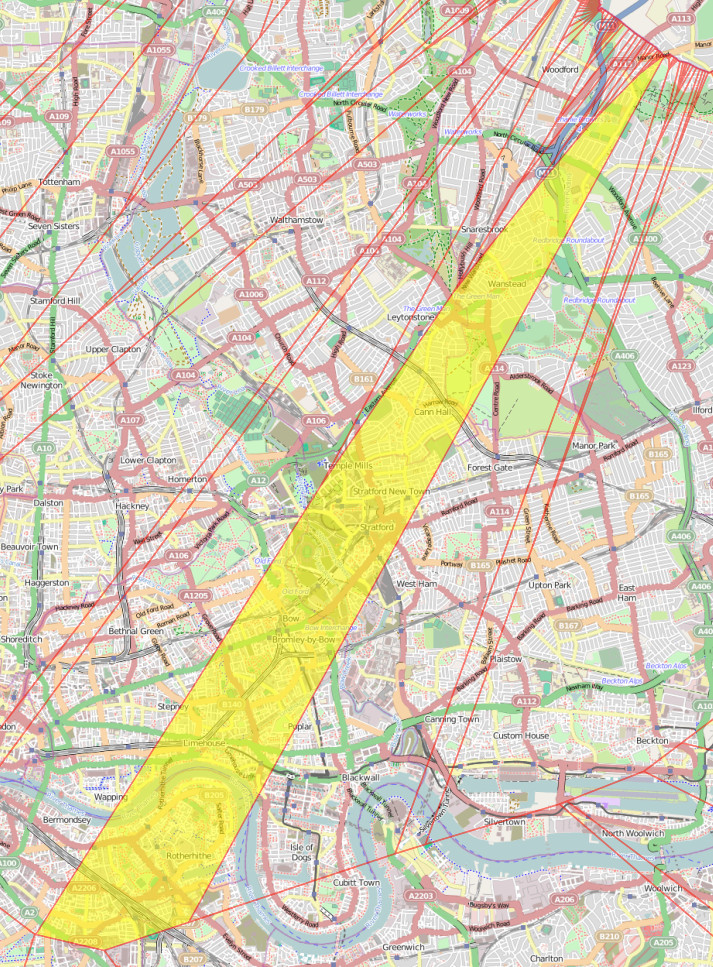
So did DG head to the right place? Nearly. The exit point is on Manor Road, by Woodfood Green, just a short walk from the aforementioned Woodford Green pub:
& those five exit points most useful to Londoners? The places on the edge of London that are the nearest such place for the the five largest single polygons on the map. They are:
- Just behind the aforementioned Midas Touch pub near Worcester Park station.
- The junction of footpaths just beyond the end of Courtwood Lane, in Forestdale. Near Tramlink’s Gravel Hill station.
- A track just inside the northern edge of Joydens Wood (the wood itself, not the village). Not far from Bexley.
- The far end of the first road loop in Elstree Park, just off the Stirling Corner roundabout.
- The middle of the woodland behind Monken Hadley Church of England Primary School.
So now you know.
Addendum: How to create the map yourself
You’ll need QGIS installed and to be familiar with how to use it to load layers, change settings etc.
Note: In many of these steps, the GIS operation requires the naming of a new Shapefile that is created, which should then be added to the list of loaded layers (aka Table of Contents) for the next operation.
- Add http://mapit.mysociety.org/area/2247.geojson as a new layer. This loads in the London (strictly, Greater London Authority plus City of London) boundary.
- Save this layer as a Shapefile, with CRS set to British National Grid, aka ESPG:27700, and add it back in to the project. The specification of British National Grid is necessary to ensure that “proper” square metres are used in the distance calculations.
- Set the project to allow on-the-fly reprojection, and set its coordinate reference system to British National Grid, also.
- Choose “Extract nodes” from the Geometry Tools submenu in the Vector menu. Because the London boundary is sufficiently complex, there is generally at least one point at least every 100m along the boundary. Optional: You can simplify the boundary before this step, for example if simplifying to 20m accuracy, this will drop the number of points generated from around 10000 to around 1000, although the resulting final map will look a little different.
- Choose “Voroni polygons” from the Geometry Tools submenu in the Vector menu.
- Choose “Clip” from the Geoprocessing Tools submenu in the Vector menu. You need to clip your newly created Voroni polygons layer to the original boundary polygon that was loaded in in the first step. This step will take a few minutes if you didn’t simplify the boundary.
- Add in an OpenStreetMap background. This can be done by installing the OpenLayers plugin, then using the plugin’s menu and adding an OpenStreetMap layer. You normally need to pan (or zoom) the map a bit for it to first load in. Note also this step will reproject the map to “WebMercator” which is similar to, but not the same as, British National Grid – sufficient for display purposes however.
- Reorder the layer list so that the OpenStreetMap layer is at the bottom.
- Remove all the other layers except for your newly clipped Voroni polygons and the OpenStreetMap background.
- Adjust the styling of the Voroni layer, so that the polygons are semi-transparent.
One reply on “I’m a Londoner… Get Me Out of Here!”
[…] What’s your closest escape route from London? […]