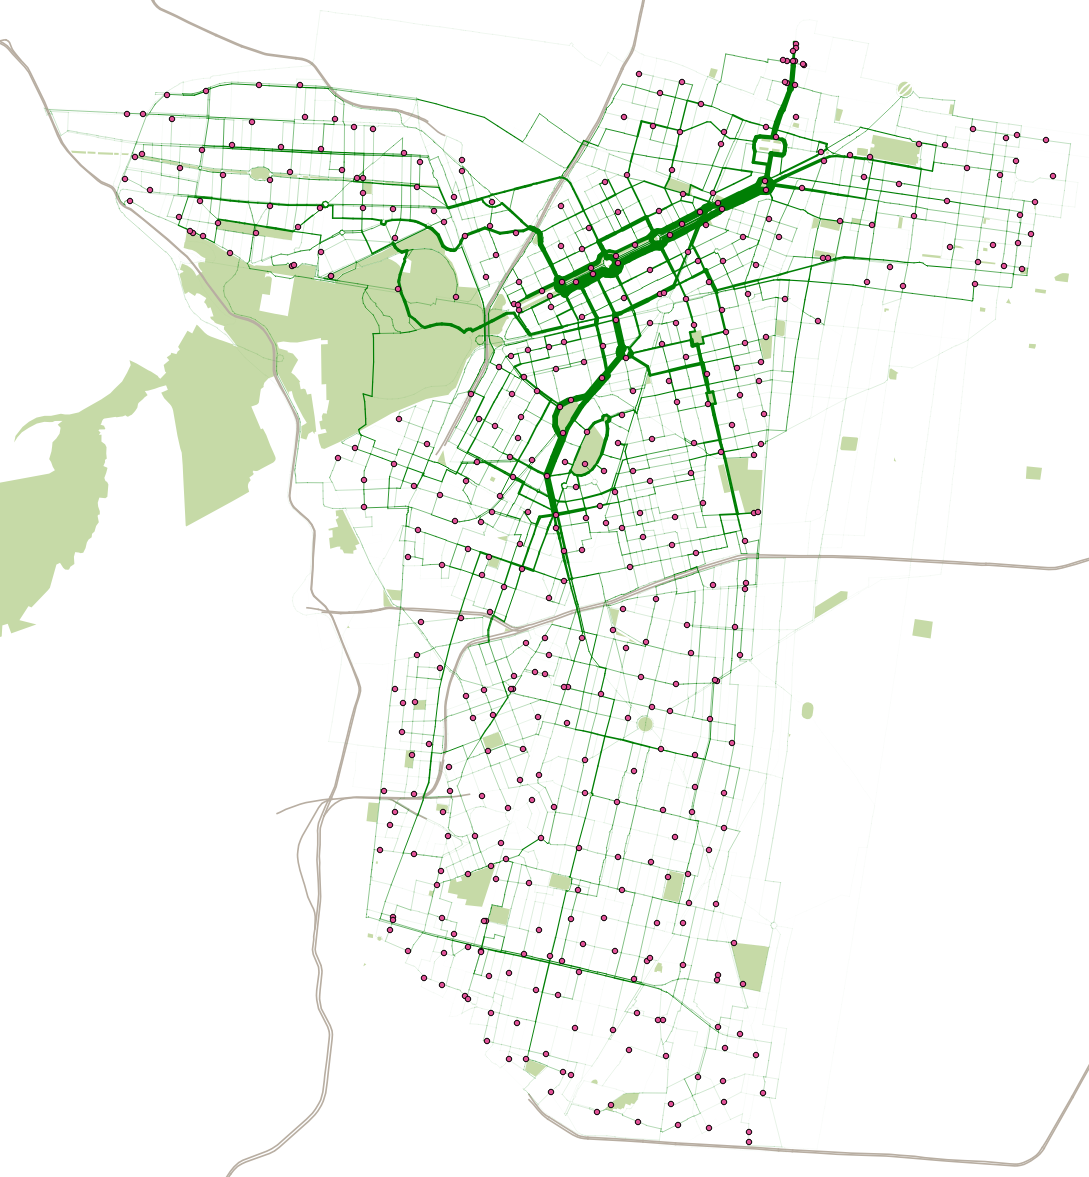
The above map shows the estimated routes and flows of over 16 million users of the bikeshare in Mexico City, “ECOBICI“, across the 22 months between February 2015 and November 2016, using data from their open data portal. The system has been around since 2011 but its most recent major expansion, to the south, was in early February 2015, hence why I have show the flows from this date. The wider the lines, the more bikeshare bikes have been cycled along that street. The bikes themselves don’t have GPS, so the routes are estimated on an “adjusted shortest route” basis using OpenStreetMap data on street types and cycleways, where any nearby cycleway acts as a significant “pull” from the shortest A-to-B route. Having cycled myself on one of the bikes in November (and hence my journey is one of the 16.6 million here) I fully appreciate the benefits of the segregated cycle lanes along some of the major streets. As my routes are estimates, they don’t account for poor routes taken by people, or “tours” which end up at the same places as they started. So, the graphic is just a theoretical illustration, based on the known start/end data.
The bikeshare journeys are in a dark green shade, ECOBICI’s brand colour, with docking stations shown as magenta dots. Magenta is very much the colour of CDMX, the city government, and it consequently is everywhere on street signs and government employee uniforms. Mexico City doesn’t have rivers, which are the “natural” geographical landmark for cities like London and New York where I’ve created similar maps, so I’ve used the motorways (shaded grey) and parks (light green), to provide some context. Mexico City extends well beyond the ECOBICI area.
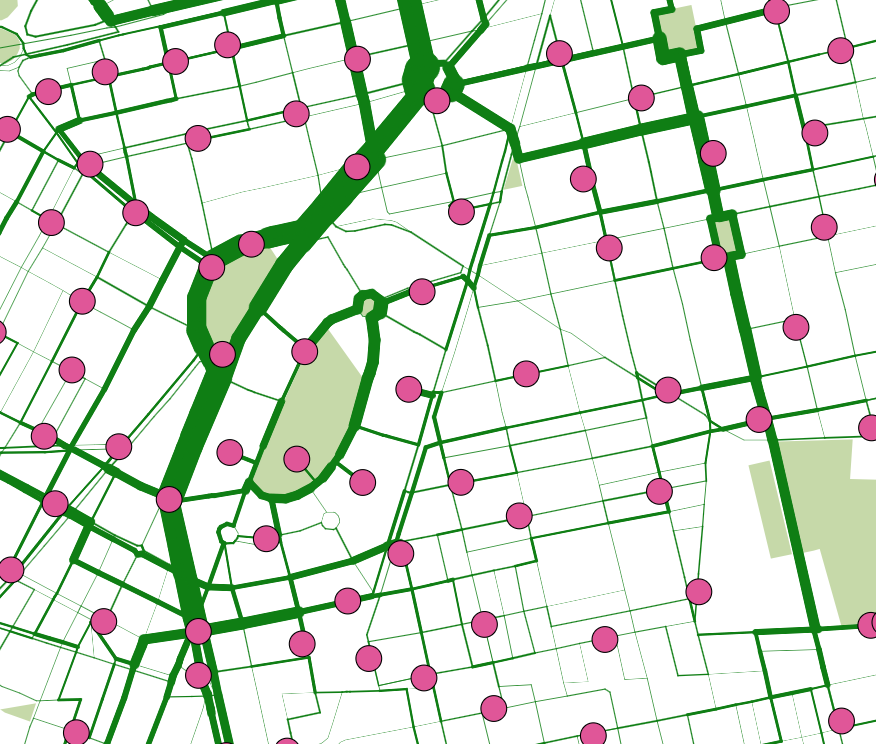
The maps shows huge flows down the “Paseo de la Reforma”. This route is always popular with cyclists, thanks to large, segregated cycle lanes in both directions, on the parallel side roads. On Sunday mornings, the main road itself is closed to motor traffic, along with some other link routes. This is not reflected in my routing algorithm but also acts to increase the popularity of the flow in this general area. To the north, a cluster of docking stations and a large flow indicates the location of Buena Vista station, the only remaining commuter rail terminal in Mexico City. Further south, the curved roads around Parque México and Parque España are also popular with bikeshare users, in this leafy area that very much feels like the “Islington” of Mexico City:

Mexico City’s ECOBICI is one of the 150+ systems I’m tracking live on Bike Share Map. You can see the live situation, or an animation for the last 48 hours.
4 replies on “How Mexico City Does Bikeshare”
How did you do this? OSRM for plotting shortest routes according to trip data?
Using Routino to plot shortest cycle routes (so slight bias towards cycle paths, quieter roads). More details at http://oobrien.com/2014/04/5-5-million-journeys-at-nyc-bike-share/
[…] on the release of tens of millions of individual bikeshare journeys on Mexico City’s ECOBICI, reveals the concentration of flows down the city’s major city centre artery, Paseo de la Reforma (O’Brien, 2016), indicating the […]
Hello,
Great use of data. I’m trying to present something visually similar but for rail journeys across the UK. What did you use to make your maps?
Thanks,
JR