Categories
Notes

The Information Continuum

So Google Reader is closing this summer. That’s a shame. It’s been my RSS feed reader for many years. I’m currently subscribed to 163 feeds, split across London, Tech, Mac, GIS, InfoVis, financial, orienteering and general. For a while I had a specially crafted Twitter search that fed tweets into Google Reader, but I eventually realised (when this overwhelmed the reader with the volume of tweets coming in) that mixing Twitter and feed reading is not a good idea. They serve slightly different purposes.

One of the feeds I follow has suggested that, if I don’t switch feed reader, then there are other ways to keep updated – weekly email newsletters, Facebook update and Twitter updates. The thing is, none of these get quite the same level of attention: There is a continuum of information that RSS fits into.

Google Reader sits squarely between these other ways I could absorb information, but each has their own problems:

* Email – I normally get about 20-100 a day. These normally get read within a few hours of being sent, and will generally then sit in my inbox until I’ve around to filing them and replying to them – this might be a couple of months in extreme cases. The problem is that as a personal copy of each email has been delivered to you, and takes up (account) space. I feel compelled to just not let it sit there in the inbox forever.

* Google Reader – generally about 20-50 a day. I don’t feel the need to read everything, but I’ll read most recent stories if bored. Probably about 50% get read. if I particularly like a story, I’ll star it – I maybe do this on 1% of stories. But otherwise they just scroll of to the bottom.

* Facebook Updates – Facebook keeps changing the rules and algos, so it’s quite possible that, unless you pay for advertising and prominent placement, your story which you push to a Page that I subscribe to, won’t actually get seen, unless I proactively go to the Page or view my Pages tab which is obscure. It’s not a reliable free way to see content.

* Tweets – I follow around 600 people and so probably get about 2000 a day, i.e. 1-2 a minute – much higher during the afternoon than the morning or night. There’s no way I’ll see everything.

Here’s the best way to the worst way that I will see/know/act on something – the continuum of information.

  • Face to face – obviously. Unless I’m trying to concentrate on simething else!
  • Postal mail – it sits on my desk at home filling up space until I do something about it
  • Phoning me – I can’t miss it but I might forget about it
  • Tweeting me – unless I’ve done something very popular, these will generally get seen
  • Mobile texts – require me to either action then, or forget but re-remember
  • Facebook IM
  • Work Email – will read and forget, then eventually file/reply
  • Personal Email – will read and forget, then eventually file/reply
  • Facebook Mail
  • DMing me on Twitter – Twitter/clients are starting make this harder to see/remember
  • FlickrMail
  • RSS (Google Reader) – Fills an important space – I curated my view, so it is the most likely way I’ll read things that are not specifically directed to me.
  • Facebook Groups – The most read non-personal content on Facebook, thanks partly to email/text notifications
  • Facebook Newsfeed – I check it a lot less than Twitter but it’s also less noisy
  • Twitter Timeline – too many tweets come in and scroll off too quickly
  • Comment on my blog – thanks to a non-functioning mailserver.
  • Facebook Pages – stories here tend to not get viewed unless paid-placement
  • Websites – I actually have to visit them. This doesn’t stop me viewing a few key websites (BBC News, Diamond Geezer, Nopesport, Reddit London are my top four) almost every day.
Categories
London

Rename a Tube Station!

If you could rename a London tube (or DLR/Overground) station, what would you rename it to and why?

I would rename the following:

5641085817_6f9c5c1460_n

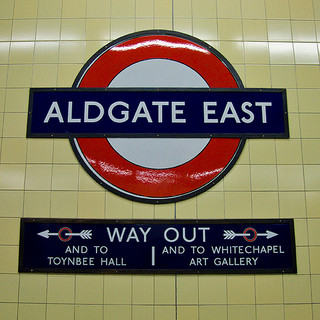
  • Aldgate East to Brick Lane
    Why? To promote a famous street and important tourist attraction for Tower Hamlets, and to distinguish it better from the nearby “Aldgate” station. (link)
  • Stratford International to East Village
    Why? International trains aren’t going to be stopping at Stratford International any time soon, so why not name it after what is surrounding it – East Village (formerly the Athletes’ Village) or Queen Elizabeth Olympic Park – although the latter is a bit long. Alternatively Stratford Olympia?
  • Paddington (H&C/Circle) to Paddington Basin
    Why? The two Paddington Underground stations a separate and a long walk from each other. Importantly, tourists getting going to the other Paddington Underground station, to go east, will have to get off after one stop anyway, and change at Edgware Road – a hassle.
  • Paddington (Bakerloo/District) to Praed Street
    Why? Same reason as above – to distinguish the stations more and make it less confusing to tourists arriving from Heathrow Airport. It used to be called Paddington (Praed Street) anyway.
  • Euston Square to Gower Street
    Why? It used to be called Gower Street, and it’s on the latter street, not Euston Square. Plus it’s a block away from Euston station, although it might be connected in the future if/when High Speed 2 happens.
  • Tottenham Court Road to Centrepoint
  • Why? It’s at the far end of Tottenham Court Road – so not much use for someone wanting to be at the north end of the road. Plus it’s right by the Centrepoint tower and could be considered to be the centre station on the tube network – the crossing point of the North-South Northern Line (Charing Cross Branch) and the East-West Central Line.

Photo CC-NC-By-SA-ND Chris Beckett.

Categories
Olympic Park

Back in the Park?

piptour

Well last year was the year that the Olympic Park was seen in all its glory. Since then, the gates have been firmly shut and the electric fencing remains about the perimeter. I’ve touched briefly on the schedule for the walls coming down and the park reopening, but it’s this summer before the first bit opens.

However, you can get in now for a sneak peak. Initially, it looked like the free bus tours, which operated during the main “Big Build” before the Olympics, and which I went on a couple of times in 2010 and 2011, were coming back in their traditional form. They would probably be less exciting than during the construction phase, as deconstruction is inevitably less interesting. However since then there appears to have been a slight change in strategy.

Now, the tours have been rebranded Park in Progress and are £15 – which doesn’t sound good. But when you look closely, the bus tour is essentially to get you to the base of the Orbit tower, from which you can climb up and take in the view. The Orbit cost £15 during the Olympics itself, but you also needed a ticket to get in the Olympic Park in the first place, and that was the difficult bit, if you weren’t an appropriately accredited Gamesmaker. Now, it’s much easier to get there – and for groups the price drops to around £10/head, with it being cheaper still for children. Not too bad. Slightly cheekily, they won’t give you a refund if the Orbit is closed due to high winds – but they’ll try and book you on a later tour.

Here’s what the park looked like just before the Olympic Games last year.

Categories
Geodemographics

This Place

thisplace1

This Place was a visualisation of 2011 Census data for England and Wales, for your local area. [It is now offline.]

I’ve been meaning to adapt Michal Miguski‘s This Tract for the 2011 UK Census, ever since I saw it a couple of years ago showing the 2000 US Census. The clear, clean styling – simple a map of the local area, and a nice table of pie charts – was a world away from the choropleth maps I’ve produced previously. The most striking feature is what’s not there – when you are looking at a particular area, the surrounding areas are blanked out – they don’t distract.

Following the release of fine-grained 2011 Census data at the end of last month, at least for England and Wales, I’ve spent some time getting the data into the equivalent format and also customising the website with UK-specific metrics. The end result is not architectured in quite such an elegant way as Michal’s – his version uses geographical information direct from the “official” Census site, courtesy of their web services, and predefined static datafiles, whereas mine makes numerous queries to a local database – so his would scale better, although mine is backed by a decent academic server.

thisplace2

I’ve used different colour ramps for each of the metrics – for ethnicity I used a rainbow-based colour ramp. The attempt is that the “colourfulness” of the wheel shows the ethnic diversity of an area. A fully diverse area will have significant proportions of every colour, creating a “wheel” of colour.

Lots of interesting results – for example, parts of London are very diverse while there’s plenty of places which are extremely homogenous – but not always with White British. Sometimes there’s a two-way split. As you might expect, parts of university towns have a young and highly educated population. The centres of major cities have many more men than women living there, and seaside results have an old population. Deep in the rural countryside, primary industries such as farming are popular. Liverpool’s large public sector workforce is clear.

One undocumented feature – you can input the MSOA code (found at the bottom of the page) into the search box, or the URL, to create a weblink specifically for that area. At the moment, my smallest unit geography is MSOA – the size is about right, but the boundaries of MSOA can be very arbitrary. If the data is released at ward level I may well switch to that.

The mapping for This Place comes from MapQuest Open, which is MapQuest-style map based on OpenStreetMap data. ThisPlace is now offline.

Categories
Bike Share London

The London Bike Share Marches North

bbike_nexpansion

It’s not just Wandsworth and Fulham that will be getting Barclays Cycle Hire in the next year or so when Phase 3 goes live – Hackney and Islington will be getting a few too. The iconic “Boris Bikes” will be heading up Mare Street towards central Hackney – although not quite getting there – plus there’ll be various new docking stations in Haggerston, just north of the Regent’s Canal. There will also be a docking station on Islington Green, and a few around the Canal Museum on Calendonian Road. In all, if planning permission is forthcoming, there will be up to 15 new docking stations, all north of the Regent’s Canal. It’s a modest increase – 3% – but the communities affected will doubtless enjoy the new facility. It’s still a long way south from myself though!

I’ve adapted my Bike Share Map to show the proposed locations, above. The potential docking stations appear in green.

It’s great to see that the system is continuing to expand in all directions – but now the central London demand is being sated, it would be nice if Transport for London relaxed their requirement for docking stations to be within 300m of each other. The most successful bike share systems generally have a dense core and a well spaced out periphery, which accommodates commuters, tourists and locals equally well. I would much rather have the system properly penetrating Zone 2 and 3, even if there’s a 1km gap between each docking station. Then it becomes more useful for the utility users who unlike the commuters (going from stations to skyscrapers) and tourists (concentrating on the bigs parks and markets) act as useful re-distributors in their own right by the nature of their diverse journey directions.

Thanks to Loving Dalston for spotting a planning application for the docking station by London Fields. I had a quick trawl through the Hackney and Islington council planning websites to spot the others.

Categories
Geodemographics

A Map of Scotland’s Deprivation

newbooth_edinburgh

[Updated] About this time last year, I created a “Map of the Geodemographics of Great Britain” which included the Output Area classifications (OAC) for GB, based on the 2001 Census, and also included the Index of Multiple Deprivation (IMD) for England, published in 2010. At the time, there was no up-to-date equivalent to the IMD for Scotland. However the 2012 SIMD (Scottish IMD) has recently been published, and I’ve applied the resulting datasets to my map, using the same technique of filling in just the buildings, rather than all the land, in the appropriate colour (a red-yellow-green Colorbrewer ramp from most to least deprived).

The SIMD and IMD are calculated in a similar way – by looking at measurements of poverty for each area across several categories (e.g. education, crime, income) – however the details of the way the measures are taken is slightly different between the two countries. Additionally each index is based on the range of deprivation found in that country. This means that the indices should not be directly compared across the two countries, i.e. A dark green area in Scotland only has the same relative level of deprivation to similarly coloured areas in Scotland, not in England. Accordingly, the website does not show the two IMD maps at the same time – there is a toggle at the bottom to switch between the two (and to the OAC). As an example – just because Edinburgh is largely green does not mean that it has the same leve of affluence/deprivation, on absolute terms, as a similarly-coloured city in England.

Nonetheless, comparisons within Scotland are perfectly valid, and the differences between the cities are striking – most notably Edinburgh vs Glasgow. See the whole map here.

[Update – I have created a new user interface for SIMD12, you can see it at CDRC Maps]

As always with classifications, remember that they represent an average throughout the geographical area concerned – in Scotland this area is known as a Data Zone, which is similar to an English Output Area (as an aside, the SIMD is more fine-grained than the IMD – the latter uses a more aggregated measure). This means that the colour covering a house is not a measure for that house, simply that that house is within an area where the average SIMD is that value. Also, non-residential buildings get coloured, as the dataset I’m using for the building (Ordnance Survey Vector Map District, via the OS Open Data releases) does not distinguish building types. The SIMD of buildings that have no occupants is meaningless, and they are not included in the underlying calculation.

newbooth_glasgow

Categories
Orienteering

Orienteering Plans for 2013

Here’s the events I’m aiming to run in for the first half of this year, plus five big weekends in the latter half. *M* = possible Munro trips.

  • Edinburgh Big Weekend, 26-27 January YES!
  • 3 February
  • 10 February
  • CSC Qualifier, 17 February YES!
  • Burnham Beeches, 24 February YES!
  • VM, 2-3 March? YES!
  • 10 March
  • 16/17 March (possible training with club)
  • 24 March
  • 29 March-1 April (Easter) *M*
  • SN Sprint & Middle, Wellington & Bagshot 6/7 April
  • Southern Championships at St Ives, 13-14 April
  • British Sprints at Loughborough, 20 April + London Marathon help, 21 April
  • Hampstead/St Albans Urban Race Weekend, 27-28 April
  • BOC Weekend in Dorking, 4-6 May
  • Porto City Race, 12 May
  • Monar round? 17-20 May *M*
  • 26 May
  • Surrey Hills Race?, 2 June
  • Poundbury Urban, 8 June
  • Salford/Manchester Urban, 15 June
  • Perthshire round? 22-25 June *M*
  • 30 June

Later in the year, there are these to look forward to:

  • Dunwich Dynamo, 20-21 July
  • Scottish 6 Days, 28 July-3 August
  • Lincoln/Sheffield Weekend, 31 August-1 September
  • Bristol Weekend, 7-8 September
  • London Weekend, 21-22 September
  • Rome Weekend, 1-3 November
Categories
London Technical

Me, Geolocated on Twitter

tweets_london

I was prompted by the excellent Twitter Tongues map, where geolocated tweets in London (including mine, and those from hundreds of thousands of others) were mined by Ed Manley over the summer, and then mapped by James Cheshire, to see where I had left my own Twitter footprint.

Many people would probably be quite alarmed to learn that the data, on the exact locations they have tweeted at – if they’ve allowed geolocation – is freely accessible to anyone, not just themselves, through the Twitter API.

tweets_chancerylane

It’s a bit of a faff to get the data – Twitter is starting to rollout a “download my Tweets” option which may make the first few steps here easier – but here’s how I did it.

  1. I used the user_timeline call on the Twitter API, repeatedly, to pull in my last 3200 tweets (the maximum) in batches (“pages”) of 200. The current Twitter API (1.1) requires OAuth authentication – not of the person whose tweets you are mining, but simply yourself, so that rate limits can be correctly applied. Registering a dummy application on the Twitter gives access to OAuth credentials, and then using the OAuth tool generates a CURL string that can then be run – the result is put in a file ( > pageX.json), and I do this 16 times to get all 3200 tweets, using the count, page and include_rts parameters. For this particular case, I’m interested in the locations of my own account but – to stress again – you can do this for anyone else’s account, unless their account is protected and you are not a follower.
  2. The output is as various JSON files. Lacking a JSON parser, or indeed the skill, I had to do a bit of manual text processing. Those with a flexible JSON parser can therefore skip a few steps. I then merged together the files (cat *.json > combined.txt), and in a text editor, put a line break between each },{"crea and replaced ," with ,^" with the caret being an otherwise unused character.
  3. I opened up the file as a text file (not CSV!) in Excel and did a text-to-column on the caret. I then extracted three columns – the date/time, tweet text, and the first coordinates column that occurred. These were the 1st(A), 4th (D) and 28th (AB) columns. I did further find/replace and text-to-columns to remove the keys and quotes, and split the coordinates column into two columns – lat and long.
  4. I removed all the rows that didn’t have a lat/long location. Out of 3186 (14 less than 3200 due to deleted tweets) I had 268 such tweets. I also added a header row.
  5. I created a new Google Fusion Table on the Google Drive website, importing in the Excel file from the above step, and assigning the latter two columns to be a two-column location field.
  6. I marked the table as public (viewable with a link). This is necessary as Google doesn’t allow the creation of a map from a private file, except though a paid (business) account. The flip side of course is this gives Google themselves the right of access to the file contents, although I can’t imagine they are particularly interested in this one.
  7. Finally, I added a tab to the Google Fusion Table which was a map tab, and then zoomed in and around and took the screenshots below. The map is zoomable and the points clickable as normal. It should be possible to colour-code the dots by year, if the categories are set appropriately and the appropriate part of the datetime feed is reformatted appropriately in Step 3.

The whole process, including some trial-and-error, took a little over an hour – not so bad.

In the images above and below, you can see the results – 268 geolocated tweets over the course of two and a half years from my account – many of them precisely and accurately located.

tweets_nweurope

All screenshots from Google Maps.

Categories
Training

Evolving the Shoe, Evolving the Terrain

mizuno_wi9w

I occasionally receive the odd running-related press release, and got an interesting one from Mizuno recently, announcing a couple of new running shoes – the Wave Rider 16 and Wave Inspire 9 – the two being quite similar but with the latter being more of a support shoe and a fraction (10g) heavier.

The shoes look the part as you would expect, and are appropriately vividly coloured and styled – very much the trend these days, and why not – at this time of year, much of the time it’s dark when I’m running, and it makes sense to be as visible as possible.

Anyway I mention the shoes for three reasons.

Firstly I’m impressed that this is the 16th iteration of the Wave Rider shoe. Mizuno clearly know they are on to a good thing – not launching a new brand every year or so, but instead evolving a well known one. The average running shoe only lasts for 3-400 miles so a typical club runner might need to buy a new one twice a year. If the shoe is good, then the club runner will not want to change it for another brand if the old one is no longer available – they might just as easily change the manufacturer altogether, but they would much prefer to stick the name of the shoe that they know – shoes are the critical tool for a runner. So, give them what they want, and take the opportunity to refine it.

But you also need to keep new people discovering the manufacturer and brand, and also update the look to keep it looking new and relevant. So – relaunch it!

The second reason I mention is that I got a rather nice Mizuno freebie – which just happened to be a Wave Rider 15 – during the launch of an unrelated training shoe by them, earlier this year. Like the new shoes here, it wasn’t a subtle shoe – purple and lime green. When added to my red, white and blue running tops, the look is somewhat psychedelic. But it’s a very comfortable shoe and has become my current running shoe of choice. This is partly due to superstition – I started wearing my previous new shoe when I hadn’t fully recovered from an injury, and I put the resulting niggles down to the shoe and not my injury – d’oh. But it’s surprising just how superstitious you can be when it comes to injuries.

Anyway, long story short, I’ve been very pleased with my “v15” Wave Rider the last few months – I even took it to the Venice Street Race in November, although Venice was underwater at the time* so there was not much running involved, and it could well be the v16 that I end up getting next, when the current one wears out – or maybe there will even be a v17 by then? It looks like the Wave Riders will be evolving for a while yet.

The third reason is the that PR came with some photos, of runners running in the shoes, like you would expect. But the locations strongly reminded me of urban orienteering races. None of the running in the photos is taking place on roads, but instead they are along the seafront, through building courtyards, along garden paths – all the places where the best urban orienteering takes places. The campaign’s ad (short video – 30s) even includes the runner ascending some external stairs – very Barbican. You could easily imagine a control in each of these photos. In fact I very nearly doctored the photos to add one in the background. I don’t think Mizuno would have been too impressed at that though.

I’m planning a big urban orienteering race – in fact the second biggest standalone one in the world – next September. It might even be the biggest in the world next year, because the traditional incumbent, Venice, has got cancelled in 2013, after some concerns were raised during this year’s flooded race. Details of the race I’m planning will be up at the end of this month – all I can say for now is that it will have a distinctly watery feel to it. As the planner, I get to pick where the control sites go. And I’ll certainly be aiming to pick ones like the sorts shown in the photos here.

* Resulting in a rather saline shoe now. I’m not sure if it would survive a wash cycle.

mizuno_wi9m

Categories
Bike Share Conferences

Paris Workshop on Bike Sharing Systems

IMG_2856

I attended a one-day workshop last week, hosted by IFSTTAR’s GERI Animatic research group at École des Ponts ParisTech just east of Paris. The workshop was on Bicycle Sharing Systems, and as I have recently been working with a couple of colleagues, Dr Martin Zaltz-Austwick and Dr James Cheshire, on research relating to bicycle sharing data, and mapping the systems currently live in various cities around the world, I was keen to attend, particular as the agenda was packed with interesting sounding talks.

My rush-hour commute through Paris proved to be slightly more traumatic than planned (I wonder if Parisian visitors find London Underground stations as confusing as I find those on the Paris metro?) but I arrived at the École des Ponts ParisTech in time to hear the workshop organiser introducing the sessions. First up was Pierre Borgnat talking about network analysis of Lyon’s system. I had seen a paper by him on Lyon before, and the popularity and density of Lyon’s system has allowed for a rich and interesting dataset for mining and community detection. The community detection has been done using both spatial and temporal variables. Pierre’s thorough and technical treatment of the data was backed up with some excellent mapping of the data, which you can see above and below.

IMG_2859

Next up was Jon Froehlich. Jon’s talk was underpinned by a discussion of the different data sources and types available in the field. He focussed on temporal cluster analysis of the Barcelona bicycle sharing system (below) – a particularly interesting city for me as, along with London and Zurich, it is a case study for the EU project I have recently started working on, EUNOIA. Barcelona’s bicycle sharing system is not unlike London’s, in terms of its size, shape and usage characteristics – although the general downward slope of the city causes headaches for its operator. Jon gets bonus points for including not only a quote from this blog on his presentation, but Martin’s beautiful routed bike-flow animation for London, and Dr Jo Wood’s more recent bi-directional flow animation, again of London.

IMG_2887

Etienne Côme, from the hosting school, was next on, with an analysis of the biggest system (outside of China) of all – the Vélib in Paris. The Vélib is perhaps the holy grail of academic research in the field as its size, and Paris’s multiple commercial and residential zones, means that community and network analysis is likely to be eye-opening. Similar to Pierre, Etienne outlined eight detected communities, by looking at temporal variations in the origin-matrix between the 1200-odd stations on the Vélib network.

IMG_2914

After lunch, Vincent Aguilera was first on, with a switch away from bicycle sharing systems but showing some techniques that have potential for the field – Vincent looked at using mobile phone network data to detect station dwell times and true journey durations on a section of the RER metro in Paris. He compared this data with Twitter messages with appropriate hashtags (below), and the real-time running supplied by the operator on its website. The availability and structure of the cell-towers on the network allowed a direct comparison to be made – indeed, such data may actually be of better quality than that currently available at the operator’s disposal, allowing more fine-tuned operation and monitoring.

IMG_2925

Neal Lathia was next with a look at London’s system – specially effects caused by the addition of casual (i.e. non-key, non-member) availability in December 2010. The additional option did see some changes in the usages of certain docking stations. The comparison was done by clustering the network’s docking stations by time, before and after the transition, and then seeing which stations changed cluster. One of the main areas of change was in the very heart of London, around the Trafalgar Square area, suggesting a slight shift away from the (still dominating) railway station-based usage patterns.

IMG_2948

Fabio Pinelli’s talk was wide-ranging – it included system design, routing for Dublin’s (over)used system, a look at the reliability of the Vélib fleet.

IMG_2950

Finally, Francis Papon from the hosting school took a step back from the modern electronically managed bicycle sharing systems and mobile/social data sources, and looked at change in uses of urban cycling more generally. His dataset stretched over a hundred years, rather than the typically five-year maximum historical range that bicycle sharing systems have. A key trend is that in the largest French cities studied, including Paris, there is a recent (post-2000) renaissance in urban cycling usage, but this is not matched in many of the country’s smaller cities.

The workshop concluded with a general discussion of the research field to date and its direction. What was particularly interesting was that several bike sharing operators were in attendance, they were fully engaged with the academic research being carried out, asking questions but also revealing some nuggets of information about how the systems are rebalanced, relative costs of operations and why they thought some systems were more successful than others.

Hopefully there will be more such workshops in the future in Europe – with UCL CASA, Cambridge, City University London and LSHTM all involved in the field, maybe there should be one taking place in London next year?