Categories
OpenStreetMap

Plinth-O

Well, that was interesting. Slightly hijacking the concept of “art” of the fourth plinth, but good fun anyway.

I turned up, not planning to run, but ended up doing a course on Trafalgar Square in the shape of the letter “T”, as the plinther did a parallel nano-course on the plinth itself.

Here’s the Trafalgar Square and Fourth Plinth orienteering maps.

Volunteers were handing out postcards of the trafalgar square with a copy of the map and details of the Hampstead Heath race (in a couple of weeks) – great idea. There were several hundred in the square (it was Friday lunchtime on a warm and sunny day.) Congrats to Mr & Mrs Maprunner for the planning and organising, and Dadge for plinthing!

Categories
OpenStreetMap Orienteering

Bow Street Race

I organised a street orienteering event last night in Bow, East London. It was the first race of this season’s SLOW Street-O series. Nearly 40 people came along and survived the mean streets of Bow in soaring temperatures – it was nearly the hottest day of the year.

When producing the map for the race, I wanted to do something different – I wanted to finally utilise my GIS/OSM based method that I developed in my MSc dissertation last year. So, the map was based *entirely* on OpenStreetMap data, and produced in a GIS rather than a cartography or graphics package. Nothing was added to the map that isn’t in the OpenStreetMap database, so future street orienteering maps of the area that use the same technique will be at least as good, or better, as the wider OSM community continues to improve the mapping of the areas.
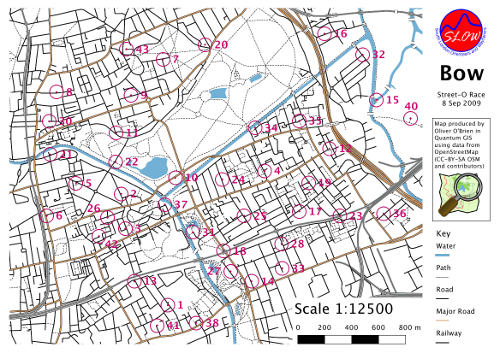
bowmap

The GIS used was Quantum GIS. I used a pre-release version, 1.2.0, although the current “unstable” 1.1.0 release should work the same for these purposes. A patch was applied, to cap the ends of thick line strokes to the true extent of the line, rather than them extending slightly out which is the default.

During the creation of the map (which was in Quantum GIS’s buggy but full-featured Print Composer function) I created a number of style templates, representing standard street orienteering map symbology. I hope to have these available for download soon.

The process in creating the map was:

  • Friday – investigating how complete and accurate the OpenStreetMap data of the area is, by comparing with satellite imagery and other sources.
  • Saturday and Sunday afternoons – two long and windy cycles through various housing estates and down alleyways and streets, to record GPS tracks of missing streets.
  • Saturday and Sunday evenings – adding in the detail to the OSM database, based on the GPS data and my notes. Also building Quantum GIS.
  • Monday afternoon – identifying possible locations for controls.
  • Monday early evening – a cycle around half the control points to confirm the questions and answers.
  • Monday late evening – creating, styling and adorning the draft map in Quantum GIS.
  • Tuesday morning – cycling around the remaining control points.
  • Tuesday lunchtime – assembling the final map, checking for any generalisation needed, fine-tuning the control location “dots” and printing.
  • Tuesday evening – the race!

You can download the vector-based PDF of the map here (1MB), and the questions here if you fancy doing the race in your own time (or virtually on Google Street View – many of the answers are visible on it.)

Comments from runners were generally positive – one spotted a road that wasn’t accessible, and the 1:12500 scale made the map quite cluttered. One key underpass under a railway was missed by someone. The simple cartography in Quantum GIS means, for example, black dashed lines can’t be forced to have a black segment at each end. There were more issues with interpretations of the questions than with the map itself.

No one got all of the controls in the hour, and they weren’t supposed to – with 41 controls spread right across the map, this would have been impossible to do. The top score was 550 points, out of a maximum of 800.

Categories
OpenStreetMap Orienteering

How to cycle for 25 miles without leaving the neighborhood

Here’s the GPS trace for a bike ride I did on Saturday:

capture

It’s 25 miles long, but never I’m never more than a mile from the Bow Wharf complex.

Why? I’m organising a street orienteering race (“Street-O”) for Tuesday evening, and the map will be based entirely on OpenStreetMap data – probably the first time OSM data has been used for an orienteering map for a real race.

The cycle was to find as many missing roads, paths and alleyways as possible to try and make the map complete. Bow has a large number of social housing estates and some of these are a real rabbit warren of alleys.

The ways were then drawn in to the map, using Potlatch, and then the data was downloaded, converted using the script I developed for my MSc dissertation last year, and added into a custom build of Quantum GIS. The map was then “composed”, with adornments (scale bar, legend) added, and a PDF created. Because it’s a GIS, the map already knows its scale and the colours used in its symbology, so adding the scale bar and legend is just a case of selecting the area of the map you want the adornment to go on. Quantum GIS’s cartography isn’t perfect though – line capping is problematic, but it will do for tomorrow’s purposes.

The result will be seen, and hopefully used, by everyone who turns up for the event at the Royal Inn on the Park tomorrow evening. Come along if you can! The weather is looking good.

It’s good to finally put into practice the technique I outlined in the dissertation. I will post a couple of excerpts soon to this blog – namely the bits of the dissertation I referred to when creating the final map last night.

Categories
Conferences Mashups OpenLayers OpenStreetMap

Education Profiling with an Open Source Geostack

I was in Manchester yesterday for the first day of the Royal Geographical Society annual conference. I gave a talk at the session called “New Urban Geography: Evolving Area Classification for Socio-Spatial Generalisation” which was convened by my boss Dr Alex Singleton and chaired by Prof Paul Longley, both also of the Department of Geography here at UCL.

My talk discussed a Web 2.0-style mashup of English school attainment and geodemographic data, which has been put together as an online “atlas” using OpenStreetMap data as a contextual layer, Mapnik to produce the graphics and OpenLayers to display them. The atlas is not yet complete, and the data is a little old, so it’s not being widely promoted yet, but if you are really keen on visiting it yourself you can find the URL by looking carefully in the presentation…

It is here.

[slideshare id=1914330&doc=openlayersandmapnik-090827073034-phpapp01]

Categories
OpenStreetMap

OSM gets Isle of Man Government Data

Dan Karran writes that he has received an official, recent (2007) dataset from the Isle of Man government, comprising of a 1:25000 raster with tourist points of interest (POIs), and detailed satellite imagery from 2001, with a licence suitable for tracing into OpenStreetMap. This is great for OpenStreetMap and for the Isle of Man. Although the data doesn’t include individual house shapes, and other fine detail that wouldn’t be on a 1:25000 map, it does allow for complete coverage of the island with a level of detail suitable for routing, POI-finding and landuse mapping.

Now, if the Ordnance Survey could be persuaded to do the same thing for a test area in Great Britain, such as Caithness?

Categories
OpenStreetMap Orienteering

Street-O and Plaques

Street-O runners who read this blog may be interested in the most recent posting on my research blog.

Categories
OpenStreetMap

OpenStreetMap Road Coverage in England

Peter Reed has been doing some excellent work comparing the Department of Transport measured road lengths by English county, and comparing them with the total lengths of roads in OpenStreetMap.

This has only recently become possible to do with spatial data purely in OpenStreetMap, because the English counties have now been completely added to the project. This last step was harder than it might seem because there is no freely available definitive source for boundaries in the UK (which is just plain odd.) Instead, it was necessary to use a combination of local knowledge, examining signs and council objects on the ground, and trace from out-of-copyright maps, to form the boundaries.

Peter’s choropleth map is excellent and deserves a wider audience, here is a smaller version of it (click through to see the large version, which may also have been since updated.)

osmcoverthumbChoropleth of OSM road coverage vs Department of Transport figures, by Peter Reed.

It is encouraging to see many areas at nearly (or over) 100% coverage, there are a number of reasons why coverage might be more than the Department’s own figures, due to more up-to-date information, counting of slip roads, and mis-tagging private roads as public on OSM, so the map’s figures should be taken with a pinch of salt.

The Welsh and Scottish county boundaries are not yet complete in OpenStreetMap so the coverage analysis cannot yet be completed.

Muki has also (with a student) done OSM road coverage analysis, using equal area blocks rather than county-based units.

Categories
OpenStreetMap

Mapping Party and Mapzen Sneak Peek!

The next London mapping party is on Thursday evening, in Mayfair, the really posh bit of central London (you can tell its posh as it only has one bus route going through it.) See here for details and to signup.

What’s special about this one is that Cloudmade’s in-development mapping editor, Mapzen, might be being demoed. The screenshots look very interesting, this could be pretty cool.

Categories
OpenStreetMap

Map Cake

One of my favourite bits from the State of the Map conference last weekend was when they bought out the cakes:

sotmcake

If you are familiar with London’s geographical layout, you might recognise the big green blob on the cake on the right as being Regent’s Park. I think my slice ended up being part of the waterfront in Amsterdam.

A random event? Not quite. When mapping parties are being organised, the most efficient way to ensure that the area in question gets good coverage from the different mappers on the day, is to look at the existing map and divide it up into sectors – mappers then bag one or more sectors that they will concentrate on. Such a map is known as a “cake” and each of the sectors are known as “slices”.

An an example, here’s the mapping party “cake” for the next London mini-mapping party that’s being held on Thursday evening, collecting POIs around King’s Road in the west of the city:

2, 4, 11 and 12 are alreay nabbed. If you fancy a slice, put your name down on the wiki page and then get mapping on Thursday evening!

Categories
Conferences OpenStreetMap

State of the Map 2009 Review

sotmcrowds

Just back from StateOfTheMap, the OpenStreetMap community’s international conference. I missed the first two conferences but made it along to this year’s in Amsterdam. I skipped the “business day” on Friday and joined the conference for the Saturday and Sunday, when it reverts to being a community conference.

My favourite talks were:

  • Andy Allan showing off some advance cartographic techniques that make “other” maps beautiful and how we could apply them to OpenStreetMap’s default renders.
  • Muki Haklay’s talk on measuring data quality and completeness – turning the “unknown unknowns” into “known unknowns” is something that is becoming increasingly important as the community starts to “market” its data to a wider audience.
  • Mike Miguski’s Walking Papers was very well received and is a brilliant way to make mapping POIs and simple areas easier, without using a GPS. He also showed off some of the lovely looking Stamen map designs.
  • Richard Fairhurst’s lightning talk on Potlatch. Some people might have tried Potlatch a year back, thought “urgh” and gone back to JOSM, but the editor has come a long way recently. Version 1.1, released last week, allows drag-and-drop placement of POIs. Version 2.0 is also on the roadmap and promises a closer look to the Mapnik “default render”.
  • The “State of Japan” talk, while not revealing anything particularly innovative, was very funny and well presented – a simple “nice picture, map before, map after” sequence of slides for each of several shrines and castles in the country. The mapping is very high quality too and shows that OpenStreetMap is more about streets. As an aside, there seems to be a bit of an international “contest” to get the most detailed zoo mapped on OSM at the moment. Amsterdam’s zoo has the individual cages on it, as do several others. London’s is way behind, don’t even have the perimeter on yet.
  • Some of the international lightning talks, from people who had won scholarships from far-off places to come to the conference, were great. I particularly liked Abdel Hassan’s talk about OpenStreetMap in Cairo. GPS receivers have only been legal in Egypt since March!
  • Jorgen Topf’s primer on “proper” GIS and using OpenStreetMap data with it. A topic which the OSM community needs to know more about! It was only the tip of the iceberg, although there’s only so much you can say in 15 minutes.
  • Martin Lucas-Smith’s CycleStreets – attractive looking solution and with a good routing engine that will only get better as the data gets more complete.
  • There was a talk on browser-based rendering of OSM data, which looked pretty exciting.

It was also interesting, for me, to be able to compare with the OSGIS UK conference I also went to, last month.

What I liked more about StateOfTheMap was:

  • This was far and away the most social conference I’ve ever been to. Admittedly already knowing quite a few of the delegates, thanks to UK mapping parties and the London mapping marathon pub trips, helped break the ice, as did being in a city like Amsterdam which naturally lends itself to post-conference relaxing at a canal-side venue. Being stuck in a Travelodge on the edge of a town in the Midlands, or in a modern university campus when the students aren’t around, is never going to have the same opportunities.
  • The full-scale use of technology – not really surprising for a conference by a technology community of course, but it was good to see it being used well, e.g. the Twitter Wall on one of the big TV screens.
  • The conference venue was really nice! New, bright, colourful, with a view of the city. Very Web 2.0. The food and drinks were also excellent. The catering staff even got invited onto the stage at the closing session to be thanked for their good work.

What I liked about OSGIS UK more was:

  • The talks were more consistently high quality. SoTM’s talks were very variable in quality, some of them needed hooking off the stage with a walking stick!
  • All the speakers turned up to speak. Sounds obvious really, but at least two of the SoTM talks were skipped due to speakers not being present. Particularly disappointing was that one of them was the talk I was most looking forward to (about Processing.)

Noticeable about both conferences was:

  • More people than I expected from the big commercial players in the field, despite them in some ways being “rivals” to the concept of open source and OpenStreetMap.
  • Presentations were always short – never longer than 30 minutes and frequently never longer than 15 minutes (or 10 minutes in the case of the “State of Country X” talks, or even 5 minutes for the lightning talks). Even the keynotes were short. This is, by the way, a Good Thing.

sotmcopters