Categories
OpenStreetMap Orienteering

Minor Tweaks

Some small updates to OpenOrienteeringMap:

  • Where trams run on or very near roads, they are now shown as being underneath the road. For the Street-O map, this means they are partially or completely obscured. On the Pseud-O map, a set of square dots shows where the tram goes. This stops the tram line from obscuring the (passable) road.
    oomtrams
  • Hedges are now drawn underneath the road layer, so they no longer obscure passable roads.
    oomhedges
  • Paths and tracks in tunnels (e.g. in shopping centres) are now shown on the Street-O map – previously they only appeared on Pseud-O.
Categories
Conferences Data Graphics OpenStreetMap

Season’s Greetings

2010 promises to be a very exciting year for GIS, neo-geography and information visualisation.

Potentially one of the most interesting events that may happen next year is a big shift on access to mapping data in the UK. Yesterday, the Communities and Local Government Department (CLG) published the consultation paper for opening up Ordnance Survey data. The consultation is open until March.

Also in March is the first Wherecamp EU, right here in London. I’ve looked on enviously as the neo-geos and proto-geos do cool things with spatial data over in the States at Wherecamp, and its associated “regular” conference Where 2.0. Now we get to do the same!

Geomob’s next evening, at my alma mater City University in January, has an interesting lineup of speakers, possibly including the author of Information is Beautiful – the UK edition of which is out shortly after in February.

This year was pretty amazing for opening up access to data – there’s a lot of it out there, now we just need to visualise it. Here are some lovely examples.

Finally, the British Library is putting on a major exhibition of historic maps from April – Magnificant Maps, which will include the largest book in the world – six feet high apparently. I saw their “London: A Life in Maps” exhibition back in 2007 and was highly impressed. They have an impressive collection and I look forward to seeing next year’s exhibition.

Season’s greetings!


Bauble from the OpenStreetMap Wiki

Categories
OpenStreetMap Orienteering

Five Favourites in OpenOrienteeringMap

Categories
OpenLayers OpenStreetMap

On-The-Fly Mapping Preview

oom1

A public preview of the on-the-fly mapping that is being used for the CensusGIV project is available at OpenOrienteeringMap (OOM).

The same mechanism that will be used to produce the varied choropleth maps of census data is being used to produce the “Street-O” and “Pseud-O” maps on OOM. The main differences are that the map image files, or tiles, are more aggressively cached – as there’s only two maps rather than millions – and the designs are in an XML file rather than being specified on the URL, as they are much more complex than simple thematic choropleth maps.

oom4

Further details of the construction are in a posting and information page on my personal blog.

Top: “Pseud-O” map of Furzton district in Milton Keynes. Bottom: Edinburgh Old Town “Street-O” map.

Categories
OpenStreetMap Orienteering

OpenOrienteeringMap

oom1

With the OpenStreetMap spatial dataset of the world, and the excellent map rendering toolkit Mapnik, it’s quite straightforward to make theme-based maps, such as OpenCycleMap, OpenPisteMap, OpenHikingMap and OpenWhitewaterMap.

All very well, but what about orienteering maps? So, here is OpenOrienteeringMap. For the moment, it just covers the UK, but there’s no particular reason why this couldn’t be extended to cover the world (except that the postcode-finder only works in the UK). [Update – it now covers almost the whole world!]

The map is created on-the-fly, using a process developed by the OSM community that I’ve built on for my day job at UCL. The map is created on a quite fast computer, but because it is created on-demand for areas people haven’t visited before, it may run slow if a few people are looking at it at once – and you’ll need a fast internet connection as the map is delivered as PNGs.

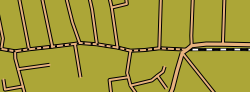
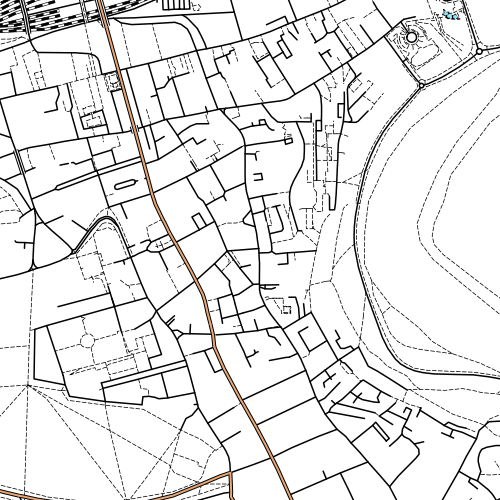
There are two styles – Street-O and Pseud-O.

Street-O

This attempts to recreate the “minimalistic” feel of street-O maps, as used for informal street events in London by the central clubs SLOW and LOK, and in other areas around the UK. Only roads, tracks, paths, rivers/lakes and railways are shown, the maps are high-contrast (black on white) and have little colour. The few colours that are on the map – for major roads and water features – are the “official” ISOM standard colours for these features.

OpenStreetMap data has been used for one street-O before – my Bow race in September, although here the data was pulled into Quantum GIS and a vector-based PDF was produced, allowing maps to be printed at high resolution.
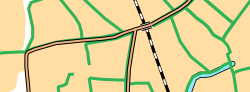
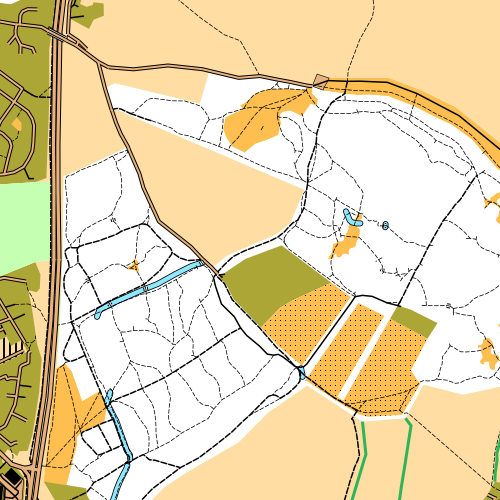
oom4

Pseud-O

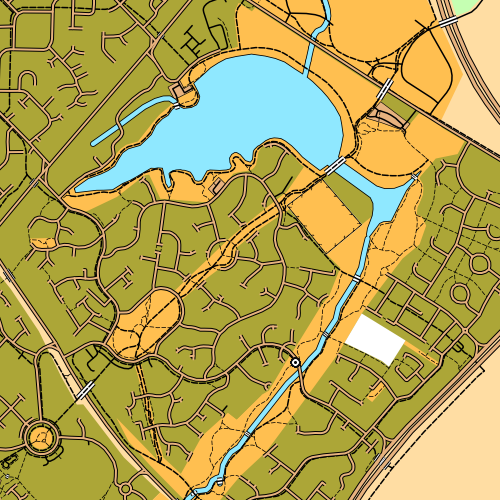
This is a less standard but richer map. It uses many more features in the OSM data, where they correspond to regular orienteering features. OSM data, for ~99.999% of areas, is not detailed enough to correspond to that on an ISOM map, but it might be sufficient for basic urban orienteering events in a few places, or the odd trail challenge. As the OpenStreetMap dataset continues to be added to and enhanced by its contributors, so the orienteering map will increase in complexity and accuracy. Again, the colours are as officially defined in ISOM. For now, it’s fun to look at the whole of the UK with the ISOM look-and-feel, but let’s not run any serious events with the map! (More on ISOM orienteering maps and OSM.)

oom2

The postcode finder uses the c. 70000 postcodes supplied by NPEMap (with contributions from FreeThePostCode and the postbox locator project) so should get you to within a mile or two of where you want to be, in urban areas.

Explore the map and let me know about any big problems with the cartography or functionality via the comments here. I’m not interested in missing data complaints for an area though – OSM is a project produced by the efforts of volunteers, so if your area is blank, it’s because there isn’t an interested local. So go and map the area yourself, and add it to OpenStreetMap so the whole world benefits (and let me know so I pull in the updated dataset!)

oom3

More information about how the map is made is here.

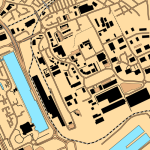
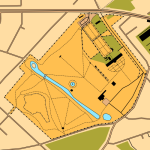
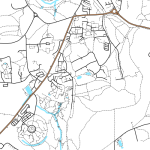
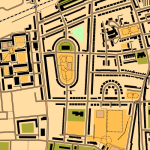
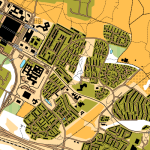
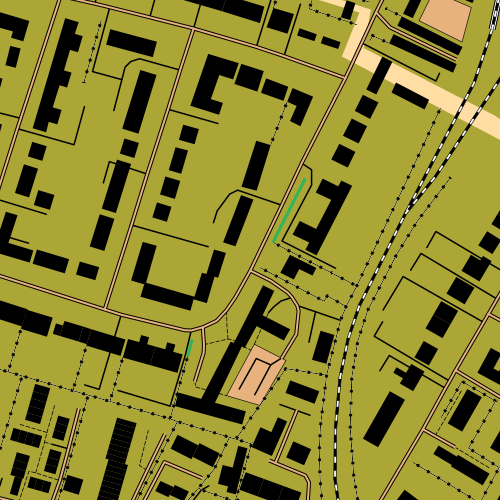
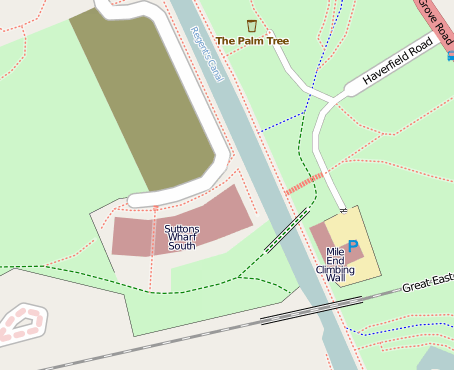
Top: Good to see the efforts of the Milton Keynes mapping party I organised in May make it to an orienteering map. Upper Middle: Edinburgh’s Old Town. Lower Middle: Shotover Wood, near Oxford. Bottom: Great detail in Putney, thanks to an enthusiastic local contributor in the area.

Categories
Data Graphics Mashups OpenLayers OpenStreetMap

CensusGIV Prototype Presentation for CASA

My boss (Dr Pablo Mateos) and I gave this presentation today as part of this term’s CASA Seminar series here at UCL. My bit starts at slide 22 (of 60! – we just about managed it in the hour but only by rushing at the end.)

chorogen
CensusGIV – Geographic Information Visualisation of Census Data

View more documents from oliverobrien.

Note that the censusprofiler site mentioned a couple of times in the presentation only has a (very out of date) blog on it at the moment, and the prototype itself is not yet available for general use – with luck, an alpha version will be available to play with by the end of the year.

Categories
OpenStreetMap

Google Maps – Nearly Alright

There’s been some discussion about the large number of small-scale mistakes present in Google Maps – there were always a few, but that number has increased dramatically recently as Google has included new sets of POIs.

What I find is that the map looks pretty good if you just need to drive around an area, but once you zoom and study it in detail, the bugs appear. Of course, if you don’t know the area, you probably aren’t going to notice the problems unless you really go looking for them, so perhaps it’s still “fit for purpose”.

My local area (pretty close to central London, not somewhere random in the countryside) has some real howlers – but then, people driving through aren’t going to notice:

googlemaps1

Never mind, OpenStreetMap to the rescue:
osm1

For me, it’s particularly pleasing that OpenStreetMap is now becoming more accurate than Google Maps in these respects, rather than just catching up – as long as there’s a keen local contributor in each area. Adding simple (POI) data to OSM still isn’t quite as easy as it could be, although it’s much improved with recent Potlatch updates, and Mapzen looks like it could make the process easier still.

Categories
OpenStreetMap

Meath Bridge Opening

meathopening1

So, the Regent’s Canal has a new bridge across it – the Meath Bridge, connecting Meath Gardens in Bethnal Green, to Mile End Park in Bow, opened this morning. It was built partly with funds from the Sustrans Connect2 award – as one of the 70 or so projects in the scheme, that won the BIG Lottery fund TV competition at the end of 2007.

The bridge isn’t quite as useful as it could be, as an east-west link, because both the approaches to it are from a northerly direction – the eastern access ramp curves north to avoid the access road to Mile End Climbing Wall, and the western access ramp curves slightly north to avoid the new housing development on the south side of Meath Gardens. In fact it’s probably most useful for getting from Stepney Green to Victoria Park (i.e. a SW-NE link). Still, it’s a nice crossing to have, and in orienteering terms is particularly exciting, because it will allow future orienteering events in Mile End Park to easily include Meath Gardens, significantly increasing the “green” area of the map. Now, if only the link under the railway bridge to Queen Mary University could be opened…

Of course, the bridge is now on OpenStreetMap:
meathbridgeosm

Let’s see how many months/years it takes before the bridge appears on Google Maps, Ordnance Survey mapping, or even Sustrans’ own map.

meathbridge2

Categories
OpenStreetMap

Static Street-O Routemaps with OSM

Here’s a map showing my route around the streets of Chelsea and Battersea at last night’s SLOW street-race:

My GPS didn’t acquire a good signal for the first couple of km, so I recreated my route using the following:

  1. Using Bike Route Toaster I drew my course out. Important – the Data setting *must* be first set to “OSM”, to ensure you don’t inadvertently introduce copyrighted mapping data to the OSM project. You will probably also want to set the By setting to “Foot”, the map view at the top to “Street”, and toggle on/off the Auto-Routing option when you encounter paths not on the map.
  2. I then downloaded it as a GPX file, using the link on the website in the Download panel.
  3. I uploaded the GPX file as a trace into the OpenStreetMap project’s website (you need to be logged in to do this) and marked it as a public trace. The resulting tracklog number was noted down.
  4. I went to OJW’s Static Maps website and set up the map, panning, zooming and resizing it as appropriate, entering the tracklog number, and adding a point to show the start/finish.
  5. I copied the resulting image URL onto my website. As it’s just an image, no fiddling around with Javascript is needed.
  6. One caveat is that the trackpoints only appear where you pass junctions or other nodes on the OSM mapping data – the Static Maps process doesn’t join the dots.

    An easier process is to use the OSM WordPress plugin – if you have it, and WordPress, and don’t mind having a dynamic map in your post:

    [osm_map lat=”51.483″ long=”-0.163″ zoom=”14″ width=”420″ height=”500″ marker=”51.49,-0.151″ gpx_file=”/files/2009/10/542876.gpx” marker_name=”camping.png” type=”OS1″]
     
    (N.B. I’ve hacked the plugin to pull in map images from the new OOC OSM server of historic Ordnance Survey maps.)

Categories
OpenStreetMap

High Resolution Historical OS Maps now in OSM

campbeltown

[Updated] – Steve Chilton (designer-in-chief of the “standard” OpenStreetMap map) has announced the first Ordnance Survey 7th Series 1:50000 map scans are now available for tracing on to OpenStreetMap. The first ones available are in the south-west of Scotland. Further details of the project area are here.

On the right is what Girvan, a town in Ayrshire and Galloway, looks like in OpenStreetMap currently. Below that is what the 7th series imagery offers – and, bottom, the modern-day Google mapping data. This shows that, for even some sizeable towns, a 50-year-old map still has a lot to offer to enrich OpenStreetMap.

The scans have been reprojected into the “Spherical Mercator” format so they can be used in Potlatch – OpenStreetMap’s main online editor. They build on the New Popular Edition maps, which have been reprojected in England and Wales, but not Scotland so far, allowing OSM contributors to add features from the maps into the project.

Because the maps are (just) over 50 years old, their Crown Copyright has expired, which is why they can now be included in the project. Unfortunately many of the 7th series maps were printed in the early 1960s, so we’ll have to wait a few more years for these to come out of copyright and Scotland be fully covered. It would be lovely of course if the OS were to waive the copyright on these…

The maps can be seen directly here – the quality of the imagery is excellent, as can be seen in the screenshot above. Incidentally, the tilt of the grid squares is very noticeable here – the angle between grid and “true” north is quite pronounced in west Scotland.

[Update – The NPE, OS 7th Edition mentioned here, and a small number of 1:25000 OS 1st Edition maps can be directly compared on the new OOC map.]