Categories
Bike Share

Where Might Bikeshare Succeed in Great Britain?

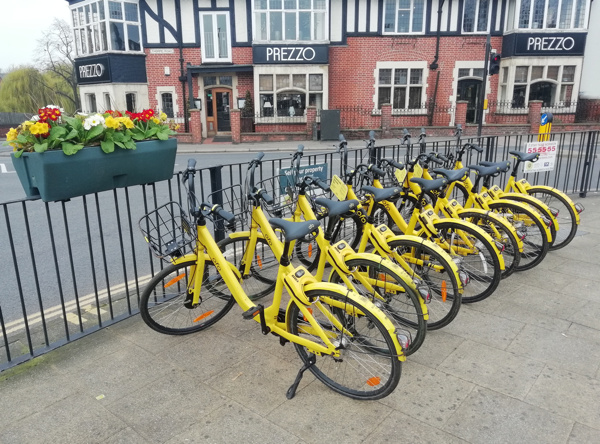
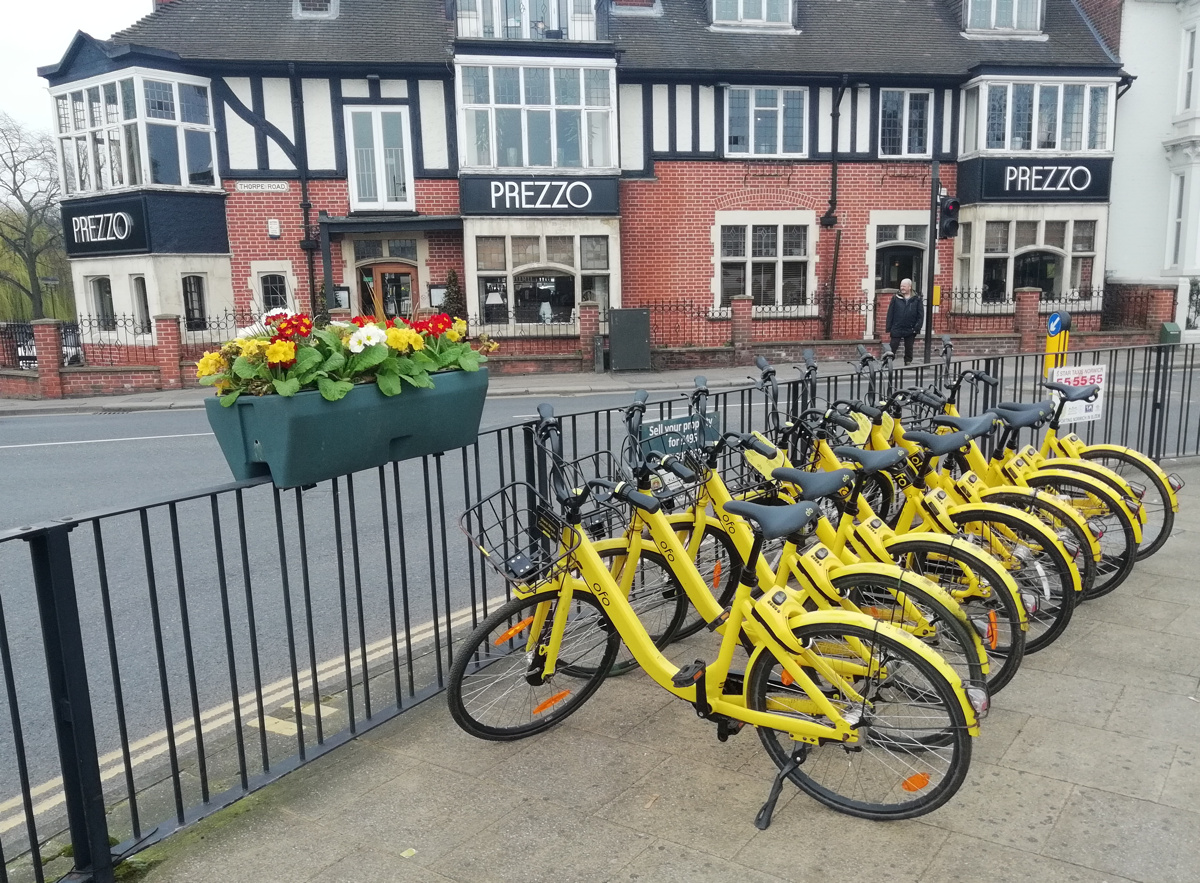
There’s lots of bikeshare systems in the UK now. As well as the third generation dock-based bikeshare systems, fourth generation dockless (and hybrid) systems are starting to appear on various streets around the country, led by Mobike, Ofo and Urbo, three dockless providers and operators.

I’ve put together this simple model to try and understand where systems are most likely to be successful, for which I’m defining as a lot of (legal) journeys made with each bike placed by the operator. To do this, I split the country into its local authorities, apply three scores, and then multiply them together to produce an overall “propensity for bikeshare”, or PFB score (the name is a nod to PCT.bike from Lovelace et al) which can then be ranked.

Many mid-sized cities in the UK have their own local authority, approximately covering the urban area, while Manchester and London are split into multiple LAs. Conversely, some LAs individually cover multiple smaller towns/cities and large rural areas too. Hence, this is a very simply model which is not going to be completely fair to every urban area (Stirling, in particular, gets pushed well down the rankings as its LA includes a huge rural area). Still, for most of Great Britain, it produces results I would anticipate and is a good start towards potentially developing a more sophisticated model. The local authority geography is also appropriate, as local authorities act as the gatekeepers for which access is negotiated (for systems which pay themselves) or as authors of bids for subsidised systems.

Model Inputs

For this first, simple model, my three compounding factors are:

  1. Residential and workplace population density – on the assumption that bikeshare systems need a critical mass of people passing by their bikes/hubs/docks, in order to be seen and used sufficiently frequently to justify the costs of equipment/maintenance, on the basis that a major source of income is per-use fees. Both residential and workplaces populations are used, as people have journey opportunities that can be facilited with bikeshare, both from their office (e.g. lunchtime errands, commute to evening socialising or back home) as well as their home location.
  2. Proportion of people who already commute by bicycle, again looking at both workplace location and residential location (bearing in mind that many commute journeys, particularly in London, cross local authority boundaries). While such people are less likely to convert to bikeshare, as they already have a means of cycling, their presence on the streets and associated culture and facilities (e.g. bike coffee shops, marked cycle routes or existing cycle-friendly infrastructure) help normalise the idea that cycling is a possible option for a journey need.
  3. Vandalism rate – theft and criminal damage to bikeshare bikes happens and it is an expensive one for the operators. It can be what causes systems to fail – particularly if they run out of bikes, or broken bikes litter the landscape and turn public opinion against the concept. While the dock-based systems are less vulnerable to this, as the bike is either securely locked to a clamp or in the hands of a paying user, dockless bikes are particularly vulnerable to vandalism, as they are not secured to immoveable objects, and their locks are, unfortunately, relatively easy to break by a determined offender looking for a free bike. The tendencies for vandalism of property that is not yours does vary significantly around Great Britain, while stereotypically it is likely to be more urban areas and areas with a younger and less educated population that is more likely to vandalise, using actual crime data on vandalism allows a more nuanced approach to be taken. Other crime classes (e.g. theft) were also considered for this model, but I think that vandalism rates act as a good proxy for how the local population around a bikeshare system will “care” for it or abuse it.

I have not included the absolute populations of local authorities in the calculation, as in general, with one exception (Isle of Scilly), LAs all have a significant night and/or day population, so they are all large enough to have a self-contained system. Another obvious factor, hilliness, is likely already correlated with proportion of cycling commuters and so is not included. N.I. is excluded from the model for now. Data sources include the latest police crime statistics (with populated-weighted averaging when across multiple LAs), and census data.

Results: Propensity for Bikeshare by Local Authority

Here are the results of the model run. Clicking an underlined title takes you to the main bikeshare for that area – forthcoming systems in brackets.

Some notes:

  • London boroughs score consistently highly, and even London as a whole, which is interesting as outer London is anecdotally not known as a particularly cycling-friendly place. Considering the size of the city, and the intimidating conditions cyclists often have to put up with in much of the capital, it is great to see it scoring so highly here.
  • Bikeshare operators are doing their homework and generally, the top end of the list is already well populated with bikeshare systems, in some cases multiple systems are competing.
  • The top local authorities without a bikeshare system (operating, announced or consulting) are Haringey, a north-London inner-city borough which has been surprisingly quiet until now, and Merton, an affluent outer London borough to the south. Oustide of London, the highest ranking areas without a bikeshare are Portsmouth (small system launching this summer), Gosport (neighbouring), Gloucester, Poole, Worcester and Hull. With the exception of Hull, these are all southern English urban areas, with generally affluent populations and some established cycling culture.

See also my London borough bikeshare scorecard.

Categories
Reviews

Huawei P Smart Review

Through The Insiders I recently received a Huawei P Smart smartphone at a special rate. Here’s a review of it and some notes, a couple of weeks in:

The Huawei P Smart is a new “budget” phone launched by Huawei in the UK in early 2018, around the same time as its premium featured/priced P20 range, but an attractive price-point (£230 list price, in practice around £200) compared with £600+ for the P20 series.

The transfer process was straightforward. First I made sure my Whatsapp history was auto-backed up to Google Drive, then I simply removed my current SIM, snapped out the Nano shape and put it in the new phone, transferring my SD memory card at the same time. I then installed Phone Clone on both phones, the app creating a phone-to-phone network and then copying all applications

The Good

  • Comes in a nice compact Apple-style white box.
  • The fingerprint unlock mechanism is simple to set up and works very well.
  • The phone is a really nice physical design, with a curved edge and nice, black back with thin two metal bars to add a nice bit of styling. The logo is the bottom rather than the top, which is a bit weird but I’m getting used to it there.
  • Comes with USB Micro socket for charging, and a nice compact charger with a pop-up third pin. USB Micro cables/chargers are widely available so it’s good to have this as the charging solution rather than the still rare USB C.
  • Quite quick to charge – around 3 hours from empty to 100%.
  • Comes part charged (~60%) out of the box.
  • Comes with a decent looking pair of headphones, and a regular headphone socket.
  • Takes nano SIMs and Micro SD card on the same slideout tray
  • The screen is lovely and sharp.
  • Both front and rear cameras take excellent, sharp photos (see the examples above and below).
  • The “Bokeh” effect, while not being perfect (see grumble below) produces really nice “portrait” photos, as long as you have the distance right and good lighting conditions. A great example is a photo I took of a colleague above.
  • Comes with Android v8 which is a great UI and well designed, with an improved permissions request mechanism and more UI consistency.
  • Definitely a lot snappier than my Ascend G7 was, with the same number of apps loaded/open.
  • Not too many “junk” apps installed on it.
  • Nice auto-switch between mobile network data and Wifi data. One of my perenial annoyances was where I would auto-connect to a Wifi network and then not get data as I was not logged into it. Now, it will just switch back to the mobile data without me needing to disconnect the Wifi manually. Conversely, it will also auto-connect to new open Wifi networks it finds, seamlessly, for saving on mobile data usage limits.
  • Only a single speaker – but this a good thing, phones are juke-boxes to irritate near people with, the speaker should just be for ringing, or use the nice stereo headphones.

The Bad

  • It only lasted about 30 hours between its first charge to 100%, and being empty, with “normal use” (no videos). I was hoping it would manage to go 2 days and 1 night without a charge, at least for its first year, like the Huawei Ascend G7 it is replacing. Since then, it’s done a little better. With light use it will manage a couple of days. But if you spend a day at an event (e.g. wedding reception), taking lots of photos and maybe using the map a few times, it will be out of power before the end of the day.
  • This is the first Huawei “budget” phone to have dual back cameras for simulating low F Number effects (allowing for blurring of background detail while bringing the only subject into sharp focus). This works quite well but is not perfect – perhaps because the second camera, which is calculating the depth of field, is low-resolution (2MP). So, it doesn’t quite get the blur/not blur boundary quite right.
  • It is also not obvious how to start using this feature. Basically, it is activated by using the Portrait mode.
  • Photo processing tends to aggressively sharpen images, causing a halo effect for certain shots.
  • The system occasionally pauses/hangs for a few seconds, e.g. when reopening Google Maps, or going from standby to taking a photo with the camera. It’s something that my older phone did all the time, but I was hoping that this newer one would never suffer these pauses.
  • In the default keyboard, the space bar has been shifted slightly to the right. This means I keep hitting the new Emoji button which is in the middle-left, where the space bar used to extend to, and so keep putting in Emojis when I was just hoping to have a space…
  • Out of the box, the system uses 7GB of space, so you have 7GB less to play with, than is written on the box (so 25GB rather than 32GB in my case). Slightly confusingly, the space is called “ROM” on the box, which I always thought was Read Only Memory. These days its referring to the solid-state internal memory space for storing files/photos.

Conclusion: It’s not perfect, but for £200 SIM-free this is an excellent smartphone, well built, powerful and with some good premium features. Just be prepared to watch that battery, and be patient when waking it.

Categories
Bike Share

Bikeshare Docking Station Data Release

My research lab, the Consumer Data Research Centre, is making available much of the docking station empty/full observation data that I have been collecting, at frequent intervals (up to every 2 minutes) for generally the last 5 to 8 years, for over 50 cities around the world, to facilitate and encourage further quantitative research in the field. I already get numerous requests for this data – it is very interesting for all kinds of research projects, particularly because of it spans multiple years, so introducing this new mechanism is a good way to manage these requests. You can see the cities listed at the CDRC Data product page.

For three cities (Cork, Limerick and Galway in Ireland) we have directly attached the data to the record page. It is the data that has been collected up to the point that the record was published a few days ago, and on request we will reload the data, capturing more recent observations.

For the other cities, the data record is “Safeguarded”. This is because the logistics and technical limitations of attaching the very large amount of data to the records. Namely, it takes quite a lot of time to prepare each dataset for download, and the platform we are using is not designed for hosting extremely large files – plus, it is likely that researchers would want the most up-to-date data, meaning that we would need to build a mechanism to update the record regularly. Using an application process also minimises spurious requests – we have invested time both in collecting the data and processing it, so we need to be confident that it will be used. Additionally, some systems (particularly those in the USA) come with their own data licence restrictions from the operating companies meaning that we cannot freely distribute the “raw” data. In Europe, most of the datasets are explicitly open, meaning use of the data is unrestricted (although normally requiring attribution). the Irish cities listed above have a slightly more restrictive licence, requiring us to distribute it on the same terms, which we have done.

The data is available on application to interested institutional researchers. In practice, this means academic, public sector and non-profit organisations who which to carry out public/publishable research with the data. Application details are attached to each record.

Above and below are simple graphs produced from the data for various cities. I have looked at the number of bikes available every day at around midnight and plotted it on a simple graph against time.

Access the data here.

Stay tuned because I am planning on releasing two further “data portals” of bikeshare data, soon. These are slightly more manageable in terms of file size and administration, so I am aiming for these to be directly downloadable.