Categories
Bike Share Data Graphics London OpenStreetMap

Boris Bikes Flow Video – Now with Better Curves!

Dr Martin Austwick and I have produced an updated version of the animation of Barclays Cycle Hire bikes on a typical weekday:

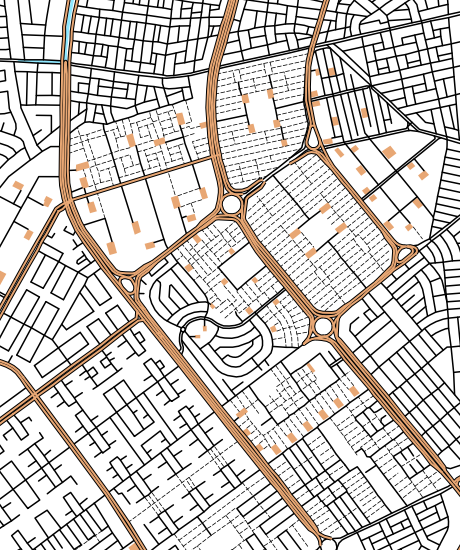
Martin has once again done some programming magic to show the River Thames, Hyde Park/Kensington Gardens and Regent’s Park to add context, plus the trails for the bike “motes” are longer, allowing the road network to be picked out more easily – and the network lines remain as faint “ghosting” in the video. The bikes are also more blue! Although the bridges aren’t specifically marked, their locations quickly become obvious from the volume of bikes crossing them.

I’ve redone the routing, to fix a few problems around Trafalgar Square and a couple of other obvious places. As before, the routing is done using OpenStreetMap data and the Routino routing scripts, optimised for bike usage (i.e constant speeds on all road types, obeying one-way roads and taking advantage of marked cycleways.) I’ve tweaked the desireability of road types, so that trunk and primary roads are now only slightly less desirable than quieter routes. The traffic in most parts of central London is so slow that, based on my own observations, such roads are not such a significant deterrent to cycling. As before, I’m assuming the bikes go along the “best” route, I don’t know where they actually went. Hires that start and end at the same point – popular in Hyde Park – are shown with the motes spinning around the point.

I’ve also included road curves this time. This means bikes don’t go in straight lines between junctions. This was particularly noticeable when they cut the corner of the Thames in the last animation! Watch the bikes as they carefully curve around the kinks of West Carriage Drive in Hyde Park, around the graceful arcs of Regent Street and Aldwych and along the Victoria Embankment. (I don’t think there are many other classic curves in the central London area?)

Expand the video to full-screen, and, if your connection can take it, click the HD button to get a higher-quality with even bluer bikes!

The data for the bikes themselves is from Transport for London, with the Thames, parks and the underlying network being faithfully drawn by OpenStreetMap contributors. One of the great advantages of using OSM data – apart from it being easy to access, is it’s often very up-to-date. For example, you can see the kink at the northern end of Blackfriars Bridge, on the animation, where the road bends around the Blackfriars Station redevelopment site.

Categories
OpenStreetMap Orienteering

OpenOrienteering Map Back Online

Following a period of downtime, caused by the rapid increase in size of the OpenStreetMap database, OpenOrienteeringMap is now back online.

There are now two editions – a UK edition which receives the live updates from OpenStreetMap, so will normally show roads and paths that are added to OpenStreetMap within a few minutes of the edit – and a world edition, which no longer updates live, but uses a static database. This database hopefully will be rebuilt occasionally to bring it up to date, although this will result in 3-4 days of downtime each time. The lack of updating, and the update downtime, is due to the limited resources I have at my disposal to run OpenOrienteeringMap. Unfortunately I cannot guarantee long-term availability or that the service will be around forever – my employer will want to reclaim the server eventually!

You can access OpenOrienteeringMap here, there is a new interstital which allows you to select the edition you want. Remember there are two versions, Street-O and “Pseud-O”. The image above shows the Pseud-O map for central Paris. Below is the Street-O map of part of Guayaquil in Ecuador.

Categories
Bike Share Data Graphics London OpenStreetMap

Flow Animation of Barclays Cycle Hire Bikes

Dr Martin Austwick and I, here at UCL CASA, have been working on an animation of the Barclays Cycle Hire bikes (aka Boris Bikes) in London, based on the historical flow information that was released by Transport for London (TfL) last month.

Taking one of the busiest days of the scheme – the 4th of October last year, a Monday which coincided with a London Underground strike – Martin has created an animation showing pulsing blobs, or motes, representing the bikes, moving through the 18 hours of the day that the data is available for. As each hire is made, the docking station dot flashes red, and and blue trail starts to leave it, heading towards the destination dock which flashes yellow as it receives a bike.

At the rush-hour peaks (08:45 and 17:45) the map becomes a sea of a 1000 blue pulses, many congregating on a number of key routes in London. The few bridges across River Thames can be picked out as intense bars of light, as commuters travel between Waterloo/South Bank and the City/West End. Hyde Park (middle left) and Regents Park (top left) are noticeable from having few docks in their area, and only a few bikes crossing them. The east seems busier than the west, as the City workers typically commute to work earlier and so dominate the scheme on strike day.

Martin’s used Processing, a rich Java graphics library, to create the animation, which has been then output to video. This allows the up-to-1000 bikes to be animated smoothly and effectively.

The bikes are in official Barclays Blue, although if you don’t view the video in HD, they look slightly washed out. Watch the video on the Vimeo website in HD, although you’ll need a fast computer and a broadband connection.

The routing is done based on the OpenStreetMap data for central London. I used Routino to do the routing, producing a routing file for each of the 137,000 possible journeys between docks in London. The routing is directed, meaning the bikes won’t cycle the wrong way down a one-way street. They also generally avoid trunk roads, such as Euston Road, preferring to use the quieter roads and dedicated cycle lanes nearby. Being able to use the new cycling infrastructure in the routing, is one big advantage of using OpenStreetMap.

A disadvantage is where the routing is wrong. For example, access from the Embankment is not shown correctly. Another problem was the reluctance to cross Trafalgar Square in the centre of the city. This meant I had to move a couple of the docking stations slightly. An example of the latter is shown in the picture here. These quirks, and a few others, result in some bikes flying around the animation extremely fast, as the router sends them a mile up in one direction, around a roundabout, and back down in the other direction. The speeds of the bikes are based on the duration information for the journey, which is included in the data, so they start and finish at the right time.

The routing is the “best guess” route, based on the assumption that the majority of cycle users will know the “best” route to take. Casual and multi-stop use will be less accurately shown. Bikes which are returned to the same docking station they started from, are shown “orbiting” the dock for four times, before returning to it.

The work follows on from a recent animation showing the TfL buses in London, by Anil Bawa-Cavia, also here at the UCL Centre for Advanced Spatial Analysis in London.

Categories
OpenStreetMap

Wheelmap – The Right Way for the World to Tag OpenStreetMap

I recently came across Wheelmap, a website (and also an associated iPhone app) specifically built to display – and accumulate – wheelchair accessibility information for points of interest (POIs) such as pubs, cafes, shops on OpenStreetMap. As you move around the map, an overlay highlights the POIs and colour-codes their accessibility for wheelchair users. Adding or changing the accessibility for a POI is as easy as clicking on it and clicking one of three options – job done! The data is then fed back to OpenStreetMap (so the whole community gets the benefit of this extra “tagging” information) and Wheelmap itself updates the colour.

The website is not perfect – the location finder is not yet fully localised from its German origin, for example, also the map controls aren’t styled like the rest of the site and the default OpenStreetMap map also shows its own symbols for many POIs, so they really need their own custom render – but this is nonetheless a great implementation targeting very specific data in the OpenStreetMap database and making it absolutely trivial for anyone to enhance the map in this way. I’m a firm believer that the easier it is to do something, the greater number of people will contribute.

Categories
London OpenStreetMap

Friday Review: London Crumpled City Map

I got the London Crumpled City Map as a Christmas pressie. It is a large scale map of central London – covering most, but not all, of Zone 1 – the eastern edge of the City is chopped off. It is designed and produced by an Italian company, and is one of a series of maps that also includes New York, Paris, Tokyo, Berlin and Rome.

The big feature about the map is you can scrunch it up into a ball and keep it in the soft pouch that comes with it – unraveling for later use is straightforward. The map is printed on a very thin and light plastic waterproof sheet, kind of like a synthetic tablecloth. The map remains very creased when it is flattened out – naively I was expecting it to spring back to its perfect condition which it was in when I opened the present – but is still very readable.

The cartography is simple and clear – grey roads with black text, on white. Large buildings are shown in lighter grey, parkland is in olive and the Thames is an unusually light blue. It’s too simple in places – paths in parks and on the Thames’s pedestrian bridges appear just like the roads, and bridges and tunnels are not shown, which means the Victoria Embankment appears to end abruptly as Blackfriars, rather than continuing under it as Upper Thames Street. Surface railway lines are present as narrow lines. Only the TfL stations are shown – City Thameslink is missing, for instance.

As a some-time contributor to the project, I’m pleased to see (thanks to the prominent credit on the map) that the data is from OpenStreetMap. Unfortunately the map does have a number of typos, more so than you would normally expect for a central London map. I’m not sure if these are due to the OpenStreetMap data – in which case the data must have been sourced a long time ago, as OpenStreetMap is pretty good in central London these days – or from an independent list of points of interest which have been superimposed on the top.

From the nature of the mistakes, I’m pretty sure OSM is not at fault here. For example, UCL appears as the University College of London, and Russel(l) Square station is missing an “l”. The Diana memorial fountain in Kensington Gardens appears as “Diana, Princess of Wales Memorial Fund”. A mysterious second “Paddington” station appears where the Bakerloo Line’s Edgware Road station is, and the other Edgware Road station doesn’t appear at all. Some of the landmarks are a bit dubious – the Royal Agricultural Hall is actually better known these days as the Business Design Centre in Islington and has been as such for at least 15 years. There are some prominent landmarks missing too, such as the Globe theatre on Bankside, the Old Bailey and the BFI IMAX cinema in Waterloo.

So – it’s probably not a particularly useful map for anyone – for tourists it leaves off too many attractions and stations, for cyclists and drivers it doesn’t distinguish between paths and roads, and for walkers, it doesn’t show the route of the underground lines. You would probably be better off looking at the many “minilith” map slabs that are starting to appear all around the city. However, it is very light, easy to store (there’s something very satisfying about crumpling it up) and completely waterproof. And it’s another real-world use of OSM. So I like it. Link to it on Amazon.

Categories
Mashups OpenLayers OpenStreetMap

More Circles on a Map – Orienteering Fixtures

Five years ago, I created a mashup of forthcoming orienteering fixtures in Great Britain, as listed by the sport’s national governing body, British Orienteering, on its website. It was based on the Google Maps v2 API, and a regular scraping of the HTML on their website, and was a set of pins on a map, coloured by the number of weeks to the event. On clicking a pin, you got a popup balloon with details of the event, and a link to the organising club’s website. A postcode locator, based on data from the NPEMap project, was added, so you could focus on events in your local area. You could also filter out far away events.

A couple of years later, British Orienteering’s web developers added their own map to their website – Google Maps v2 API based, with pins coloured by the number of weeks to the event, and a popup balloon, a postcode search and distance filter etc etc… The Unique Selling Point of my fixtures map was lost.

So, when a rewrite of British Orienteering’s website just before Christmas broke my map, I took the opportunity to rewrite it, as a vacation project, using the technologies I’ve been using a lot in 2010 – namely OpenLayers, OpenStreetMap, OS OpenData and coloured vector circles. The map is bigger, brighter, and hopefully more useable than the official map and my previous version.

You can see the new map here – with a mass of dots representing forthcoming fixtures, and circles surrounding the “home” postcode, backed by OpenStreetMap, with the postcode locator based on CodePoint Open from Ordnance Survey OpenData. Only the locator uses a database, the rest of the webpage is constructed on-the-fly from a webpage regularly copied from the British Orienteering website.

Not Scarborough…

The map remains subject to the quality of the data entered on the corresponding list – there is some limited tidying up of the data, but it’s difficult to correct grid references that result in events being in the sea – there’s currently one in the Irish Sea, as the event registrant entered “GR” as the grid reference letters, and this just so happens to be the location of the GR myriad. There is still work to be done on my new map, such as spotting obvious errors like this, guessing locations where a grid reference isn’t supplied, and perhaps including Northern Ireland’s events.

Incidentally, my original orienteering web map, which inspired my fixtures map, was one showing orienteering maps, it was written way back in August 2004, using a Flash mapping package by Map Bureau, with dots superimposed on top of a map pinched from Wikipedia. We’ve come a long way.

Categories
Data Graphics OpenStreetMap

Nike Grid – Visualising Runners on the Streets of London

My last eight posts have all been on bike share, time for a slight change of topic – running rather than cycling.

In the last few days, I’ve been taking part on the Nike Grid alternative reality game (a futuristic take on street-o). The concept is a great use of social media – with an active Facebook group, key updates pushed to participants phones and Facebook walls, and a Foursquare-esque concept of “checking in” to the phoneboxes which act as the run timers, starting and stopping clocks and noting locations. How do you “check in”? You make a (free) phone call.

There is a strong mapping element to the game – online maps show the locations of the key phoneboxes in each postcode, the maps appear in printed form and as artwork on the technical T-shirts included in player packs sent to key participants.

The maps are based on OpenStreetMap data, heavily stylised in black, grey and white with a “region”-specific pattern for the background and another pattern used for parks. The phoneboxes are “pin” style icons placed on top. The maps have been produced by Stamen Design in San Francisco. It’s not the first time they’ve done cool things with OSM data.

Stamen are also producing daily visualisations of the runs. The run lines have a hexagonal style to them, which goes along with the hexagonal tiling of the 48 postcodes being used in the game, although the start/end points are geographically accurate. A hexagonal cartogram is used on the main website to show the postcodes in pseudo-geographic space, in some of the visualisation the hexagons then “explode” and move to their correct place on the geographic map – a clever linking of cartograms and geographic maps.

Categories
Leisure OpenStreetMap

Nike Grid is Back

Nike’s alternative reality game/metrogaine/street-o – Nike Grid – is coming back to the streets of London. This time it’s over two weeks rather than just a weekend, and involves an element of teamplay – you can join a team based on your London quadrant (N, E, S or W) or university, or an adhoc one.

Of note, the map in the player pack is a rather nice (I think) restyled silver-and-black version of the green-and-black fold-out maps used in the original game. The source data is OpenStreetMap and the cartography reminds me somewhat of 8-Bit City – it’s not particularly useful for precision navigation, but is a nice example of Boing-Boing cartography, to borrow an expression from a talk at the recent Society of Cartographers conference. Oh, and they have credited OpenStreetMap contributors this time – yay!

Categories
Conferences OpenStreetMap

OpenStreetMap – The Quality Issue

This was the title of a presentation I gave today at the 46th Society of Cartographers Summer School (Lanyrd), which was in Manchester.

The abstract was:

OpenStreetMap is coming of age, but as it starts to be used more in the mainstream, the age-old questions of quality and completeness are coming to the fore. A range of data sources have been used to build up the map in the UK, from GPS traces to aerial imagery, historic mapping, NaPTAN and the OS Open Data release, each with their own benefits and limitations. This talk looks at a number of studies and tools developed to quantify, compare and address accuracy and coverage of the project in the UK, in an attempt to answer the key questions – is it complete yet and just how good is it?

OpenStreetMap – The Quality Issue

View more presentations from oliverobrien.

The presentation makes references to two animations, which are the Milton Keynes Mapping Party traces and the US TIGER import sequence.

Categories
Conferences OpenStreetMap

OpenStreetMap 101

I presented this short set of slides to some visiting students from the State University of New York in Buffalo, this morning in UCL CASA, as part of a mini-conference the department organised for them. It’s a simple, visual introduction to the project.

View more presentations from oliverobrien.

Additional notes: Slide 6 is a comparison of OSM, Google and Bing (or Yahoo). In Slide 10, the link is to here (20MB MPG). Slide 18 refers to OpenOrienteeringMap which can be found here. Slide 19 relates to two other visualisations I’ve made, see them here and here – OSM is being used for the background. Slide 20’s screenshots of BestOfOSM show Bern, Gaza City and Berlin Zoo.