Categories
Conferences OpenStreetMap

UCL – The Story so Far

At the beginning of the July, I transferred from UCL Geography “proper” to CASA (the Centre for Advanced Spatial Analysis), a research group at UCL allied to Geography department and a number of other areas. I am initially working on the MapTube product, specifically enhancing its coverage with respect to the spatial datasets available in the UK Data Store and London Data Store.

As part of my induction, I was asked to present a summary of my work at UCL so far. Here are the slides for that presentation.

View more presentations from oliverobrien.

The presentation includes various screenshots of mapping data, including data from the OpenStreetMap, EDINA UKBORDERS and OS Open Data projects. Attributions can be found on the respective websites.

Categories
OpenStreetMap Orienteering

OOM used for HH Street-O Event

Simon has a good article about how OpenOrienteeringMap was used for a street orienteering event in St Albans. See it here.

Categories
OpenStreetMap

OS Locator vs OSM

ITOWorld have created a rather nice streetname error indicator layer for Great Britain, which graphically shows naming inconsistencies for streets, between OS Locator (part of the Ordnance Survey Open Data release) and OpenStreetMap, when using the latter’s editor tools.

The service uses rectangular bounding boxes to show the discrepancies. Initially I thought this would not work well, as streets that are aligned north-south or diagonally would dominate compared with streets aligned to the east-west axis, but actually it visually works well, regardless of the orientation.

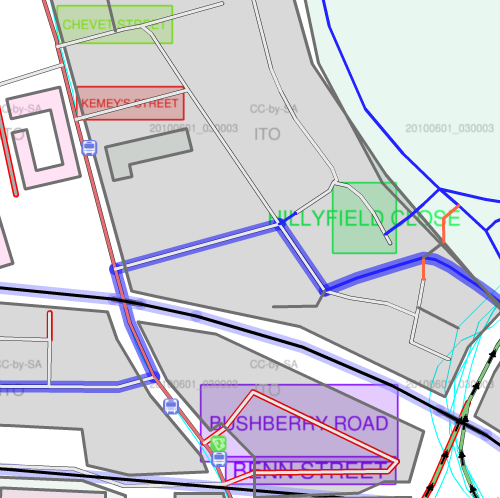
Here’s a screenshot of what it looks like for a park of Hackney:

The light green square at the top is indicating “Chevet Street” – this is the OS Locator name, and clicking the road underneath the rectangle in the editor reveals it is called “Chevet Road” in the OpenStreetMap database. Similarly, the red square reads “Kemey’s Street”, while in OSM it is currently “Kemey Street”. The close in green on the right appears to be misnamed as an extension of the street it joins, while the two streets at the bottom aren’t named at all in OpenStreetMap – which is why they are also showing up as red in the editor. (The blue outline indicators one of the London Cycling Network routes, by the way.)

Time to get out on the streets and and clear these errors!

Categories
Olympic Park OpenStreetMap

Mapping the London Olympics

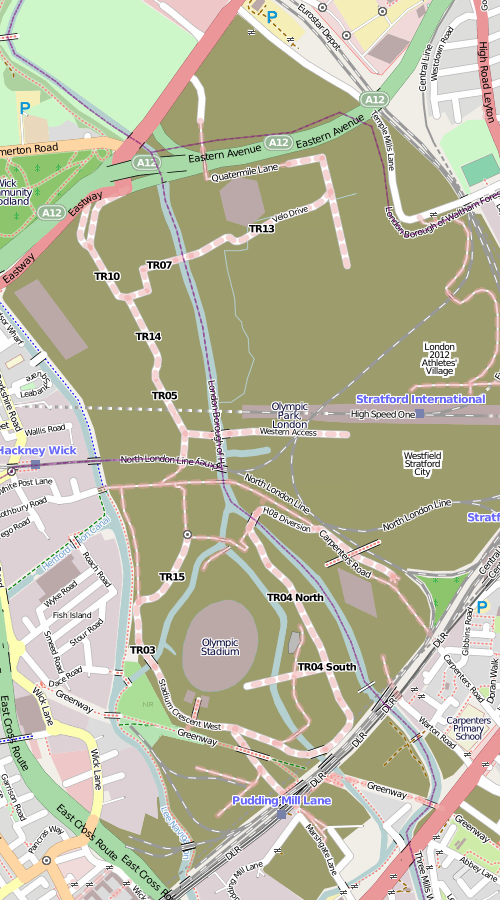
Here’s what the Olympic Park in East London currently looks like on OpenStreetMap, following my recent tour and some other visual guestimating from outside the boundary fence:

The brown areas shows the construction sites, most of which are for the Olympic Park, apart from the eastern area which is the Stratford City development and the southernmost area which is the Crossrail Pudding Mill Lane construction.

The main stadium is a rather unsteady oval, the media centre is the not-quite-rectangular building in the left-hand corner, the velodrome is the hexagon, and the aquatic centre is the diamond. These are all simplified shapes based on what I see, rather than any official plans. There aren’t any buildings yet for the athletes’ village (the fifth of the Big 5 permanent venues) or the Westfield Stratford City mega-development, just POIs. The roads are rather incomplete – although unlike the main venues, these might not be permanent. It’s about as complete as I can get it without privileged access to the site (unlikely) or tracing from detailed aerial or elevated imagery. There’s lots of such imagery out there – the official London 2012 blog has published quite a lot recently, as have some media.

So this is a plea to anyone owning such imagery – if they don’t mind it being used for OpenStreetMap data (i.e. happy to licence it under a Creative Commons Attribution licence) to let the OSM community use it for such purposes, so this high-profile site looks great and up-to-date on the map that everyone can use.

…or I could just wait until the park opens in two years time.

Categories
OpenStreetMap

National Library of Scotland Historical Maps

The National Library of Scotland’s high-quality scans of historical Scottish mapping have been made available under an Attribution licence, which means they can now be used to trace features for OpenStreetMap in Scotland. While the maps themselves were already out of copyright, the high quality scanned imagery itself was still subject to copyright.

You might think that, with the recent releases of up-to-date(ish) Ordnance Survey mapping in various scales and formats for the whole of the UK, historical mapping is less useful for OpenStreetMap. After all, why use 60-year-old mapping, available in raster form and available at (relatively) low resolutions, when resolution-free vector data, and 1:10000 rasters of the same area are similarly available. But these beautiful old maps contain a lot of detail not on the newer ones, and for large parts of rural Scotland, where roads, rivers and mountain features very rarely change, they will still be enormously useful for completing the more remote parts of the country.

The historical maps can be viewed here. As you zoom in a few levels, the projection changes into the regular EPSG900913 (the tilted north lines are a tell-tale sign) that can be used directly in OpenStreetMap editors such as Potlatch.

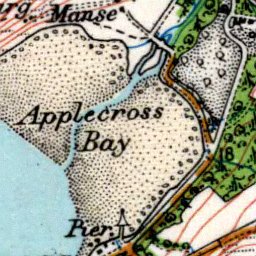
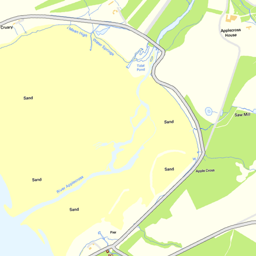
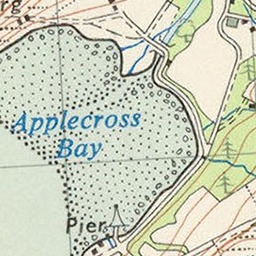
Here’s Applecross, a place near Skye in North-West Scotland that I have long wanted to visit. In this particular area, historical imagery (OS 7th Edition) is already available on OpenStreetMap, allowing for tracing, but this is not the case for most of Scotland, as many of the sheets are still in copyright.

National Library of Scotland (Historical):

Ordnance Survey Street View:

Ordnance Survey 7th Edition (Historical):

The current OpenStreetMap Mapnik render:

Categories
Data Graphics Mashups OpenLayers OpenStreetMap

Tube Stations in London – Visualisation

I was inspired by seeing this map and associated article on the New York Times website, linked from Going Underground, to create a similar mashup/visualisation of entry/exit volumes from the 300-odd tube stations in London. On their website, Transport for London provide the metrics for entries/exits from the stations, between 2003 and 2008, broken up into rush-hour, regular and weekend travel.

Each circle’s area is directly proportional to the flow numbers for that station (click on the circle to see the numbers.) The circles are rescaled between the first metric (total flows) and the rest, so direct comparison of metrics is possible except between the first and others, Blue circles represent an increase in flow and red a decrease.

If the mass of circles are obscuring each other, zoom in!

You can try it out here.

Some technical notes:

The background map is a custom render of OpenStreetMap data, with the tube lines highlighted in their traditional colour – it doesn’t always look quite “right” when you zoom in, due to the way the lines are tagged in my own copy of the OpenStreetMap database. The stations are even harder to disambiguate, so I’m using a free source from Wikimedia Commons, this means they don’t always line up.

Because your browser gets a copy of all the flow data when you load the page (yes I’ve heard of AJAX) it does run a little slowly in Internet Explorer, particularly the slider bars – these allow you to “drag” through the range of metrics or years.

Categories
Mashups OpenLayers OpenStreetMap

Manchester Map Mashup

I’ve created a mashup of lots of maps of Manchester as a proof-of-concept of how easy it is to mashup using OpenLayers. It’s not particularly pretty but does involve lots of maps.

See it here.

The layers are:

  • OpenStreetMap
  • Ordnance Survey Street View
  • Ordnance Survey 1:25000 First Series (1959)
  • Ordnance Survey New Popular Edition (1948)
  • Marr Map of Housing Conditions (1904)
  • Swire Map of Manchester (1824)

The first four maps are all hosted on OpenStreetMap servers.
The Swire map also contains an inset, dated 1650!

Categories
OpenStreetMap

OpenStreetMap: 250,000 People

The OpenStreetMap project, as of today, has over 250,000 registered users. It is fair to say that most of these will never edit the map, or have just edited it to put their house in and then don’t return, but there are also a large number of active contributors to the project, such as the London community. Over 40,000 “ways” (generally, roads) are being added to the project every day. The project is continuing to grow, and the release of usable Ordnance Survey (OS) data covering the country, at the beginning of the month, looks like it will advance the project, rather than reduce its relevancy in the U.K. For the first time, a quick way to “complete” the roads is available, but there are many other features still to add which will keep contributors busy for years to come. For one thing, none of the OS data includes paths and tracks, and it’s not completely up to date, unlike OSM which sometimes gets roads added on the day they open – or before!

The London community at the moment is concentrating on filling in the building areas in central London, so the map here looks less like a “patchwork quilt” of filled and unfilled blocks, and more like the contiguous mass you see in other cities like Stockholm, Frankfurt or Milan. (Having said that, we are well ahead of Paris, Barcelona, and, suprisingly, Berlin.)

Our next pub/map meetup is in Holborn on Wednesday evening – come along!

Categories
Leisure OpenStreetMap

Nike Grid – Nice Idea, Shame about the Attribution

[Update – Nike Grid is back in late October! – and they sorted the map this time.]

Nike are running an event next Friday/Saturday in inner London called Nike Grid. It’s a great idea – basically players run between any two specially marked phoneboxes in a postcode area (e.g. E9). Typically there are 3 or 4 such phoneboxes in each area, each temporarily branded with the event logo. At the beginning and end of the leg, the player phones a special number from the phonebox, entering their player code. As the call comes from the phonebox, it’s proof that the player is there then. Players then earn badges by doing the most number of runs in a postcode, doing all the possible combinations, the fastest run, the hilliest run, etc.

Like I say, a great idea. It’s a technologically advanced version of street orienteering, similar to what my club has been running in similar locations in central London over the winter and it’s a shame that Nike doesn’t mention the “o” world anywhere in their publicity for the event – but maybe orienteering is a bit anoraky for their brand experts? (Nike don’t make orienteering shoes anyway, but their big rivals, Adidas, do – my current o-shoes are Swoop 2s.) It’s a missed opportunity to promote the (sub)-sport to a market that likes running, is happy to be holding a map as a different challenge, but has never heard of orienteering.
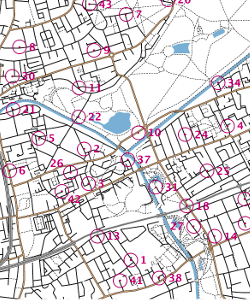
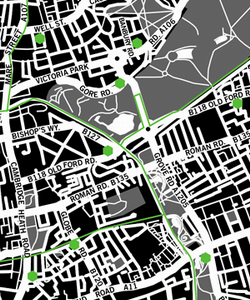
On the left is part of the map my club used for a street-o in Bow, below it is Nike’s version.

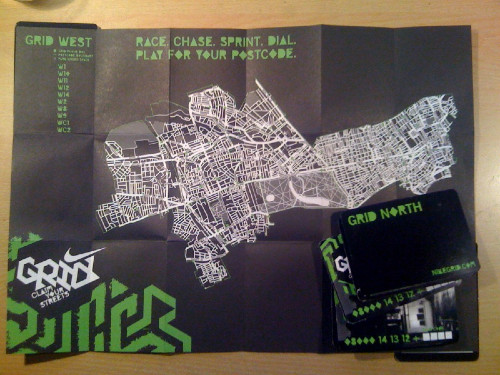
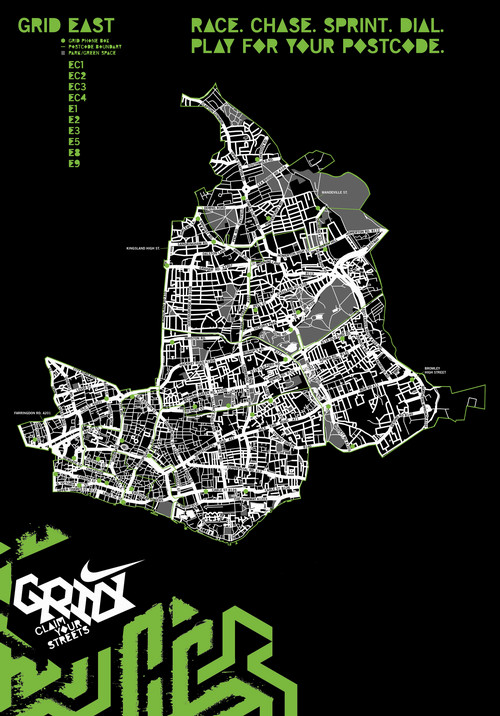
To pick your way between phoneboxes, you get a map – downloadable from the website, or collectable in paper form from the phoneboxes themselves or the Nike stores in London. There’s four maps, representing south, west, north and east London – the coverage generally extends out to the edge of zone 2. I visited a few of the phoneboxes this evening and picked up the north and the west maps (the south and east ones haven’t been put out yet, or have all been swiped already). On the maps, the phoneboxes are shown as green hexagons and the rest of the map is a rather pleasingly mimimalistic white-on-black design, rather like some of the other great cartography you can create out of the OpenStreetMap data for inner London that I and other project volunteers have collected.

In fact, wait a minute. Some of the detail on the maps around my home area looks rather familiar. Yes, they have actually used OpenStreetMap data for the map. I can see the characteristic kinks in the paths in my local park that I surveyed and that don’t appear on OS/Google/Teleatlas/Navteq et al map data. Nothing wrong with that – using OpenStreetMap data commercially such as promoting a brand of shoes is just fine. Except they haven’t attributed the project or stated the licence the maps fall under – both requirements of using OpenStreetMap data to create a derived work, especially in printed form. Oops.

Why am I bothered? Contributors of open data don’t do it for the money (mostly) but for the “kudos”. In the case of OSM, the project itself typically gets attributed rather than specific contributors, for practical and logistical reasons. The contributors are still acknowledged in the data itself. The project benefits from acknowledgement because publicity will help increase the number of contributors to the project and so increase the quality and completeness of the map data, making it in turn more viable for future uses. Everyone wins.

All they need to do is (a) add a line to attribute the project, such as “Map data (c) OpenStreetMap and contributors, CC-BY-SA”, to the maps concerned on their website and future printed copies, and (b) not be surprised if people make derivative works from the maps, which is allowed by the licence the data has been used under. I’m tempted to create an interactive map for the whole of London or indeed the world, in the same style – the cartography is very nice.

Incidentally the map is created using quite an old copy of the data, from before last September – some of the more recent roads I and others have added to the project don’t appear. The designers have also enhanced the widths of some of the major roads, and added in road names and numbers. Roundabouts have also been added in as proper circles. There are some mistakes in the process they’ve used – the main track (highway=bridleway if I recall correctly) around Victoria Park doesn’t appear, but the paths (highway=path) that lead to it do, resulting in a rather odd “gappy” looking bit of cartography around there, ironically a similar quirk of the Google maps of the same area.
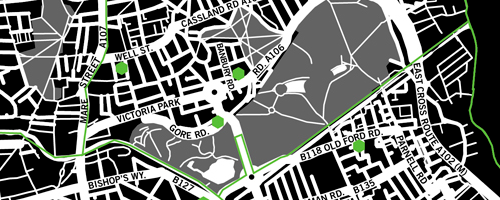
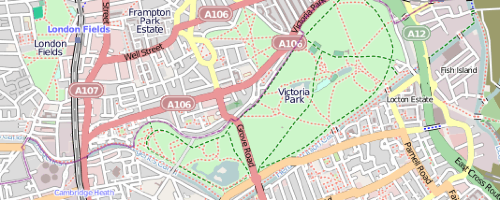
Also, I’m not sure where the postcode boundary lines come from, but they mis-align somewhat with the OpenStreetMap data – in some places the lines wander near, but not exactly along, the centreline of a boundary road. You can see a particularly bad mismatch between the green line (postal boundary) and the white line (here a canal) on the left of the first map above. Just a cosmetic quirk.

It is a really great idea, and a really nice bit of marketing. I will, hopefully, have a go at getting a few of the badges during the 24 hours the game runs. Let’s hope they get the attribution sorted out.

(I notice it’s happening the same weekend as the London Marathon, who have Nike’s rivals Adidas as a key sponsor. The timing is not a coincidence, I’m sure!)

By the way, Nike have made it very hard to be contacted about this – there are no contact details on the game’s website and it is not possible to send private messages to the owner of the game’s page on Facebook, thanks to the way the social network sets up fan pages. Sigh. Of course, people in glass houses and all that, I should attribute the screenshots in this blog post – all the screenshots are of maps created using map data (c) OpenStreetMap and contributors, CC-BY-SA.

[Update – I have made minor edits to improve the clarity of the article and add the note about Google.]
Categories
Conferences OpenStreetMap

GISRUK Navigation Challenge

This is the map GISRUK 2010 attendees are using to get from UCL, where the conference is, to the River Thames, where the boat await for the evening cruise. On the way, some of them are doing the challenge, which is to take the optimum route to visit any 6 of the 12 control points – a blue plaque at each one to prove their visit. The map was made using the OpenOrienteeringMap map builder.

[Download PDF]

(Note: The start point was actually from just east of “B” rather than the triangle.)

I haven’t yet computed the best route, I think it’s probably BAJFED or maybe BMCKED. There is no “trick” best route, as the points were fairly fixed by the locations of the blue plaques. But the solution is apparently not immediately obvious to the human eye.