Categories
Data Graphics London

Evolution of London’s Rush Hour Traffic Mix

My latest London data visualisation crunches an interesting dataset from the Department of Transport (there’s also a London Borough of Southwark version using their local observation data). The data is available across England, although I’ve chosen London in particular because of its more interesting (i.e. not just car dominated) traffic mix. I’ve also focused on just the data for 8am to 9am, to examine the height of the morning rush hour, when the roads are most heavily used. 15 years worth of data is included – although many recording stations don’t have data for each of those years. You can choose up to three modes of transport at once, with the three showing as three circles of different colours (red, yellow and blue) superimposed on each other. The size of each circle is proportional to the flow.

It’s not strictly a new visualisation, rather, it’s an updated version of an older one which had data from just one year, using “smoothed” counts. But it turns out that the raw counts, while by their nature more “noisy”, cover a great many more years and are split by hours of the day. I’ve also filtered out counting stations which haven’t had measurements made in the last few years.

Note also the graph colours and map colours don’t line up – unfortunately the Google Material API, that I am using for the charting, does not yet allow changing of colours.

An alternate mode for the map, using the second line of options, allows you to quantify the change between two years, for a single selected type of transport. Green circles show an increase between the first and second year, with purple indicating decreases.

Categories
London Orienteering

London City Race Mega-Map

Below is a low-resolution view of the London City Race orienteering maps that have been used since the race was first held in 2008, arranged geographically to show their relative position. The maps were drawn by myself (initially) and Remo Madella (subsequently) who joined them together and assembled this image. Dark grey represents buildings, with olive green for private gardens and other off-limits land, and pink showing construction sites. The map is not entirely up-to-date, as only the relevant section is updated/extended, for each race.

There are only a couple of small gaps, between Covent Garden and Aldwych, and between Wapping and Limehouse. These aside, it would be possible to run on a proper urban (ISSOM) orienteering map, from Oxford Circus in the West End, right down to Island Gardens on the tip of the Isle of Dogs. Such a run would be well over 10km, and the accompanying map would be over two metres long at its 1:5000 native scale.

Here’s where each area was first used. 2014 was the only edition of the race, to date, that did not expand the map:

The maps contain OS data which is Crown Copyright and database right Ordnance Survey, 2007-16, with licence # 100015287 for non-OGL content.

Categories
Data Graphics London

Lives on the Line v2: Estimated Life Expectancy by Small Areas

livesontheline_district

I’ve produced an updated version of a graphic that my colleague Dr James Cheshire created a few years ago, showing how the estimated life expectancy at birth varies throughout the capital, using a geographical tube map to illustrate sometimes dramatic change in a short distance.

You can see an interactive version on my tube data visualisation platform. Click a line colour in the key on the bottom right, to show just that line. For example, here’s the Central line in west London.

The data source is this ONS report from 2015 which reports averages by MSOA (typical population 8000) for 2009-2013. I’ve averaged the male and female estimates, and included all MSOAs which touch or are within a 200m radius buffer surrounding the centroid of each tube, DLR and London Overground station and London Tram stops. I’ve also included Crossrail which opens fully in 2019. The technique is similar to James’s, he wrote up how he did it in this blogpost. I used QGIS to perform the spatial analysis. The file with my calculated numbers by station is here and I’m planning on placing the updated code on GitHub soon.

livesontheline_alllondon

My version uses different aggregation units (MSOAs) to James’s original (which used wards). As such, due to differing wards and MSOAs being included within each station’s buffer area, you cannot directly compare the numbers between the two graphics. An addition is that I can include stations beyond the London boundary, as James’s original dataset was a special dataset covering the GLA area only, while my dataset covers the whole of England. The advantage of utilising my data-driven platform means that I can easily update the numbers, as and when new estimates are published by the ONS.

Estimating life expectancies at birth for small areas, such as MSOAs, is a tricky business and highly susceptible to change, particularly due London’s high rates of internal migration and environmental change. Nevertheless it provides a good snapshot of a divided city.

View the interactive version.

livesontheline_dlr

Data: ONS. Code: Oliver O’Brien. Background mapping: HERE Maps.

Categories
Conferences London

Smart Mobility Meeting in Mexico City

Below is a presentation that combines my talks last Thursday and Friday at the Smart Mobility forums in central Mexico City, organised by ITDP Mexico and funded by the Foreign and Commonwealth Office’s Prosperity Fund (respresented by the British Embassy in Mexico). The Thursday presentation focused on the third-party app ecosystem that exists around bikesharing in London and elsewhere, while the Friday presentation included more examples of private sector innovation using open data:

My week in Mexico City also included a visit to CIC at IPN (the computational research centre city’s main polytechnic) where I was introduced to a product building visualisations of ECO-BICI data to help create more effective strategies for redistribution. I also visited LabCDMX, a research group and ideas hub to study Mexico City that has been created by the city government, to give a couple of talks in their rooftop on visualising London transit and a summary of web mapping technologies. The organisers also squeezed in a couple of short TV interviews, including Milenio Noticias (23 minutes in). The week ended with a tour of the ECO-BICI operations, repair, management and redistribution warehouse, located centrally and a hive of activity. This included a look at their big-screen redistribution map and vehicle routing system.

Some of the companies and products I cited included CityBikes, Cycle Hire Widget, TransitScreen, ITO World, Shoothill, Waze, Strava Metro and CityMapper. I also showed some academic work from myself, James Cheshire and Steve James Gray in UCL GSAC and UCL CASA respectively, an article in The Guardian by Charles Arthur, an artwork by Keiichi Matsudaa and a book by James Cheshire and Oliver Uberti. I also mentioned WhatDoTheyKnow and heavily featured the open data from Transport for London.

I also featured some work of my own, including CDRC Maps, TubeHeartbeat, London Panopticon, Tube Stats Map, CityDashboard, Bike Share Map and London Cycling Census map.

ecobici

Categories
CDRC London Technical

Big Data Here: The Code

So Big Data Here, a little pop-up exhibition of hyperlocal data, has just closed, having run continuously from Tuesday evening to this morning, as part of Big Data Week. We had many people peering through the windows of the characterful North Lodge building beside UCL’s main entrance on Gower Street, particularly during the evening rush hour, when the main projection was obvious through the windows in the dark, and some interested visitors were also able to come inside the room itself and take a closer look during our open sessions on Wednesday, Thursday and Friday afternoons.

Thanks to the Centre for Advanced Spatial Analysis (CASA) for loaning the special floor-mounted projector and the iPad Wall, the Consumer Data Research Centre (CDRC) for arranging for the exhibition with UCL Events, Steven Gray for helping with the configuration and setup of the iPad Wall, Bala Soundararaj for creating visuals of footfall data for 4 of the 12 iPad Wall panels, Jeff for logistics help, Navta for publicity and Wen, Tian, Roberto, Bala and Sarah for helping with the open sessions and logistics.

The exhibition website is here.

I created three custom local data visualisations for the big screen that was the main exhibit in the pop-up. Each of these was shown for around 24 hours, but you can relive the experience on the comfort of your own computer:

bdh_buses

1. Arrival Board

View / Code

This was shown from Tuesday until Wednesday evening, and consisted of a live souped-up “countdown” board for the bus stop outside, alongside one for Euston Square tube station just up the road. Both bus stops and tube stations in London have predicted arrival information supplied by TfL through a “push” API. My code was based on a nice bit of sample code from GitHub, created by one of TfL’s developers. You can see the Arrival Board here or Download the code on Github. This is a slightly enhanced version that includes additional information (e.g. bus registration numbers) that I had to hide due to space constraints, during the exhibition.

Customisation: Note that you need to specify a Naptan ID on the URL to show your bus stop or tube station of choice. To find it out, go here, click “Buses” or “Tube…”, then select your route/line, then the stop/station. Once you are viewing the individual stop page, note the Naptan ID forms part of the URL – copy it and paste it into the Arrival Board URL. For example, the Naptan ID for this page is 940GZZLUBSC, so your Arrival Baord URL needs to be this.

bdh_traffic2

2. Traffic Cameras

View / Code

This was shown from Wednesday evening until Friday morning, and consisted of a looping video feed from the TfL traffic camera positioned right outside the North Lodge. The feed is a 10 second loop and is updated every five minutes. The exhibition version then had 12 other feeds, surrounding the main one and representing the nearest camera in each direction. The code is a slightly modified version of the London Panopticon which you can also get the code for on Github.

Customisation: You can specify a custom location by adding ?lat=X&lon=Y to the URL, using decimal coordinates – find these out from OpenStreetMap. (N.B. TfL has recently changed the way it makes available the list of traffic cameras, so the list used by London Panopticon may not be completely up-to-date.)

bdh_census

3. Census Numbers

View / Code

Finally, the screen showed randomly chosen statistical numbers, for the local Bloomsbury ward that UCL is in, from the 2011 Census. Again, you can see it in action here (wait 10 seconds for each change, or refresh), and download the code from GitHub.

Customisation: This one needs a file for each area it is used in and unfortunately I have, for now, only produced one for Bloomsbury. The data originally came, via the NOMIS download service, from the Office for National Statistics and is Crown Copyright.

bdh_traffic3

Categories
Data Graphics London

Big Data Here

9k-1

The Consumer Data Research Centre (CDRC) at UCL is organising a short pop-up exhibition on hyperlocal data: Big Data Here. The exhibition is taking place in North Lodge, the small building right beside UCL’s main entrance. The exhibition materials are supplied by the Centre for Advanced Spatial Analysis (CASA).

Inside, a big projection shows local digital information. What the screen shows will change daily between now and Friday, when the exhibition closes. Today it is showing a live to-the-second feed of bus arrivals at the bus stop outside the North Lodge, and tube train arrivals at Euston Square station just up the road. Watch the buses zip by as they flash up “Due” in big letters on the feed. Both of these are powered by Transport for London’s Unified Push API, and we are planning on publishing the visualisation online next week. Tomorrow will be showing a different local data feed, and then a final one on Friday.

cvimcbqwgaa4bkw

Opposite the projection is the iPad Wall. This was created by CASA a few years back by mounting a bank of iPads to a solid panel (above photo shows them in test mode) and allowing remote configuration and display. The wall has been adapted to show a number of metrics across its 12 panels. Four of these showcase footfall data collected by one of our data partners, and being used currently in CDRC Ph.D. research. The other panels show a mixture of air quality/pollutant measures, tube train numbers and trends, and traffic camera videos.

We hope that passersby will enjoy the exhibition visuals and use them to connect the real world with the digital space, a transposition of a digital data view onto the physical street space outside.

The exhibition runs 24 hours a day until Friday evening, with the doors open from noon until 3:30pm each day. The rest of the time, the visualisations will be visible through the North Lodge’s four windows. The exhibition is best viewed at night, where the data shines out of the window, spilling out onto the pavement and public space beyond:

2q

Big Data Here is taking place during Big Data Week 2016. Visit the exhibition website or just pop by UCL before Friday evening.

9k

cvmvee-xyaaxmep

Categories
London

Busiest Tube Station Times

chesham_max

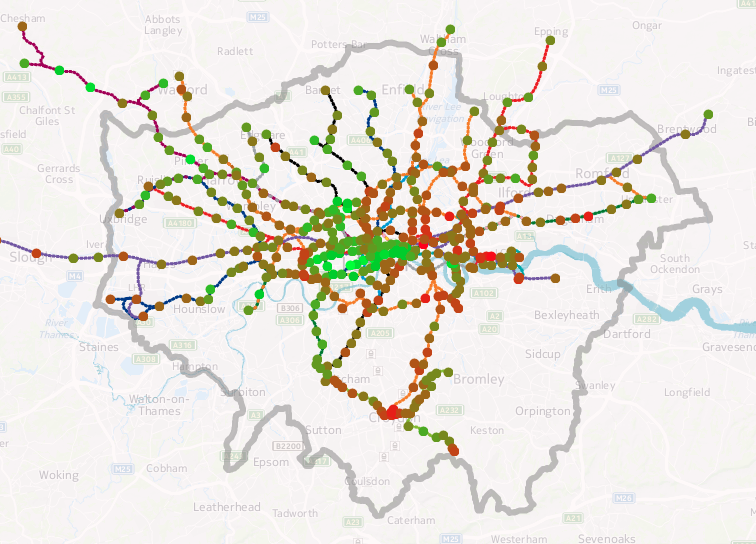
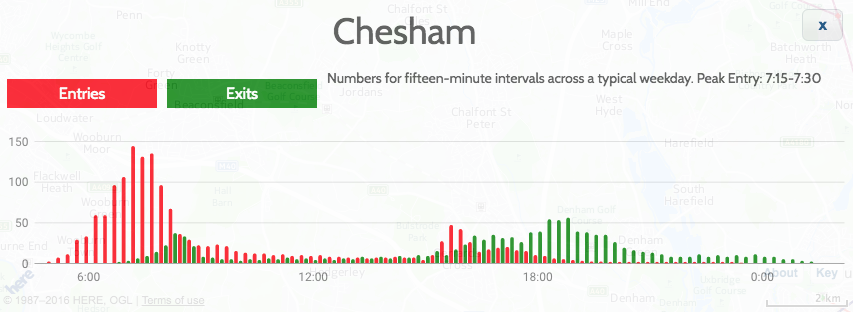
Here are the busiest Tube station quarter-hour periods, based on the Transport for London 2015 RODS data (modelled, based on typical autumn weekday), used in Tube Heartbeat, adding together entries, exits and interchange stats and excluding Kensington Olympia which does not have a frequent Tube service.

The main pattern shows that stations further out (map) from London’s main work areas (The West End, the City and Canary Wharf) have an earlier morning peak (or later evening peak), due to the journey taking longer and the tendency for many people to arrive at their work-end station at about the same time – just before 9am. A secondary effect is that stations which just act as simple commuter home and work portals, we would expect the usage to peak in the morning rush hour, rather than than evening one, as the morning rush hour is shorter and so the simple commuter flow is more concentrated. Therefore, stations which show a peak in the evening are often due to a combination of this simple commuter flow and an evening “going out” destination.

Station Peaks by Time of Day

7:15am-7:30am: Chesham [Zone 9]

7:30am-7:45am: Chalfont & Latimer [8], Epping [6]

7:45am-8:00am: Amersham [9], Chorleywood [7], Debden [6], Elm Park [6], Hillingdon [6], Hornchurch [6], Theydon Bois [6], Cockfosters [5], Pinner [5], South Ruislip [5], Stanmore [5], Mill Hill East [4], Chigwell [4], Grange Hill [4], Perivale [4],Kew Gardens [3/4], Wimbledon Park [3], Holland Park [2]

8:00am-8:15am: Alperton, Arnos Grove, Balham, Barking, Barkingside, Becontree, Buckhurst Hill, Canons Park, Chiswick Park, Clapham South, Colindale, Colliers Wood, Croxley, Dagenham East, Dagenham Heathway, Eastcote, East Putney, Edgware, Fairlop, Finchley Central, Gants Hill, Hainault, Harlesden, Harrow-on-the-Hill, Hatton Cross, High Barnet, Hounslow Central, Hounslow East, Hounslow West, Ickenham, Kenton, Kingsbury, Loughton, Moor Park, Morden, Neasden, Newbury Park, Northfields, North Harrow, Northolt, Northwick Park, Northwood, Northwood Hills, Oakwood, Osterley, Parsons Green, Preston Road, Ravenscourt Park, Rayners Lane, Redbridge, Rickmansworth, Roding Valley, Ruislip, Ruislip Gardens, Ruislip Manor, Seven Sisters, Snaresbrook, South Ealing, Southfields, Southgate, South Harrow, South Kenton, South Wimbledon, Stamford Brook, Sudbury Hill, Sudbury Town, Totteridge & Whetstone, Turnham Green, Upminster Bridge, Upney, Wanstead, Watford, West Acton, West Harrow, West Ruislip, Wimbledon, Woodford, Woodside Park

8:15am-8:30am: Acton Town, Archway, Arsenal, Blackhorse Road, Boston Manor, Bounds Green, Bow Road, Brent Cross, Brixton, Bromley-by-Bow, Burnt Oak, Canada Water, Canning Town, Dollis Hill, Ealing Broadway, Ealing Common, East Acton, East Finchley, Finchley Road, Finsbury Park, Fulham Broadway, Golders Green, Goldhawk Road, Hammersmith (H&C), Harrow & Wealdstone, Hendon Central, Highgate, Kensal Green, Kilburn, Kilburn Park, Leytonstone, Maida Vale, Manor House, North Acton, North Wembley, Park Royal, Plaistow, Putney Bridge, Queen’s Park, Shepherd’s Bush Market, St. John’s Wood, South Woodford, Swiss Cottage, Tooting Bec, Tooting Broadway, Tottenham Hale, Tufnell Park, Upton Park, Walthamstow Central, Warwick Avenue, Wembley Park, West Brompton, West Finchley, West Hampstead, Willesden Green, Wood Green

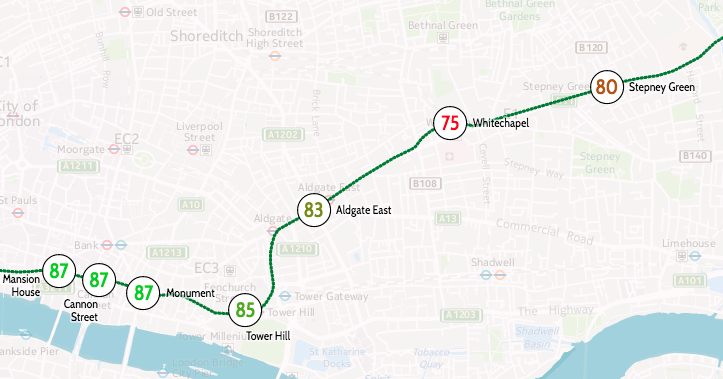
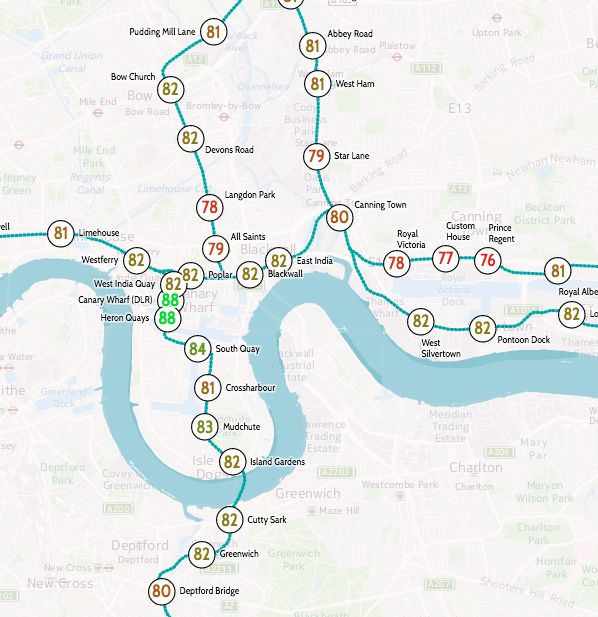
8:30am-8:45am: Baker Street, Bank/Monument, Barons Court, Belsize Park, Bermondsey, Caledonian Road, Canary Wharf, Chalk Farm, Earl’s Court, Edgware Road, Elephant & Castle, Euston, Hammersmith, Hampstead, Highbury & Islington, Holloway Road, Kennington, Kentish Town, Ladbroke Grove, Lancaster Gate, London Bridge, Marylebone, Mile End, Moorgate, Notting Hill Gate, Oval, Paddington, Pimlico, Richmond, Royal Oak, Stepney Green, Stockwell, Uxbridge, Vauxhall, Victoria, Westbourne Park, West Kensington, Westminster, Whitechapel

8:45am-9:00am: Barbican, Aldgate East, Blackfriars, Borough, Cannon Street, Chancery Lane, Edgware Road (Bakerloo), Euston Square, Farringdon, Great Portland Street, Latimer Road, Mansion House, Old Street, Regent’s Park, Southwark, St. James’s Park, St. Paul’s, Warren Street

3:30pm-3:45pm: North Ealing

5:00pm-5:15pm: Heathrow Terminal 5

5:15pm-5:30pm: Willesden Junction

5:30pm-5:45pm: Aldgate, Russell Square, South Kensington, West Ham, Heathrow Terminals 1 2 3, Heathrow Terminal 4

5:45pm-6:00pm: Bond Street, Embankment, Goodge Street, Green Park, Gunnersbury, Hanger Lane, Wood Lane, Holborn, King’s Cross St. Pancras, Knightsbridge, Lambeth North, Liverpool Street, Mornington Crescent, North Greenwich, Oxford Circus, Stonebridge Park, Charing Cross, Stratford, Temple, Tower Hill, Turnpike Lane, Upminster, Waterloo, White City

6:00pm-6:15pm: Angel, Camden Town, Covent Garden, East Ham, Gloucester Road, Greenford, High Street Kensington, Hyde Park Corner, Leicester Square, Leyton, Marble Arch, Piccadilly Circus, Queensway, Shepherd’s Bush, Sloane Square, Tottenham Court Road

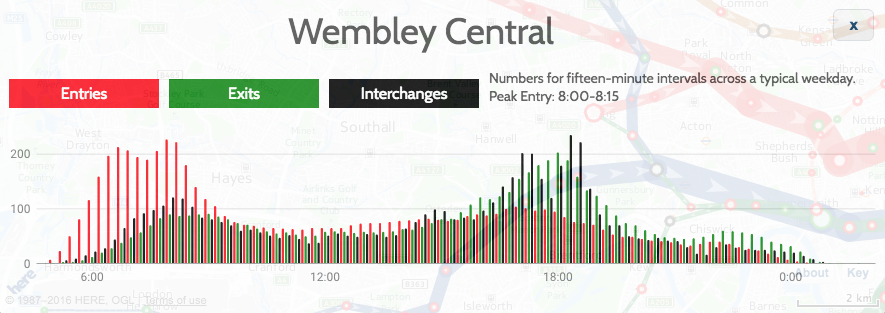
6:15pm-6:30pm: Bayswater [1], Bethnal Green [2], Clapham Common [2], Clapham North [2], Queensbury [4], Wembley Central [4]

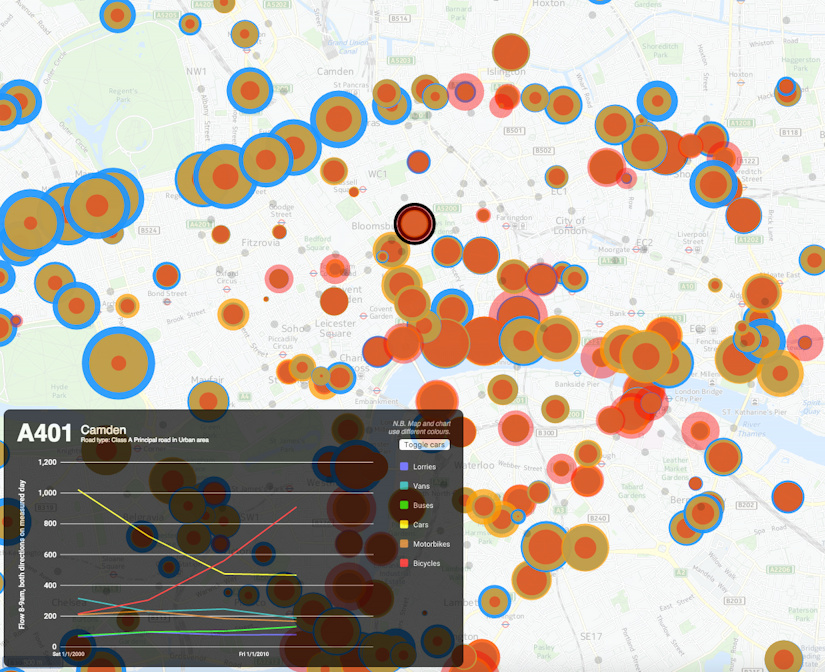
You can explore graphs of the flows, in detail, at Tube Heartbeat – just choose the station of your choice on the drop-down on the top right, or click on it on the map.

Six Rush Hours?

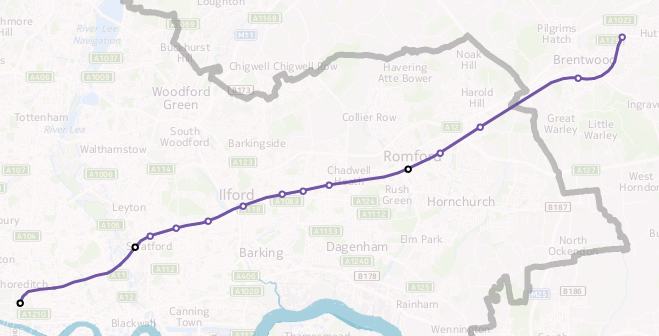
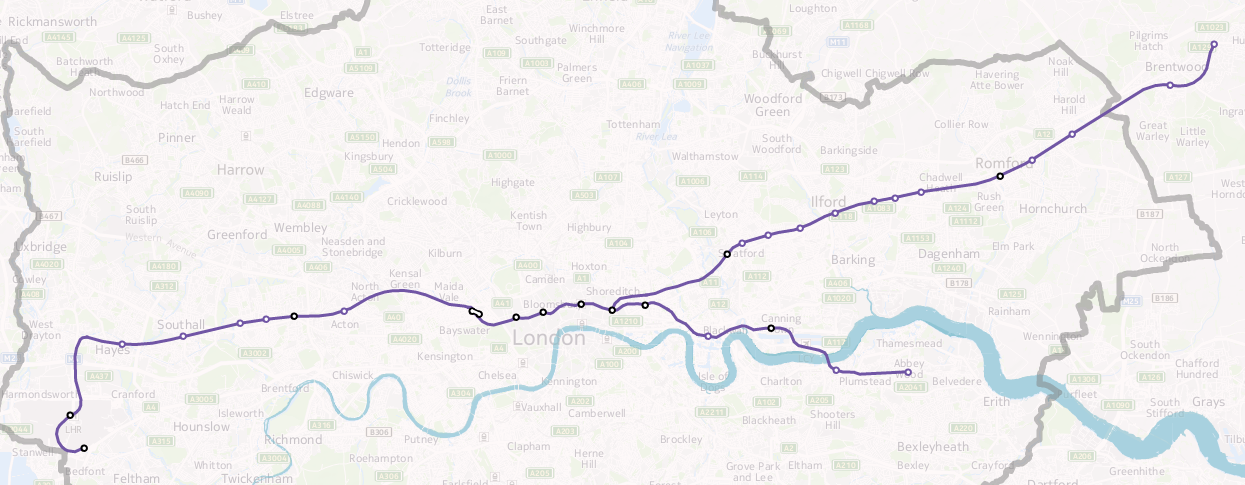
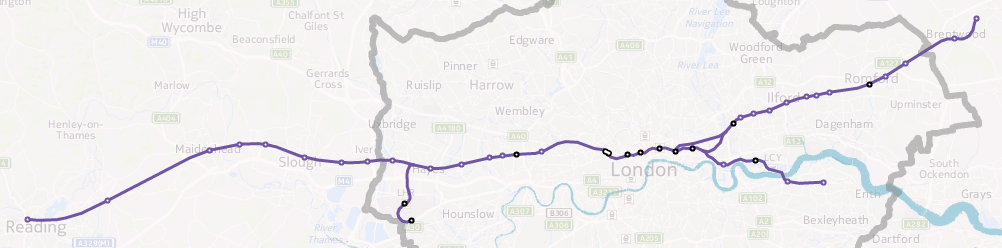
Interestingly, if you look at the flows between stations, you can actually see SIX rush hours each weekday (you can see five of them below by looking across these sample segment graphs):
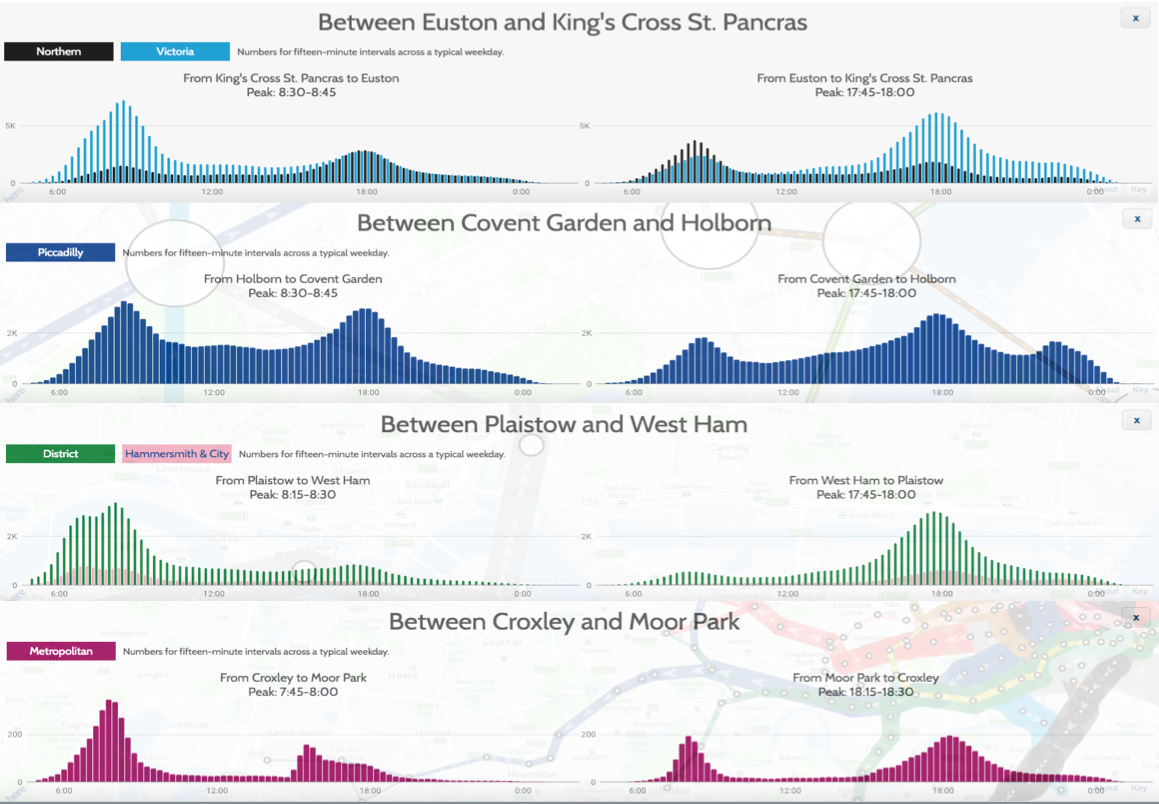
fiverushhours

These are:

  • A early morning peak, 7-8am. This is distinct from the main morning peak, and can be seen certain segments in east London, particularly on the District line near Plaistow, where the two morning peaks are an hour apart, with a noticeable dip in flow between the two. This may reflect the workforce for some traditional industries with 8am-4pm historical or shift-based working hours.
  • The main morning rush hour that almost all stations and line segments see – 7:30am-9am. Some of the more outlying stations (Zones 5-9) see their peak for this rush hour earlier than 8am, as it takes a while to get into the centre of London. You can see this is not the 7-8am peak above, by “tracing” the ripple through the network towards central London.
  • School home-time at roughly 3-4pm. Mainly affects some smaller, outer London stations, particularly in the north-west, for example Moor Park.
  • A corresponding 4-5pm peak for shift workers who started at 8am. Only a few links show this, such as Wembley Central in north-west London. The evening rush hours are less “compressed” than the morning ones so it is generally harder to distinguish between this one and the next one.
  • The main evening rush hour, 5-7pm.
  • Theatreland end-of-show rush hour, 10-11pm. Noticeable around Leicester Square, Covent Garden and Holborn. Some other areas, with established night-time economies, may also see a slight peak around this time.

You can also see 3+ rush hours in some of the stations, such as Wembley Central, which shows all six:

wembley_max

Categories
London

Open House London 2016: City of London (East)

A couple of weekends ago it was Open House London, two days where hundreds of London’s more interesting buildings open up, for free, for curious passersby (and organised pre-bookers). The capital fills up with interested parties carrying the distinctive green books. This year, on both days, we were only free from around 3pm onwards (due to a wedding and a sports race on Saturday and Sunday respectively) so had to optimise carefully with most places closing by 5pm – so we focused on the eastern part of the City of London, where there is a great density of interesting (and open) buildings.

Saturday

ohl_cheesegrater

3pm: RSHP architects practice in the Leadenhall Tower

This was a pre-booked tour and involved a couple of queues and a wait before getting in. Once on the 3rd floor lobby (there are multiple levels), we looked at an impressive Lego model of the tower (also known as the Cheesegrater), before heading up in high-speed lifts to the 14th floor, where the architectural practice which designed the tower, and numerous others including the famous Lloyds of London opposite, is based. There is a striking gap (see pic above) in the interface between the lift landing area and the workspace, followed by a glass-panelled room where the practice’s servers are based – very neatly racked, as they are visible to all who enter, stored behind glass. The kitchens and meeting rooms are here. The lift landing area contains the bathrooms, where the bottom of the sinks are angled horizontal in exactly the same way that the tower is angled vertically – that is, with a 20 degree tilt. This all means that the rest of the space can be completely open – and it is, on this floor. Even the ceiling panels were not installed, instead, the plant infrastructure was left. This creates a void which allows talking and other office noise to just disappear. Sir Richard Roger himself sits at the far end of one of the long desks – his desk noticeable for having no computer on it. The windows have stickers on them showing which way to look towards other buildings designed by the practice. The most iconic building of all though, perfectly lined up with the tower (and the reason why it has to tilt backwards) is St Paul’s Cathedral, out to the west.

ohl_stehelens

4pm: St Helen’s Bishopsgate

By 4pm on Open House London days, most buildings are shutting their doors or have set of their final tour. So we were lucky to stumble into St Helen’s Bishopsgate, just 100 years from the Leadenhall Tower. This ancient and curious church, formally a nunnery and parish church now joined together, was badly damaged in the 1990s IRA bombings, and has radically restored. Inside, it is very bright inside, it is largely a box shape with the platform off to one side rather than being in the middle. The floor was also raised by nearly a metre, so that some of the older stone memorials have a pronounced drop downwards from the floor edge to them. One particularly interesting and unusual feature is the walk-in baptistry.

Sunday

ohl_drapershall

2:30pm: Drapers’ Hall

One of London’s livery halls, and recently famous for the Great British Banquet, this is an exceedingly grand and opulent set of rooms, accessed through a suprisingly small doorway and corridor. It was great to be able to just walk in, get handed a guide and wander under huge chandeliers and huge, gilded ceilings.

ohl_gold

3pm: Bank of England

This was another pre-booked tour, with tight (X-ray) security and a strict ban on photography. Fair enough – it is the Bank of England, and while the museum is normally open to the public (on weekdays), this was a tour inside the functioning rooms themselves. The tour included the marble floors and the parlour rooms, though not the gold vaults. The parlour rooms are very opulent and set in historic styles, even though the bank was rebuilt from the ground up in the 1930s. They include a red room which is set up like an “old boys clubroom” and is for visiting guests, a blue room which is where the Monetary Policy Committee meets to make decisions on interest rates etc, a green room which is a larger and more rarely used room for larger meetings and banquets, and finally a yellow dining room. Most of the rest of the bank is just standard office space and so we only saw a glimpse of these bits. We then exited into the museum itself, where we were able to lift a gold-bar (through a hole in a perspex box and with theatrical security – four CCTV camera screens, two members of staff flanking the box). A ticker display above showed the current value of the London Gold Standard bar I was holding – £399,000. I did manage to open another perspex box in the museum though – one operated by a rotary combination lock, the sequence of which can be revealed by answering a number of questions. It still took a good 10 minutes to perform the required number of rotations to the correct accuracy, with suitable pauses between. The token inside could then be swapped for a mini “gold bar” pin badge freebie.

ohl_masonictemple

4:30pm: Masonic Temple in the Andaz Hotel, Liverpool Street

Quite a long queue to get in for this final building – perhaps because it was one of the few still open for access as Open House London was drawing to the close. Eventually we squeezed in, just before 5pm, into a hotel and along and up a long set of corridors and steps, until suddenly we stepped into an opulent and windowless “secret” chamber, elaborately decorated. It was bricked up for many years since the lodge was abandoned in the 1950s, only discovered a few years ago when builders knocked down a void. Now it is used for receptions and other formal events.

Looking forward already to next year’s weekend, and hopefully I’ll have the full weekend to explore. I think concentrating one one small area – or alternatively focusing on one particular borough, not necessarily a central one – is a good strategy, for maximising visiting time over travelling time.

Categories
London

Crossrail: Tottenham Court Road Station

tcr1

Thanks to spotting a notification for a tour of several Crossrail stations as part of a get-parents-and-kids-into-construction day, I was able to visit a space deep beneath Oxford Street and Tottenham Court Road, back in July, to look around the huge Crossrail station there which is rapidly taking shape, with Crossrail (aka the Elizabeth line) due to start through the centre of London in only a couple of years.

There is lots of activity on the site, as would be expected, and at times it was tricky for the tour to move around, but eventually we made it to level minus 4 – platform level, and were able to walk the length of the platforms, as well as an intermediate tunnel that runs between them, to get an appreciation of the scale of underground Crossrail stations, which are noticeable bigger than their regular tube equivalents.

One real surprise for me was to see the distinct curve on the eastbound platform. It’s the only underground one in the Crossrail network, and was necessitated by the tight nature of threading the stations and tunnel tubes through the area – at one point, less than a metre from the Northern Line platforms there. The curve will no doubt provide challenges for the station cladding, as well as the automatic platform-edge doors that will be on all the underground stations on Crossrail.

tcr2

We also got a glimpse of the huge bank of escalators which will take people up and down from the station level. Pouring the huge slab of concrete to set not horizontally, but at the 30 degree angle of the escalators themselves, was another considerable engineering challenge.

Level -4 is not the lowest level, and we also got a quick look at Level -5, which runs underneath the platforms themselves and provides all the cabling and pipe infrastructure for the station and indeed the running lines themselves. No more cables running along the nice new tunnel tubes, or disfiguring the space age, Star Wars-like stations with their white acrylic panel sections and organic looking curves rather than corners.

tcr2a

It was also nice to see a glimpse of some rather pleasing looking concrete ceilings – they reminded me of the bold Euston Station ceiling that hardly anyone spots – sadly I suspect they will not appear “raw” in the finished station, but the green and orange glows of the worklights on them looked great.

tcr3

(By the way, I’ve been into the station construction site before, in March 2015.)

All in, a great tour of one of the stations that will be a significant addition to London’s transport capability, and looking forward to seeing the finished product at the end of 2018.

Categories
London

Open Doors: Bermondsey Dive-Under

diveunder1

The third tour I managed during the Construction Open Doors week of events back in June was to the site of the Bermondsey Diveunder. After visiting the (re)beginnings of a skyscraper, and a huge building development – this was something very different – a project building downwards, reusing old Victorian arches and the space between tracks on a very busy junction near London Bridge station, to allow for a “metro” frequency service into London Bridge and up through the centre of the capital to St Pancras – the so-called Thameslink Programme.

The project is building a “diveunder” – letting certain inbound services pass beneath outbound services elsewhere, so allowing a greater frequency of service. Essentially it is “grade separating” a busy junction, which happens to be part of the world’s oldest railway viaduct and once the longest viaduct of any kind, stretching over four miles from London Bridge to Greenwich.

diveunder2

From a historical perspective, it is nice to see that as much use of the existing, historic arches as possible is being made – the main part of the diveunder itself sitting on them until it ducks too low and they are replaced with smaller, modern ones, and eventually solid concrete. With the first big part of the new London Bridge station concourse opening up this weekend, things are starting to gear up and hopefully the extra capacity created by the diveunder will, in the short term, help to repair the currently badly suffering Southern services through the area, once it is opened in just a few short months.

diveunder3

The tour ended personally for me with a sour note – I returned back to find my bike was stolen. I’m happy to put South Bermondsey on my list of places to avoid in London in the future, except perhaps looking out of a train window at the new, sweeping lines that have been installed here.