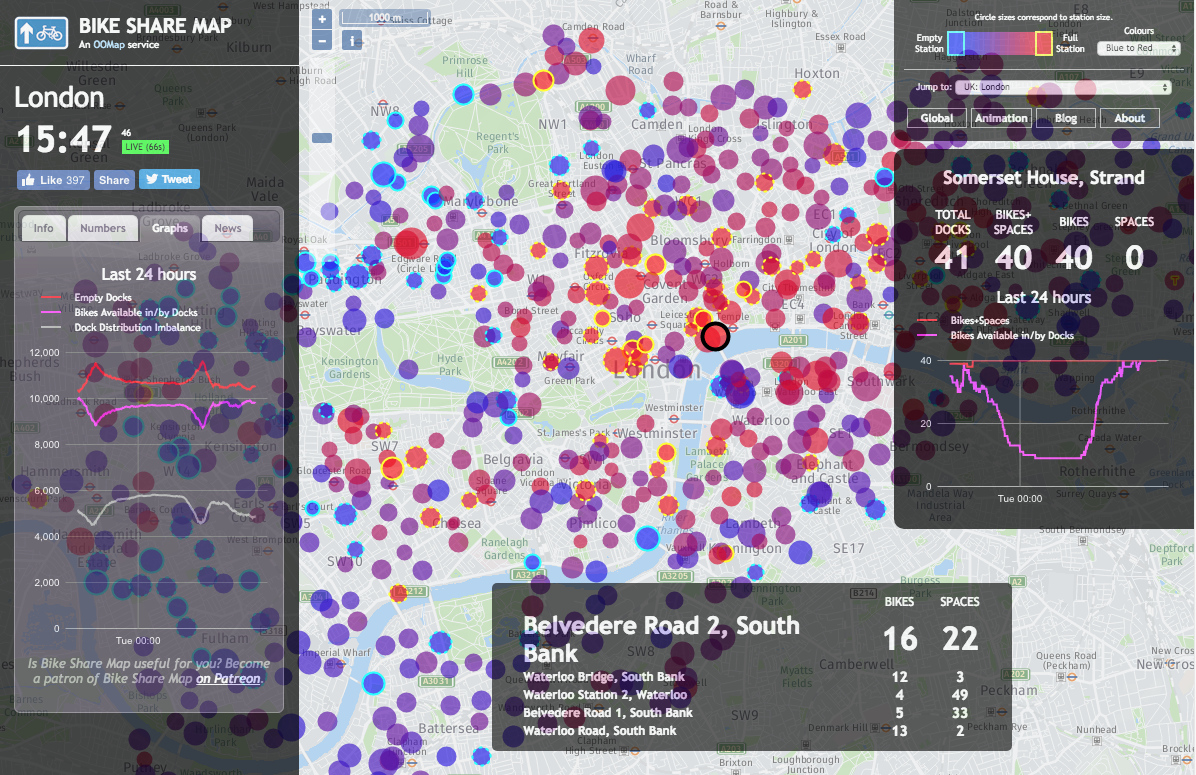
Bike Share Map shows the locations of docking stations associated with bicycle sharing systems from 400+ cities around the world. Each docking station is represented by a circle, its size and colour depending on the size and number of bicycles currently in it. The maps generally update every few minutes. There is a version that replays the last 48 hours of colour and size changes. In many cities, an ebb and flow of cycle commuters can be seen. Bike Share Map is complemented by a UK bikeshare news blog, Bikesharp.
See it Live
- Bike Share Map across the World (Live)
- Bike Share Map for London (Live)
- Bike Share Map for London (Timeline – last 48 hours)
About the Map
Bike Share Map was born out of wanting to visualise the shiny new London Barclays Cycle Hire bikesharing system (now known as Santander Cycles), which appeared in July 2010, shortly after I joined UCL CASA. The operator’s own map wasn’t very useful (it’s improved but still not great). I reused some code from an election visualisation (where circles were used to provide a balanced view across multiple constituencies) and got the system up running in a few days. Someone found out about it who lived in Minneapolis, and wanted to do the same for the NiceRideMN system there. I realised quite quickly that the two systems were built with the same technology, so the same data was available. Washington DC was Number 3, and it then went on from there.
There were data access issues with some systems (e.g. Paris and Brussels) but these days, such issues have been largely overcome, with the recent unveiling of the JCDecaux developer portal and Barcelona City Council making their feed available. B-cycle, who run many small systems in the US, have also been very helpful. I would still love to get more information on Chinese systems though…
I’ve continued to tweak and evolve the look of the site, adding a “Timeline” view in September 2010 that replays the last 48 hours of docking station changes, and most recently (June 2013) launched a global view of all the systems I am monitoring, which is has gradually increased from just under 100 to over 300 – there are more than 1500 systems in the world though, so this remains a snapshot.
Notes
The data is normally collected, and the visualisation updated, every two minutes. Some systems, which require requesting the status of each docking station individually, or appear to be on servers that struggle with repeated requests, are collected every ten minutes or even less frequently than that.
Bike usage numbers, where quoted, are simultaneous usage and normally include cycle redistribution. Actual total usage across the day will be much higher. Total bikes available doesn’t include bikes in use (obviously) but also doesn’t include bikes that are broken (if this information is available) or are being repaired or being redistributed. This is why the number showing is often lower – sometimes much lower – that the operator’s official statistic on the size of the system.
The distribution imbalance graph shows the number of cycles that would need to be moved to a different stand, in order for all stands to be the same % full. Higher numbers indicate a more unbalanced distribution, e.g. many bikes in the centre, few on the edge. It’s an interesting metric for understanding how “stressed” the system is.
While the website itself is cloud-hosted, the observations database behind the website is run on an academic development server and so is subject to occasional interruption. Please don’t rely on it for finding bikes or spaces!
Credits
Data: Generally the operator’s or city authority’s website, or via their official API where provided, particularly if the operator provides an industry standard GBFS-format feed. For a small number of cities I use a third party – most notably citybik.es, an excellent third-party data collector using PyBikes.
Background map: Data is © OpenStreetMap contributors. For some cities I use HERE maps as a background. For the OSM mapping, I use Mapnik, and the website itself makes heavy use of OpenLayers (amazing web API for drawing those circles).
Thanks: To BorisBikes forum contributors, Steve J Gray at UCL CASA and Aidan Slingsby at City GICentre, for their help and support.
Why’s my city missing?
There are 1500+ cities and other places with bikesharing systems, but the global map only lists ~300. Here’s why a particular city might not be there:
- The system is not a “third/fourth generation bikesharing system” – that is, one with automated, computer controlled docking stations (or dockless bikes) and designed for sharing of bikes, i.e. encouraging short uses of typically an hour or less. Example: University long-rental systems, coin-slot systems.
- The system doesn’t make available the necessary information on the web. The information needs to include an API, or a map with vector points (typically a Google Map) showing the locations of the docking stations, plus information on how many bikes are currently in each docking station. Example: Most Asian systems, and most modern app-based systems, particularly those run by mainly-escootershare-providers.
- The system doesn’t display the exact number of bikes at each docking station. Some older Nextbike systems in particular don’t have this information.
- The information is slowed or rate limited to stop repeated requests. Example: Lime has a quite strict rate limitation.
- The information available doesn’t update more than once a day.
- The system is too small for interesting spatial analysis research. I generally don’t including systems which have less than six active docking stations, unless they are in the UK.
- The system doesn’t currently have any bikes in it that are available for use, e.g. it hasn’t launched yet.
- The data is extremely unreliable, although I might persevere if it’s a very large system.
- The operator has been particularly proactive at stopping third-party reuse of the information, such as a third-party map like this. This has happened a lot for many systems in China.
- I don’t know about the system. If your city it doesn’t fall into any of the above categories, then let me know about it in the comments box below!
For a comprehensive world map of bikeshare systems, see The Meddin Bike-sharing World Map crated by R. Meddin and maintained by a global team of contributors including P. De Maio (co-founder) and myself (European editor).
Why’s my data on here?
Please email me at o.obrien (@) outlook.com to let me know your concerns. I am happy to stop collecting your data if desired, although only publicly accessible webpages and APIs are being used.
I would love to support this project!
Feel free to buy me a coffee or two at Ko-Fi.
Is the code open source?
No, because it’s pretty untidy and not particularly well designed under the hood. If you are really keen you can see the client-side source code, at least just by viewing source in your browser. There is another project which are open source and is building a unified system for collecting data from bike sharing systems around the world: PyBikes (Python). I use Python to collect the data myself into a MySQL database, and PHP and Javascript to display it.
Why do you do this?
The visualisation can be considered to be a auxiliary benefit of collecting data on bikesharing systems, which was used for research at UCL, by myself and some colleagues. It was useful for me, to check that the data coming in is good. Subsequently, the map has proven popular in its own right, so I have continued to maintain and update it as a general service to system users and the bikesharing community in general. Please note it is self-supported and hosted on an external server, and so liable to disappear at any time.
What about individual journeys?
Some operators or cities make available files containing individual journey data, normally every few months. These datasets aren’t used in this website, but I still collect them for use in current and future research.
Contact
You can contact me via Twitter at @oobr or by emailing me at o.obrien (@) outlook.com – or leave a comment below.
128 replies on “Bike Share Map”
The data for Plymouth seems to be showing proposed locations that don’t appear in the app. One in Elburton, one at Royal William Yard and all of the stations in Saltash don’t actually exist.
Some comments regarding South West schemes:
Exeter and Totnes Co-bikes are now extinct, the company has folded.
Falmouth is showing as Co-bikes when it’s now in a single “cornwall wide” Beryl e-bike system alongside Truro (not working), Penzance (working) and Newquay (not working). These are all actually a single system, you can ride from Truro to Falmouth and leave the bike there. I’ve noticed sometimes you can see the bikes left away from docking stations in Falmouth and Newquay, but none of the docking stations themselves.
Plymouth is working and a separate beryl system, but I’m just wondering about the graphs I see for each docking station. The line for “bikes available” and “bikes + spaces” always seem to track each other. When the bikes go up or down, the bikes+spaces follows when I would expect the bikes+spaces to stay constant most of the time. The number of Docks and Spaces don’t seem to be accurate. I’m not sure if that’s Beryls data being poor. The Beryl app only shows number of bikes, not docks, so I’m unable to compare.
Also It would be nice if there was a much simpler version that loaded on mobile, the menu takes up all the screen. I was out riding and the beryl app doesn’t always show the location of parking spaces, I’m sure I’m doing something wrong, but I tried to load your map just to help.
Anyway, enough complaining, I love the map, it’s really useful. Keep up the good work
I see you’ve fixed the issues with the Cornwall schemes, thanks.
But the Falmouth scheme is still showing as closed and labelled co-bikes on the Global map but when you click on it, it works great.
Great to see loads more docking stations in Plymouth now. Even spotted a Plymouth bike had made it to Dartmouth the other day, someone must have money to burn as that’s a 3hr cycle and then about £100 in fines for leaving it out of zone.
Hi Tim, thanks for spotting these, hopefully should all be correct now. I’m gradually working on a project combining the metadata from the Meddin Map and BSM which should cut down on incorrect data like this.
[…] Check out this global bikeshare map by O.O’Brien to find a bikeshare near you! You can learn more about the map and how it works, here. […]
this is a terrific resource for me in San Francisco, but how do I keep it in “map” mode and stop it from changing into “satellite view”?
Hi Jerry
The satellite mode switch is because I haven’t generated map tiles at those zoom levels (highly zoomed in) – it is on my todo list!
Thanks so much for the maps! Grateful to have this way of understanding my local bikeshare.
Hey Oliver, this is wonderful. Could you make it possible to Zoom in on the map than level 8? (Like maybe to 13?)
Also, have you considered an API that could accept a set of location coordinates, and return nearby bike-sharing data if available?
I’m currently creating a dynamic hyperlink, which inserts a user’s coordinate into https://bikesharemap.com/#/8/{lng}/{lat}/. If it turns out that lng/lat combination is within the radius of a bike-sharing service, perhaps an API could respond with some of the information that’s on the INFO tab of a given bike service? (e.g. Name, Website, could even add monthly price?)
I don’t know how much work this would be, but I would be up for helping add more data like the monthly price data — to show people right off the bat how much it costs and get them thinking about it.
Velo Antwerpen has no Twitter account anymore, but they do have a Facebook account.
Hi Oliver,
is there a way how to select those cities that have a specific operator ? For example, to know where and which bike-share systems are operated by Clear Channel.
Many thanks,
Sorin
I’m planning on putting such functionality in the Meddin Bike-sharing World Map, soon.
Why do you exclude OV-fiets? It has 300+ locations in the Netherlands, most of them fully automated. The ‘third/fourth generation’-rule sounds kind of arbitrary, especially combined with ‘typically less then an hour’. OV-fiets is one of the largest bike-sharing systems in the world? Why would you exclude it? Only because the system works slightly different then in countries where ‘normal’ bike use is far lower?
OK, added it in: https://bikesharp.com/netherlands/
Dear Brien,
Could you please explain about distribution imbalance a bit. Do you calculate each station’s docks percentage of the whole system? And then you take bikes in-by docks and distribute them according to each station % size? Right?
What is the best practice for relationship between number of docks of a station and required amount of bikes within service area of the station? Number of bikes * 2-2.5 = number of docks?
Regards,
Yerbol
HI Yerbol, yes, that’s pretty much it. Your formula for the best relationship is also pretty much correct (for the “traditional” docking station with a hard capacity limit)
nice
Don’t know how to contact the admin, but there’s on of these bikes abandoned in Crescent Lane, London SW4 9T, outside No 17. Something’s been ripped off the rear, but it still works. Could this be passed on please so that it can be recovered?
A dockless bike? (orange, yellow or green). If so, I’m afraid that, anecdotally, the operators generally aren’t that bothered about recovering them. If it’s a red bike, then TfL/Serco would I am sure be very grateful to get it back – contact TfL to arrange.
Hello,
Gijón city (Spain) bikes-sharing system is opered by JCDecaux. It has changed all its bikes (80 ud.) and stations (8 ud.) last month of march 2018. The use of the bikes has increased in an exponential way… Each bike has a rotation rate of 8 rentals a day. What a change !
It would be great to see the map in this website…
Hi, I would be interested in adding Gijon, however it appears that it doesn’t appear on the JCDecaux open data website at https://developer.jcdecaux.com/#/opendata/vls?page=static
Hello! I am Peter Zhuang and I am very happy to tell you about the YouBike public bicycle system in Taipei. Currently in Quanzhou and Putian City in China, it has officially served. I hope that you can include the information of these two cities in these websites.
You can collect your own data just like collecting Taipei data.
Quanzhou website: https://www.youbike.me/cn/index.php
Putian City website: https://putian.youbike.me/cn/index.php
If you have any questions: Please contact me at: PeterZhuang@giant.com.cn
Dear Peter, thanks very much, I have added these ones now.
Hello Brien,
Amazing website! It helps visually understand dynamics.
Could you please describe what is “Load Factor” and how you compute it?
Regards,
Yerbol
Hi Yerbol, Load Factor is number of bikes divided by total number of docking stations, expressed as a percentage. Load Factor of 50% = half of the docks have bikes in them and half are empty. Cities generally aim for around 45% however quieter systems or ones with less commuter activity (or quieter times of the year, e.g. winter) can generally go up to around 55%.
Hey Brian,
Amazing tool you have created here. Just wanted to let you know that Fort Collins, Colorado has also implemented a Bike Share Program.
http://bike.zagster.com/fortcollins/
I am writing my masters thesis on Bike Share systems, and your blogs, map and papers have been of immense use.
Thanks,
Mohsin Sayed
Burlington, VT USA has just launched “greenride bikeshare” based on the Social Bicycles technology.
http://greenridebikeshare.com/
Thanks. Can’t find an open data feed for it (e.g. GBFS but doesn’t have to be!) Is there one? e.g. https://grid.socialbicycles.com/opendata/
Hi Oliver,
First of all, congratulations for the website. As a bike-sharing enthusiast, I love to spend some hours a week to check some systems.
I have one specific question as a researcher. What do you mean and how do you get the values to Med Neigh (D) and Density (D)?
If the first is average distance between stations, it does not coincides with the second. Since a 6 st/km2 is very scattered and would not result in 113 m in spacing (Hangzhou example).
I’d appreciate if you could clarify this 🙂
Best regards,
Guilhermw
Many Systems in Brazil are now PBSC’s and have to be updated.
Rio de Janeiro
São Paulo
Salvador
Recife
Porto Alegre
Best
Zá Lobo
It is very helpful for researchers. good initiatives were taken. well done.
[…] O. (2013). Bike Share Map | Suprageography. [online] Oobrien.com. Available at: http://oobrien.com/bikesharemap/ [Accessed 10 Feb. […]
Very interesting project! Thank you for sharing.
The API of Santiago de Chile (https://api.citybik.es/v2/networks/santiago) provides only very old data. do you see a possibility to correct this?
Cheers!
Stefan.
Citibik.es is a third-party API. The official operator, city or technology provider does not provide the data as an API. The technology provider (B-cycle) used to, but not any more it appears. I will investigate whether I can find another source.
It looks like BikeSantiago no longer provides any online data about its fleet. However, the Bici Las Condes system does, so I’ve now added that one in – http://bikes.oobrien.com/santiago/
here is Pittsburgh’s feed. Its a nextbike system. You’ve probably already learned to ignore the ‘bikes’ attribute and instead subtract ‘free_racks’ from ‘bike_racks’ to determine bike availability using the nextbike feed.
https://api.nextbike.net/maps/nextbike-live.xml?&city=254
Pittsburgh now online. No need to do ignoring the bikes attribute, as the Pittsburgh system is using the newer Nextbike platform which does report the correct number of bikes available.
Honolulu launched today!
http://gobiki.org
100 stations, 1000 bikes. PBSC system.
Would love to know if there’s anything we can do to get Biki added here. Is the feed not available? If there’s a technical hangup, I’m happy to try to lobby them to open up the feed.
Super interested in being able to follow the project’s roll-out and success. The data from your site truly helps inform conversations with bikeshare critics.
Friendly follow-up request for Honolulu’s Biki. Still would love to have it here!
Hi Joey, sorry, I haven’t book looking at this page that frequently really, but I’m putting Biki in now! http://bikes.oobrien.com/honolulu/
Have you considered quality metrics other than the Distribution Imbalance chart?
For example, if no station ever goes empty, any imbalance doesn’t really matter. (This is assuming the system allows returns to full stations – otherwise, full stations are worse than empty stations.) Although, a group of two may perceive as empty any station with just one bike… Further, an empty station doesn’t matter if nobody wanted to rent a bike there then anyway.
Hi, most systems don’t allow returns to full stations (I know a few do). I agree that the Distribution Imbalance is of limited practical use “on the ground”, i.e. for users, however it offers a relatively simple summary of the state of the whole system and is easily comparable between systems.
Quito, capital city of Ecuador, has a public system bikes since july 2012, with more than 500 available bikes and more than 20 stations
Oklahoma City has recently changed to Bcycle so should now be able to access their data.
http://spokiesokc.com/
What about encircle in Medellín city in Colombia south america?.
Medellín was called the most innovative city in the world, have a map in google map with information about toking stations and bicycles and its a 3rd gen system.
EnCicla
http://www.encicla.gov.co
Hi! I found that my city, Budapest is on your map, it’s very great. I would be interested in the numbers of the rented bikes per day, can you do graphs from your data about it? That would be awesome 🙂
Thanks!
Mamlobybike.se launches today powered by Clear Channel
500 Bikes and 50 docking stations
12 of these stations allow sign up and payment at the bike station
24 hr & 72 hr subscriptions available as well as Annual membership
Hi! Helsinki launched few days ago: https://www.hsl.fi/en/citybikes
Thanks! Added now – http://bikes.oobrien.com/helsinki/
Dear Oliver,
I am a BSS user from Barcelona and I am personaly interested in the maths behind BSS. Particularly, I would like to study Incentive-Based Rebalancing.
It is great to see the amount of data in the map. I wander if there are metrics on the performance of different cities. Something like a “ranking” of cities with the best balance but maybe it is not easy to define what metrics to use.
Thank you so much for your work, this site is really great!
You might look at the thesis of Eoin O’Mahony from Cornell, it can be downloaded for free and it seeks to optimise the rebalancing of bicycle numbers for a scheme in New York.
This fellow suggests a way of accessing historical data for the Dublin bike scheme. JCD don’t seem to make historical data available, I am not sure about their motives, but let me know if I am mistaken on this.
http://www.shanelynn.ie/scraping-dublin-city-bikes-data-using-python/#more-222
Guinness bribe:
I use the bicycle sharing system in Dublin and the stations near my home are invariably bereft of bicycles much of the time from 08:30 until 10:00, and quite sparsely populated for most of the day. The stations become packed after 17:00 and it is difficult to drop off a bicycle then.
I suspect there are major inefficiencies and poorly planned rebalancing here in Dublin. I discussed this with someone who used a scheme in Valencia, Spain, and they never encountered such severe difficulties there.
If anyone can optimise the “rebalancing” act of Dublin bikes I will be very grateful and buy you a Guinness or ten!!
Dear Oliver,
Great to know about your efforts to gather bikeshare data from around the world and display the stats in your website. I’m glad to discover your website recently. We are currently operating 11 bikeshare stations in Yas Island, Abu Dhabi and very soon expanding to 50 new stations in the city. We would like to have ADCB Bikeshare on your map.
Thank you
Could you please include SoBi bikes here in California (now in Santa Monica, coming to Long Beach, West Hollywood, Beverly Hills, Culver City & Westwood soon). CycleHop is the operator, but Social Bicycles manages the backend API. Keep up the good work – you have fans here at UCLA (Urban & Regional Planning Dept)!
https://app.socialbicycles.com/developer/
Thanks – yes I am hoping to have those in soon if there is a suitable data feed. However please note that the API link you sent there is for retrieving individual data about a single user of the system, rather than an overall picture of the system.
You may consider adding City of Hamilton into your list since it matches all of your criteria. It was launched in March 2015 and become one of the most successful bike-share program in Toronto region
https://hamilton.socialbicycles.com/
I’m wondering if there’s a way to bring back the chart showing the bicycles in docks over the last 24 hours. The overnight value of this is a good way to get a good estimate of the number of bicycles in use in the system. Without that chart, we must simply speculate about the number of bikes in use or use the reported number from system operators, which is usually much lower and varies from operator to operator.
Hi Jacob, the maps are intended as visualisations of the movements, and are not intended for quantitative analysis/use – hence why I am gradually removing the graphing/numeric information from the maps. It’s a significant burden to maintain the system, the more so if people assume it is reporting exact and correct numbers.
Hi
I’m wondering why Pisa is featured, although you specified that its operator bicincitta is very proactive in limiting the usage of their data. I was about to complain on their facebook page about this unfriendly behaviour of theirs, then I noted this seemly contradiction.
By the way, nice work. We work in transportation planning here in Switzerland and were delighted to discover the bicicle map, even though only Luzern is shown.
ciao
Operator policies change – currently only the South America operator is actively blocking me (and indeed all of UCL) which means the systems there are being shown via a third party. I would like to fix some of the changed Italian systems and add in other systems, e.g other Swiss ones, but the map is just run as a hobby and my time is rather limited at the moment. I am hoping to be able to do more later this summer though.
Hello,
I would like to know how our bike share system (Vilamoura, Portugal) can join your global map information.
Thanks
Hi Paulo, I don’t think your system has a map with docking station sizes and current numbers of bikes in them, only a PDF, I think, but please let me know if wrong.
Why is St. Petersburg missing? It uses the same system Moscow had before 2014. Their website is http://spb.velogorod.org/
Hi there,
Wunder , why Helsinki is missing?
Auni
As far as I’m aware, there’s no bikeshare there currently – the old one stopped in 2010.
There’s a new system in Fortaleza, Brazil. Started in december, 2014. It’s been very sucessful, reaching 5 to 6 travels per bike, the best number in Brazil.
Website: http://www.bicicletar.com.br
Stations: http://www.bicicletar.com.br/mapaestacao.aspx
Thanks, Gustavo. Unfortunately Mobilicade has blocked access to all its websites, from University College London computers, so I am unable to access the Bicicletar website or add it to the Bike Share Map 🙁
[…] Uma outra opção mais interativa de mapa pode ser encontrada clicando na imagem abaixo. Existem mais de 600 cidades e outros territórios com sistemas de bicicletas compartilhadas, mas este mapa global só tem cerca de 100. Algumas razões estão listadas aqui pelo autor. […]
[…] has a blog that includes a post about the bike-share map in which he writes about things like where the data displayed in the map come from, and why some […]
Hi Daniel
Great map!! I am a student at Ryerson University studying Applied Digital Geography and GIS. I am in the process of making a web app for one of my assignments and would like to use the live feed from the Toronto Open City Data portal of the bike share locations http://www.bikesharetoronto.com/data/stations/bikeStations.xml. I have tried adding this live feed but with no luck. I am building an app using the Esri Leaflet api and incorporation layers from CartoDB. This may be very cheeky but I just wanted to know if this is the georss feed that you are using or something else. Any advice would be appreciated!
Kind regard
Kathy
Hi Kathy. Ollie here. Yes, this is the source I’m using, although the data is plain XML rather than GeoRSS, I think. Leaflet is by Mapbox but there is an ESRI plugin for it.
Hi Ollie
Thanks for getting back to me. Still struggling to load that feed! I can’t seem to find the Esri plugin. Is it part of the dojo toolkit?
Best
Kathy
OK I think I understand now. The feed isn’t designed to be put straight into a GIS or web mapping applications, because it’s not a “geo” feed – rather, a regular feed which happens to have some geo information on it. In theory, you could apply a custom XSLT transformation in order to turn it into a GeoRSS or other XML-based geo feed, which might then work. I’ve never done this myself unfortunately. I consume the data into a database and also create a custom CSV file, which is then read in by my map – this is all custom though, I’m not using any geo standards, although I’m considering rewriting my CSV as GeoJSON if I get some time over the forthcoming break. Re ESRI Leaflet plugin, I’ve not used it but it’s this: https://github.com/Esri/esri-leaflet
Hello,
I have found this article while searching for open source bike share. Thanks for the visualization. We have launched the first open source bike sharing system. It is currently running a pilot.
Hi Daniel – thanks for the link, that’s a very interesting looking system and concept. Good luck, I hope it flourishes!
Hi,
I just updated a wiki entry and came across your page too.
Please note that Glasgow and Stirling both have now bike share schemes operated by NextBike which I believe to not fulfill any exclusion criteria of your list.
https://en.wikipedia.org/wiki/List_of_bicycle_sharing_systems#Scotland
Nice map!
Phil
Thanks Phil. Unfortunately most NextBike systems (except ones using their newest technology) don’t show the exact numbers of bikes at docking stations, if it’s more than 4 – this makes it not particularly useful for O/D analysis, unfortunately.
This doesn’t necessarily preclude me adding them in at some point but it does mean they are in the lower down in the priority list.
New system just launched in Milwaukee:
http://bublrbikes.com/try-now/suggest-a-location/
Thanks – looking to add this in and some other new systems, when I get some time to do that.
[…] Bike Share Map […]
Hi Oliver,
Taipei YouBike OpenData API was updated again from 27 May unfortunately.
Try the following link: http://opendata.dot.taipei.gov.tw/opendata/gwjs_cityhall.json
and the data is updated every five minutes.
Enjoy : ) Thank you for your great work and it really inspires me a lot for master research.
Thanks very much for the new link, Chun-Yen. I am now consuming the data and the Taipei map is back online.
Hi Oliver,
Thank you for all your hard work. Just a quick note to say that your Toronto bikeshare data doesn’t seem to be coming through; the map is blank.
Cheers and best,
Allen
Thanks – the data feed for it had switched to Montreal. I’m now using the new website for the Toronto system which has the correct feed.
Apparently the Antwerp system is not slowed down anymore (or so I’m told by @VeloAntwerpen). Hoping you can get them on your map too 😉
Great work !
Thanks, great news, I will take a look!
The map’s lovely on a desktop, but it doesn’t render very well on my mobile.
With yet another London tube strike looming it’d be really useful to be able to find the nearest bikes available (a mobile could give you user location too).
Hi!
Taipei YouBike Website was upgraded, you can’t get data again.
but you can get data from http://210.69.61.60:8080/you/gwjs_cityhall.json (5 minutes updated) , try it !
thanks!
Hi iloveu – Thanks very much for that! I’m consuming the new data link now. Taipei is a really interesting system because of its very high usage peaks, so it’s great to have it back again.
[…] More detail on Ollie’s site here. […]
Hello Oliver!
Just so you know, we have a couple other bikeshare systems that might be of your interest:
Salvador (currently 30 stations, will have 70)
Petrolina (currently 10 stations, no current plans to expand)
Other than that, we’re excited about Rio’s expansion, which starts this month: 200 more stations, though it’s going to be a very slow process! São Paulo is growing fast, and should have 300 stations by the end of 2014.
Recife’s already saturated, and we’re starting to consider expansion plans. The city is almost 100% flat and has a very cycling-friendly climate.
I’ve been following your work very closely, always exciting.
Best regards,
Thanks again, Pedro! I’ve now added in Salvador and Petrolina. It’s great to see so many systems in Brazil, it really lights up the global map now at http://bikes.oobrien.com/ – I look forward especially to São Paulo’s continuing expansion.
Hey Oliver!
More news from Brazil: we just started operating our newest city, Aracaju. We’re starting with 5 stations but should have a full 20 working by June. Here’s the map: http://www.cajubike.com/Default.aspx
Furthermore, we’re hoping to adding a couple more cities to the service, including our first international city!
Regards,
Hi again Pedro. Great to hear. I’ll look to adding in Aracaju in due course, once it becomes larger, although it looks like the file format is different to the others. Also great to hear about a couple more cities on the way.
Just wondering why San Francisco isn’t included here; the system is quite new.
It is included, although named as “Bay Area”.
Hi Oliver, What a great tool! Austin, Texas, USA recently began a bike-share program and has launched 11 stations so far: https://austin.bcycle.com/station-locations/
Thanks – it’s on my list to add soon, subject to being able to agree to the T&Cs!
Hello, nice site! you might be interested in this webapp, written by two of my co-workers in the GIS group at the NYCDOT, using Leaflet: IRide NYC
You may want to look into whether Rome’s system is still active. I just returned from a trip there…I saw several of the docking stations, but not a single bike. The stations seem to have been given over to motorbike parking.
Agreed, it is looking pretty dead. I’ve removed it for now.
Hello! I’m wondering why BikePE, Recife’s third generation system, isn’t on the map. We’re still installing the remaining stations but when we’re done, by October, we’ll have 70 stations and 700 bikes.
You can find more info here: http://www.bikepe.com
If you need any help, I’d be happy to be of service. I work for Serttel, the company responsible for all bike sharing technology in Brazil and we have many other important cities that still don’t show up in your amazing map.
Regards,
Pedro
Hi Pedro – It only wasn’t there because I didn’t know about it! It’s in there now. I also have Rio, Sao Paulo and Santos – any more big ones I should add?
Dear Pedro.
Glad to write to you.
This is Eunice from JHC, we are the embedded computer manufacturer for 11 years. RD center in Taiwan.
Items meet CE, FCC certification and widely used for self-service kiosk of bicycle sharing system.
Its rugged case and high reliability support 24*7 non-stop working under harsh environment.
Please let me know if you have any interest.
Best Regards.
Hi, what do I need to do so that the bike sharing system from Vilamoura (Algarve / Portugal) show’s on the map? Do you need database access, API interface or other data ? Thanks in advance for your time
Hi – if there’s a publically accessible map of docks with empty/fill states, or even better a REST API, that would be great – please let me know a web link and I’ll take a look.
Example of live map: http://www.thehubway.com/stations
Example of API: http://api.easybike.gr/cities.php
Hi!
It’s great to see a lot of this data becoming open for public use and research!
Personally, I would really like to use this kind of data in my own research on modeling spatiotemporal phenomena and study the spatial and temporal relationships that can be learned from this type of data.
Therefore however I would need historical data (ex. station usage per 15 minutes in the last year), not just live data. The JCDecaux developer portal doesn’t seem to offer that. Is there any service or portal that offers this kind of data, any plan for a portal to do so in the future, or a website/database (or plan) that logs the live data?
Hi Manuel. Some systems offer historical data but not AFAIK JCDecaux (yet). I have some historic dock data for JCD systems which could potentially useful for if we collaborated on a paper?
Germany is yet stil a white spot on the map 🙁
In Germany there is a huge bike operator nextbike (nextbike.de).
Aside the German cities they also operate bike systems in some other cities worldwide.
Forgot to mention the website on https://www.nextbike.de/en
Thanks Karl. Unfortuantely Nextbike systems don’t report the precise numbers of bikes at a docking station – if there’s 5 or more, they just say 5+. Therefore it’s difficult to visualise movements of bikes around the docking stations. Hence they are not included.
I understand the issue with Nextbike. But why are you not including Call a Bike ( http://www.callabike-interaktiv.de/ ) which is the system of Deutsche Bahn, and available in many German cities. Their map indeed shows exact numbers, and – if not via API – are available via JSON scraping.
Or is that due to them being “particularly proactive”? 🙂
The Call a Bike interactive map is quite new – believe me I looked for it at various phases of expanding the map. Unfortunately it looks like it’s quite a lot of work to actually get hold of the data – it’s not a simple JSON scrape but looks like it needs carefully crafted post requests. If a 3rd party puts this data in a more accessible form then i will be happy to add it.
Citybik.es API has call-a-bike support now. It would be great to have it in the map. Can you add it?
Ah, that’s disappointing – I just dropped by to let you know that Glasgow’s bike hire system launches tomorrow – but as it’s operated by Nextbike, I guess that means it’s not going to be easy to include it on your site.
Ah well!
Nice initiative, though you are missing lots of places obviously even with the criteria mentioned above. But for starters I would suggest adding the Netherlands at least – its only the most cycled city in the world, and with bike sharing programs in various cities not to mention the rentable bikes from the nationwide train service (NS). So dig into that. and I’m sure with all the feedback here you will be expanding daily! =)
Sameer – please list a city which is not on the map but fulfils the criteria! I don’t believe any of the Dutch ones do but I am happy to investigate a specific one if you’ve checked and think it does!
Dear Oliver,
we have deployed 9 Systems and are currently operating 7 of them in Greece, among which the one of Maroussi, Athens.
Would you be interested in us providing with all necessary data and update your map?
What is exactly the source of your info about Maroussi?
I will be at your disposal.
Regards
Harris
Hi Harris
I’ve getting the info from: http://maroussi.cyclopolis.gr/index.php/en/stations
I’m happy to add in any more systems that have at least six docking stations.
An API would be great, yes, such as http://api.easybike.gr/cities.php
Hi, Just discovered your excellent site.
Have you considered adding my hometown Trondheim, Norway?
It is run by ClearChannel, like Oslo, and data seems to be available.
http://www.bysykler.no/trondheim/kart-over-sykkelstativer
Hi – I added Trondheim recently, but the data didn’t seem to be being updated, so I disabled it for now.
[…] global bike share map pulls data every 2-10 minutes from each of the city’s bike share operators. Data is pulled from the city’s API or […]
[…] a blog post, O’Brien explains that the data is updated automatically every two to 10 minutes, noting that […]
Typo in line “Bike usage numbes, where…..” – should be ‘numbers’ .
Great visualization of big data!
Thanks Michael – and typo fixed.
[…] called OpenStreetMap, which seeks to create a Wiki-style map of the world. Click here to view tech specs for the bike share […]