
I was in Prague at the end of last month for the final OBIS Project meeting. OBIS was a multi-year European Commission project to study and document bike sharing systems in 10 countries in the European Union.
The project’s handbook was presented at the conference, and there were a number of talks from various cities on their own schemes, as well as some external speakers. I found the Barcelona one, given by the operator, particularly interesting – it focused on the difficulties they have with redistributing enough bikes to a densely populated part of the city with narrow streets. By switching to a hub-and-spoke model, they were able to significantly improve the effectiveness. London was covered by the CTC (Cyclists Touring Club) who presented on Transport for London’s behalf. The project actually covered the UK before London’s Barclays Cycle Hire launched, so focused on the smaller schemes in, for example, Cardiff and Blackpool. However London did make it into the final handbook. Stockholm’s presentation touched on the logistical and political issues there, particularly as regards finding space for docking stations – their scheme is therefore still at just 50% of its planned size/density.
Other sessions had insights into the differences between station-based systems and “leave whereever” schemes. The old Berlin system, which is just being switched to station-based docking, used to allow bikes to be left at any crossroads in the scheme area – fine in principal but Berlin has a very large number of crossroads.
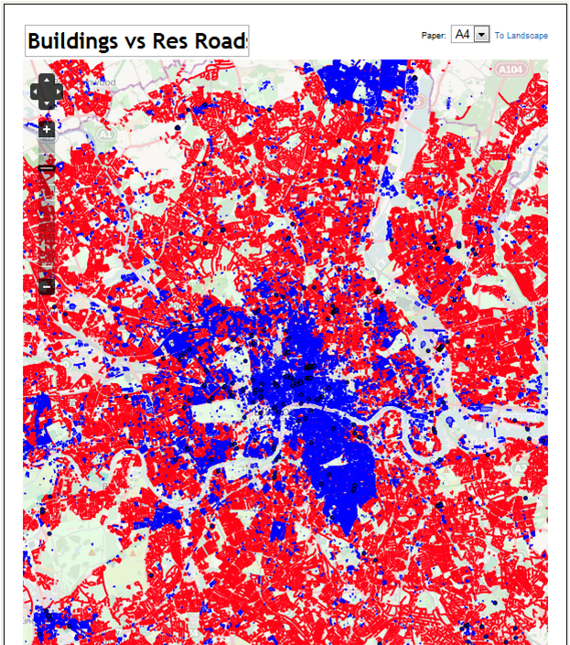
As an external speaker, I presented on visualising bike shares around Europe and throughout the world, mentioning my own Bike Share Map as well as introducing some more complex work being carried out by others in the research lab here. I also went into detail on the excellent range of data available for the Capital Bikeshare in Washington DC, and touched on Hangzhou’s huge system, and London’s new official API. A slide from the presentation is above, I’m not posting the whole presentation yet though as it contains some forthcoming work from others here.
The session that launched the handbook outlined some interesting insights from it. It is useful to class European cities as “warm” or “cold” (p31 of the report.) Warm cities generally have two peaks in bike share usage a year – spring and autumn – it being too hot in the summer for mass usage. Cold cities peak in the summer, and often drop off completely in the winter and snow and ice takes over.
European countries were also categorised according to the cycling culture there – it is probably fair to place Germany in the top category, but I was somewhat surprised to see France in the middle one and the UK in the bottom one. Cycling in London has improved a lot over the last few years – even if transport planners insist in putting the cycle lanes on the roads and not the pavements – in fact I spent most of yesterday cycling in Paris – blog post to follow – and felt there were fewer (non-Velib) cyclists around than in London. Talking of Paris’s Velib, one tidbit I didn’t know about until I read through the handbook (p.61) was that the operators in Paris run a barge (!) up and down the Seine, on which they fix Velib bikes and at the same time transport them to where they are most needed. Kind of like a French version of the Travelling Post Office.
Prague doesn’t have its own full scale bike share system (yet) and the “modal share” of cycling is much less in Prague than in many other European capitals. There is a very small trial bike share in the city, I didn’t spot it. There were hardly any bikes on the streets, at least in the central part of the city I saw, although the route along the riverbank was reasonably popular when I passed and has a dedicated cycle path. There is one thing better than London though. A photo of the riverside route is below – if this were London, the bollards would be in the cycle path rather than in the pedestrian lane.
You can download the OBIS handbook from the offfical website.


 On the Thursday evening that we arrived,
  Our final trip was more ambitious – four of us OSMers headed right through the old city, past the cathedral, and eventually into the more commercial part of the city, then underneath the huge Praterstern station and right up to the Danube. Here, there is a dedicated cycle track underneath the road bridge. The bridge is however quite a way beyond the area of docking stations, so the other cyclists around were on more serious bikes.

 Muki Haklay gave an overview of his team’s completeness analysis for the UK OSM dataset over the years. We used to say we “are good enough”. Now we can say that, subject to qualifications, we are “as good as” some traditional datasets. There was also some similar research presented by Heidelberg University, which used hexagonal cartograms, which was an interesting change from grid squares. I should also mention Steve Coast’s keynote, which was a frank statement of the current state of play of the project – good in many places, but problems with the Australian community feeling disengaged and looking to split from the project were clearly top of his mind.
 The social side of the conference was excellent. Plenty of breaks for networking, and a conference dinner on the Friday night. This involved everyone getting a couple of specially hired 1920s wooden trams (or “Bims” after the sound their bells make) to a suburb of Vienna – via the grand ring-road, past the various palaces and other grand buildings – whereupon we took over most of a restaurant for an Austrian feast of Wiener schnitzel, meat loaf, sauerkraut, picked cucumber, and a dessert of apple strudel. A few resturant-brewery combinations were also visited during the trip – along with some most refreshing lagers, served in proper glasses with handles that make a lovely “clonk”. Vienna was very warm indeed, with a thunderstorm on the first night. It was also eerily quiet – the city is quite grand and spaced out, plus maybe many of the locals were on holiday to the mountains. Certainly the people we met were friendly. I should mention specially the conference organisers, which were flawless and ensured everyone was in the right place at the right time! The organisation of the conference and social events appear to go off without a hitch.


 The exhibition is in three main sections – downstairs there are a number of big screens, showing the aforementioned animations. The area is quite dark, so the graphics have come out really well. The second section is up a spiral staircase (easy to miss) where a number of touch-screen computers show more visualisations from CASA and others, each selectable by the user. The system that runs this will allow us to update the animations during the course of the exhibition, so if we do some newer related work, you may well see it here! Behind this is the last section, which is more conceptual, with a number of “visions of the future from the past” magazine covers, and other bits of futuristic transport technology – a Sinclair C5 and a “Ryno” one-wheeled motorbike. Sadly a Barclays Cycle Hire bike is not there in the flesh, but you
