Contributors to OpenStreetMap in the UK have been gradually importing in the NaPTAN dataset of the locations of bus stops (amongst other things).
Many, but not all, of the local authority areas, have now had their bus stops imported in to the OpenStreetMap database in this way. These, and the other areas, also have bus stops shown that have been manually added by contributors based on ground observations.
In areas where the roads have not been added into OSM (and there are still plenty such areas, where there is no accurate aerial imagery to trace from, or contributors on the ground with GPS) the bus stops will appear disconnected from any road on the map. Large numbers of these “orphaned” bus stops in an area are indicative that key roads or even whole villages and towns are missing from the map.
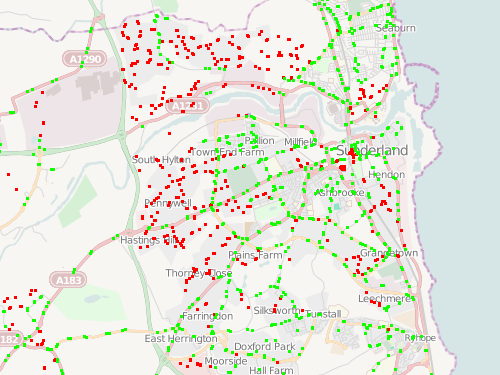
To aid discovery of such roads and towns, I’ve created a simple visualisation. Bus stops appear as green dots if they are within around 20m of any highway (this does include cycle paths, paths and railways, but in general if these features are present, nearby roads would be too). Stops that are further away are shown as red dots.
The visualisation can be seen here. The mapnik stylesheet used is here (XML) – Mapnik 0.7.0+ is required because of the !bbox! usage, and the generic entity stylesheets used in OSM/Mapnik are also referenced.
The tiles are generated directly from my copy of the OpenStreetMap “planet” database, using Mapnik to call PostGIS with a spatial query. The process of calculating the bus stop statuses is reasonably CPU-intensive – for each bus stop, a buffer around the stop is created and then line-in-polygon tests are done on all roads in the area using a spatial index. PostGIS makes the process straightforward – ST_DWithin is used for the buffering, and ST_Intersects is used separately on the stops and highways to restrict the search to the local area.
To reduce the complexity of the query, the cut-off distance actually varies slightly – the coordinate reference system used is “metres” in EPSG 900913 – the so-called “Google” projection. The “metres” are only 1m long at the equator – away from it, they are shortened by a factor of cosine of the latitude, so for UK latitudes, 30 EPSG 900913 metres are equivalent to between 14 and 20m, decreasing as you travel north.
The results show some key towns in need of more roads, such as Cleethorpes, Kidderminster and Thetford, while much of the town-to-town network in SE England is pretty good. The process does assume the bus stop locations are correct, which is not necessarily the case, and also for very wide roads, the bus stops in real life may be further away than 20m from the road centreline, and so incorrectly shown on the visualisation.
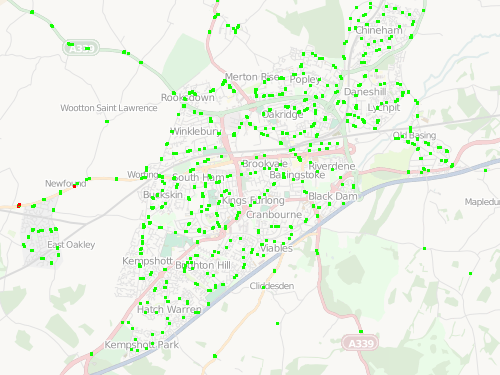
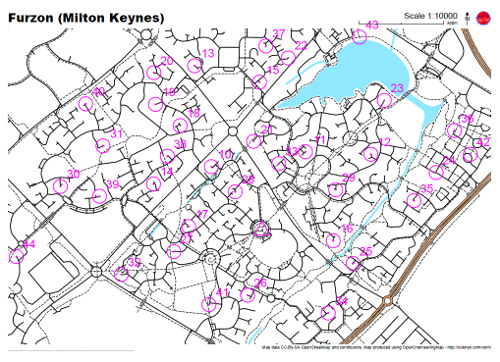
Basingstoke is looking pretty good:
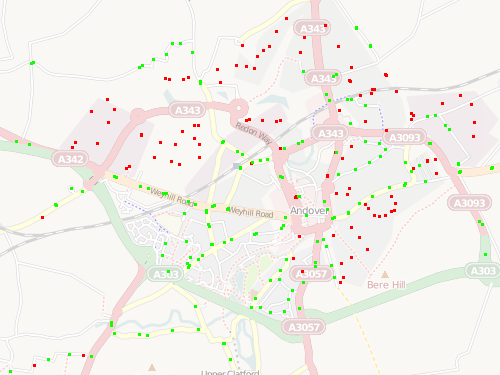
But nearby Andover needs more mapping:
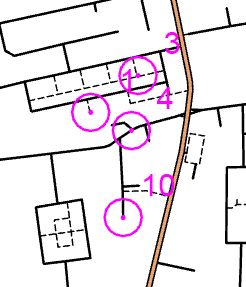
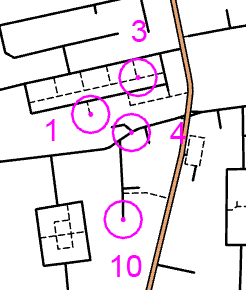
In places, the density and linearity of the orphaned bus-stops means that, in theory, a road could be added to OSM based solely on the pattern of stops in these places.
Try it out here [now offline].