Categories
Bike Share Data Graphics

A Glimpse of Bike Share Geographies Around the World

[Update – now including a much larger version.] Below is the image I submitted to this year’s UCL Research Images as Art exhibition. You can see it, and around 300 other entries, in the South Cloisters on the UCL campus in central London, for the next few days. A larger version can be viewed here. The image purposely has no explanatory text as it is intended as a piece of “infogeographic art” rather than as a map. It is derived from the dots for the various cities on my bike share map.

It shows the “footprint” of the docking stations making up 49 bike share systems around the world. The colours represent the empty/full state of each docking station at the particular moment in time when the image was made. The numbers show the total number of docking points – each docking station being made up of one or more docking points, each of which may or may not have a bike currently parked in it.

The geographies and topographies of the cities themselves inform the shape of the systems – particularly coastal cities (e.g. Nice, Rio, Barcelona, Miami Beach) and ones with large lakes mountains near their centres (e.g. Montreal).

A subtle but important point on the scaling: The scales of the systems (i.e. each system footprint and the spacing between docking stations) are roughly comparable – they actually vary by the cosine of the latitude – these means that the more tropical systems, e.g. Mexico City’s, appear to be up to ~20% smaller than they actually are, relative to the majority which are generally at temperate latitudes. However, the sizes of the circles themselves are directly comparable across all the systems, i.e each pixel on the graphic represents an equal number of docking points, regardless of which system it is in.

Categories
Bike Share

Massive Christmas Day for Boris Bikes

Christmas Day this year recorded far and away the highest ever simultaneous usage of the Barclays Cycle Hire bikes, aka the Boris Bikes, probably meaning it was the biggest number of hires in a single day too. The lack of any Christmas Day tube or bus service in the capital is the obvious reason for the huge usage spike. Previous popular days for the were the four tube strikes in late 2010. Both these events can be seen in the graph above. There is a diamond for each day, showing the difference between the maximum number of bikes available at a point in the day (typically at around 3am), and the minimum available (typically around 4pm for weekends or 9am/6pm for weekdays). Christmas Day was the big jump on the far right of the graph. The jump is much bigger than for Christmas Day 2010, as that day was pretty cold and snowy and only especially hardened tourists would be using the bikes then.

The top days are (measured by maximum closed-system simultaneous usage, i.e. maximum number of Boris Bikes out of the docks and rolling around the streets in a single moment, assuming no removal or addition by the operator that day):

  • Sunday 25 December 2011 – 2065 (Christmas Day – no tubes or buses)
  • Sunday 2 October 2011 – 1795 (Late summer heatwave)
  • Thursday 3 February 2011 – 1791 (?)
  • Tuesday 15 March 2011 – 1649 (Likely false result – mass removal)
  • Saturday 1 October 2011 – 1627 (Late summer heatwave)

Actual total usage on each day is likely to be roughly proportional, and typically ~20 times the above numbers.

Note – please don’t read too much into the lowest usage days that appear on the graph. We’ve had quite a few power problems with our server room this year, and such low days may simply be when we were able to record little if any data. Large-scale bike removals and additions by the operator can also distort the results quite a bit, by perhaps up to 500 bikes a day. Mass additions to the system will depress the true result for that day, while mass removals can falsely inflate the numbers. It’s difficult to spot these, except by looking at the graph for the previous and following days, and comparing the max/min numbers.

Categories
Bike Share

Bike Share Map Update – 6 New Cities, Weather, Stats

Now available on the Bike Share Map are five extra French cities: Montpellier, St Etienne, Calais, Valence and Vannes, as well as Kunshan in China. I’m also now showing the relaunched bike share in Rio de Janeiro – yes, you can #bikeshare beside Copacabana Beach. This brings the total currently being visualised to 45 – not including several that have shut down for the winter and will be back, and some others where I’ve been asked not to collect the data. Thanks to Russell from the Bike-sharing Blog for the tip-offs for all of these.

So far, Montpellier, Rio and Kunshan are looking potentially very interesting, while there’s nothing much going on in Calais, St Etienne, Valence or Vannes.

I’ve also added some extra stats on each bike share, showing the number of docks and how many are completely empty and completely full – often surprisingly many after rush-hour for certain cities.

Finally and perhaps most importantly I’m now showing current weather conditions for most of the cities. The data is the METAR information for the major airport nearest each city, supplied and decoded by the NOAA Internet Weather Source. I’m picking up the reports every hour or so (some report less frequently) and caching them. Hopefully they will prove accurate. Currently it’s reporting 0°C in Toronto and 27°C in Rio de Janeiro.

Categories
Bike Share Data Graphics London

Don’t Zone-1 It When You Can Boris Bike It

[Updated with new connections.] Ever thought what the tube network would look like if you took out the expensive Zone 1? Me neither, until this morning, when I was wondering if it was possible to utilise my current “Boris Bike” bikeshare 24-hour membership to save a bit of money on commuting in to work.

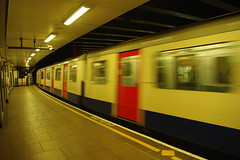
Transport for London would really rather you didn’t take the tube into Zone 1. It’s often at capacity during the rush hour. The fares are priced accordingly – for example, to get a tube from Zone 3 to Zone 1, it costs £2.90 during the Peak Fare periods, compared with £1.40 if you only go from Zone 3 to Zone 2. Do that commute twice, and it’s a £3 saving missing out Zone 1, which more than makes up for the £1 Boris Bike 24-hour membership charge. So, I was wondering if it is viable to get off the tube a few stops early and Boris Bike the final mile or so.

Superimposing my London bike share map reveals directions from where such money-saving journeys may be possible. Plenty of opportunities from the north-west or the west, with St John’s Wood, Notting Hill and Earls Court having easy Boris Bike accessibility. Access from the south-west and south is also good, thanks to Vauxhall and Elephant & Castle. Things get a little trickier – as usual – in the south-east, where a 1km walk from Bermondsey, or a much longer walk from South Bermondsey are your only options – the region won’t even stand to benefit from the forthcoming scheme expansion. The east is also an option, with Whitechapel being very well stocked with Boris Bikes, and Wapping not being too far either. The east is set to benefit too from the imminent expansion of the Barclays Cycle Hire scheme, to use its full name, to cover all of Tower Hamlets. The north-east is OK, with Hoxton an option, although it’s a shame the docks don’t extend up to Highbury & Islington station, a major interchange. The north is also good, thanks to the legendary Mornington Crescent station.

Four of the Best Zone 2 & Bike Opportunities

  • Mornington Crescent (Northern Line) – right beside a big docking station. Don’t go to Euston (Zone 1). It’s also easy to get to Mornington Crescent from the Overground, thanks to an unmarked but official Out of Station Interchange.
  • Notting Hill Gate (Central Line) – the tube takes you to the top of the hill, then go east by Boris Bike.
  • Earl’s Court (District/Piccadilly) – it’s a long way to Charing Cross, but if you don’t need to go that far, the bike is a good way to travel.
  • Whitechapel (District/Hammersmith & City) – two big stands very close to the station, and an easy cycle along CS2 into the City.

So, all in all, not too bad. Whether it’s worth the extra time walking to a convenient docking station, and the worry of finding it all out of bikes, to save a pound or two, is another thing…

+ =

See my Mapping London article for more detail about the No Zone 1 map. You can click on the map above for a larger version. An SVG version (i.e. editable) without the bike docking stations, is downloadable here although there is lots of missing detail beyond Zone 2.

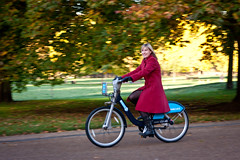
The map was based on a Wikimedia/Wikipedia file, which I then augmented (to show the Overground and some selected regular railway lines) with OpenStreetMap data, by producing a map in GEMMA of railway=rail features. I also added some unmarked Out of Station Interchanges, thanks to this FOI request. Photos by Gnatallica, Clotheyes and Wwarby on Flickr.

[Update: An earlier version of the article and map made reference to Shoreditch High Street station which I incorrectly thought was in Zone 2 for “old East London Line” journeys – it appears this is not actually the case – the anomaly that I was misremembering is that for short journeys from the station, the Peak Fare increases do not apply. I’ve also updated the map a few times since posting this article, to add in a few missing stations and also the locations of the big terminus stations in London. I’ve also added some “Out of Station Interchanges” on the Overground – many of these aren’t marked on official TfL maps, but are valid interchanges, i.e. you don’t get charged for two journeys.]

Categories
Bike Share

So Just How Many Bikes are there in the Barclays Cycle Hire scheme?

About 6,600 according to the Mayor and cited in this Evening Standard article. But these include the bikes in storage, such bikes are not much help to people wanting to use them on the streets of the capital.

A more accurate figure, that is the number of bikes on the streets of London, that you can actually use, would be about 4900. The number (shown in the graph with the blue dots, indicating maximum values) does fluctuate a lot though:

One interesting feature on the graphs is the four red dots on their own, on the left hand side (i.e. August-December 2010) which are noticeably lower than the others. The red dots show the minimum number of bikes available (i.e. the maximum number of bikes being used) on that day. These four dots in particular, represent a four very busy day for the bike share scheme – they correspond to the four tube strike days.

Occasionally the data feed fails, for a day or so, so the maximum and minimum numbers combine. It is normally reasonable to assume that the maximum value for a particular day shows the number of bikes available on the streets, as probably fewer than 10 bikes will be being ridden at some moment during the day – the usage minimum is typically at around 4am.

Categories
Bike Share

V’Lille and Bike in Bath Online – Huge Lille Figures

I’ve added Lille and Bath to the Bike Share Map. Lille’s system, V’Lille, was soft-launched a few weeks ago, while Bike in Bath, a very small system run by Bicincitta, also launched recently. Bath’s uptake so far seems to have been virtually non-existent – with no rides yet today – however Lille’s usage has been nothing short of spectacular – yesterday, nearly 70% of all the bikes in the system were on the streets rather than in the docks. In fact, Lille tops the following table which shows my estimated maximum use of bike share bikes across 17 cities yesterday. In calculating these numbers, I’ve assumed that at some point in the night before/after, no bikes were being used, and that any change in the total number of docks is because of faulty bikes. That last assumption is a conservative one, so the actual %s may well be a little higher. I can’t be sure that these are accurate numbers so these stats should not be regarded as being definitive, just (perhaps) indicative.

Lille leads the way and Seoul’s small system (in two seperate suburbs) also had impressive usage. San Antonio in Texas, another small system, is in a surprise third place, with London fourth. Vienna also had a very good day.

Sunday 2 October – Estimated Maximum Simultaneous Use

City Local Time of Maximum Weather No of Bikes in System Max % In Use
Lille Sunday 16:56 Sunny 678 65.9%
Seoul Sunday 16:16 Sunny 301 40.5%
San Antonio Sunday 11:18 Sunny 109 37.6%
London Sunday 15:52 Sunny 4765 36.9%
Vienna Sunday 16:48 Sunny 878 30.6%
Saragossa Sunday 19:44 Sunny 885 25.9%
Bordeaux Sunday 16:38 Cloudy 1254 19.5%
Tel Aviv (Saturday) Saturday 17:10 Part Cloudy 667 18.1%
Washington DC and Arlington Sunday 12:50 Part Cloudy 852 18.0%
Changzhou (China) Sunday 08:34 Rain 1543 16.3%
Miami Beach (4h interval) Sunday 19:30 Part Cloudy 598 16.2%
Dublin (3rd party data) Sunday 18:10 Rain 448 12.5%
Minneapolis Sunday 11:46 Sunny 987 8.4%
Rennes Sunday 18:00 Sunny 801 7.2%
Toronto Sunday 10:42 Rain 772 6.7%
Montreal Sunday 17:32 Rain 4274 4.0%
Melbourne Sunday 11:48 Part Cloudy 541 2.6%

Thanks as ever to Russell from the Bike-sharing Blog for alerting me to Lille and Bath’s go-live.

Picture from Jason Jones on Flickr.

Categories
Bike Share

Mockup of NYC Bikeshare

Following on from yesterday’s post about the forthcoming New York City bikeshare, I’ve created a mockup of how the scheme might look like on my Bike Share Map. The mockup uses the most popular locations voted for by people on the NYC DoT website. It scales each docking station size by the number of votes received, and pseudorandomly decides how empty or full each docking station is, based on the initial time of the suggestion and whether or not the suggesting person said they worked near there. It’s set so that stations near where the person said they worked are more likely to be full – hence the cluster of full stations in Lower Manhattan and Midtown, while much of Brooklyn’s stations are quite empty.

There is a clickable, zoomable version here – I’ve tried to keep to the published boundaries of the scheme. It shows 585 docking stations (announced target 600), and 9802 bikes (target 10000), with a total of 20988 docking points across the stations. Every suggested docking station that had at least five votes as of a couple of hours ago, has been included.

This is a scheme that will have twice as many bikes as London, in an area only around 50% bigger – and there’s more water in the area. So the density of stations does look higher. The average size of each station (35 docking points, assuming roughly 2.2 docking points for each bike) is also around 50% bigger than London’s (23 on average).

Categories
Bike Share

New York City Bike Share – Details Revealed

It’s been announced today that the Alta Bicycle Company will be operating the huge New York City bike-share that will be likely launching next summer. An informative press release reveals the area of the scheme, which will be slightly larger than London’s existing area, but with roughly twice as many bikes in the system and 50% more docking stations, it will have a slightly higher density of available bikes and stations than here in London. The bike and dock design is likely to be very similar to London’s so will be very familiar to anyone visiting from across the pond – it’s also the same system used in Montreal, Washington DC/Arlington, Minneapolis, Boston, Toronto, Ottawa and Melbourne.

Interestingly the system will be financed entirely privately. I’m sure this will be an immense challenge, as London’s capital and operating costs are high. However London has demonstrated that advertising can be a very good deal for the advertiser concerned if the scheme is a success. (London’s planning overhead and so capital expense is also almost certainly higher than New York’s.) The scheme will run 24/365. NYC gets some pretty intense snowstorms in the winter, but so does Washington DC’s scheme, which also runs throughout the year – with occasional suspensions when it gets really bad.

NY will doubtless be looking to London closely, as it probably is the scheme most similar to New York’s – the same technology, roughly the same size and area (all of the US and Canada’s schemes are much smaller) and London’s topography is also quite similar – a major river bisecting the scheme, a single major business district (although London will cover two with next year’s extension to Canary Wharf) with a separate commercial centre, and a very large public park. Doubtless NY will see huge popularity for the bikes in Central Park on weekends, as London does in Hyde Park, and a big morning “commuter surge” from Brooklyn into Lower Manhattan, just like London’s from the Waterloo area to the City.

Interestingly the proposed area extends deep into Brooklyn, but on Manhattan Island it extends only up to 79th Street – roughly a third of the way up Central Park. I would be surprised if, on scheme launch, there aren’t some docking stations in Central Park that don’t in fact go north of this line. New York’s density and road layout structure means there are ample opportunities for the scheme to grow in the future, too.

Two websites have also gone live – Alta’s NYC Bikeshare has some nice mock-up pictures of the bikes (from which I’ve stolen the above pic) + an NYC Dept of Transportation website allows you to pick where you would like to suggest a docking station.

Very pleased to see a link to my bike map from the Alta site. With both big operators in North America (B-Cycle and Alta) being tacitly supportive of third-party maps such as my own – a big constrast to continental Europe – and the station data format likely to be the same, I have high hopes that we will see the plethora of mobile apps, maps and visualisations from the community expand to cover NYC.

N.B. The map above is my own estimate based on the press release boundary mentions. The final scheme on launch will not necessarily match these boundaries.

Categories
Bike Share

Bike Sharing in France – Tours, Angers, Paris

I was in the Loire region of France last week for a holiday. Unusually for me, a “proper” holiday – no international orienteering racing or mountaineering. Instead, a chance to be a real tourist, visit les châteaux and try a bit of the local grape-based drinks.

…but France is rather advanced when it comes to bike sharing systems and I came across three of them:

Tours – Velociti

A traditional free-floating scheme rather than a dock-based one – members take one of the bright yellow bikes (below) and then lock it up whereever, when they are finished. I didn’t see anyone using them, but did spot them locked up in a few places, including one outside the train station and a few in a quiet square in the town.

Angers – Velocite+

Angers has apparently had a free-floating one for a long while, called Velocite – I didn’t spot any of these. But I did spot this seemingly brand new extension – Velocite+. There is only one (very large) docking station, right outside the train station. The docking station had Every dock was taken with a bike – presumably if there is only one docking station in a scheme, this is not a problem. The fee (effectively three euros for up to five hours) means people could feasibly hire one out at lunchtime and use it several times in an afternoon, before returning it back to the single docking station, rather than make short station-to-station hops. No sign of it being used yet.

Angers has also just launched its rather innovative tram – in the historic central section it uses radio-activated sections of electric third-rail, rather than unsightly overhead wires and gantries.

Paris – Velib

On the way back home, I had a day in Paris, and what better way around than by Velib? After spending much of the day around the canal area in the north-east and Sacre-Coeur, I headed into the centre (during the evening rush hour), then around to the Louvre, Notre Dame, and back up to Gare du Nord.

I managed eight journeys in all, and even got the bonus 15-minute credit for having dropped off a bike on the hill near Sacre-Coeur.

You can see the pics from my trip in this Flickr gallery or here:

Categories
Bike Share

The OBIS Project

I was in Prague at the end of last month for the final OBIS Project meeting. OBIS was a multi-year European Commission project to study and document bike sharing systems in 10 countries in the European Union.

The project’s handbook was presented at the conference, and there were a number of talks from various cities on their own schemes, as well as some external speakers. I found the Barcelona one, given by the operator, particularly interesting – it focused on the difficulties they have with redistributing enough bikes to a densely populated part of the city with narrow streets. By switching to a hub-and-spoke model, they were able to significantly improve the effectiveness. London was covered by the CTC (Cyclists Touring Club) who presented on Transport for London’s behalf. The project actually covered the UK before London’s Barclays Cycle Hire launched, so focused on the smaller schemes in, for example, Cardiff and Blackpool. However London did make it into the final handbook. Stockholm’s presentation touched on the logistical and political issues there, particularly as regards finding space for docking stations – their scheme is therefore still at just 50% of its planned size/density.

Other sessions had insights into the differences between station-based systems and “leave whereever” schemes. The old Berlin system, which is just being switched to station-based docking, used to allow bikes to be left at any crossroads in the scheme area – fine in principal but Berlin has a very large number of crossroads.

As an external speaker, I presented on visualising bike shares around Europe and throughout the world, mentioning my own Bike Share Map as well as introducing some more complex work being carried out by others in the research lab here. I also went into detail on the excellent range of data available for the Capital Bikeshare in Washington DC, and touched on Hangzhou’s huge system, and London’s new official API. A slide from the presentation is above, I’m not posting the whole presentation yet though as it contains some forthcoming work from others here.

The session that launched the handbook outlined some interesting insights from it. It is useful to class European cities as “warm” or “cold” (p31 of the report.) Warm cities generally have two peaks in bike share usage a year – spring and autumn – it being too hot in the summer for mass usage. Cold cities peak in the summer, and often drop off completely in the winter and snow and ice takes over.

European countries were also categorised according to the cycling culture there – it is probably fair to place Germany in the top category, but I was somewhat surprised to see France in the middle one and the UK in the bottom one. Cycling in London has improved a lot over the last few years – even if transport planners insist in putting the cycle lanes on the roads and not the pavements – in fact I spent most of yesterday cycling in Paris – blog post to follow – and felt there were fewer (non-Velib) cyclists around than in London. Talking of Paris’s Velib, one tidbit I didn’t know about until I read through the handbook (p.61) was that the operators in Paris run a barge (!) up and down the Seine, on which they fix Velib bikes and at the same time transport them to where they are most needed. Kind of like a French version of the Travelling Post Office.

Prague doesn’t have its own full scale bike share system (yet) and the “modal share” of cycling is much less in Prague than in many other European capitals. There is a very small trial bike share in the city, I didn’t spot it. There were hardly any bikes on the streets, at least in the central part of the city I saw, although the route along the riverbank was reasonably popular when I passed and has a dedicated cycle path. There is one thing better than London though. A photo of the riverside route is below – if this were London, the bollards would be in the cycle path rather than in the pedestrian lane.

You can download the OBIS handbook from the offfical website.