Categories
Conferences London

Smart Mobility Meeting in Mexico City

Below is a presentation that combines my talks last Thursday and Friday at the Smart Mobility forums in central Mexico City, organised by ITDP Mexico and funded by the Foreign and Commonwealth Office’s Prosperity Fund (respresented by the British Embassy in Mexico). The Thursday presentation focused on the third-party app ecosystem that exists around bikesharing in London and elsewhere, while the Friday presentation included more examples of private sector innovation using open data:

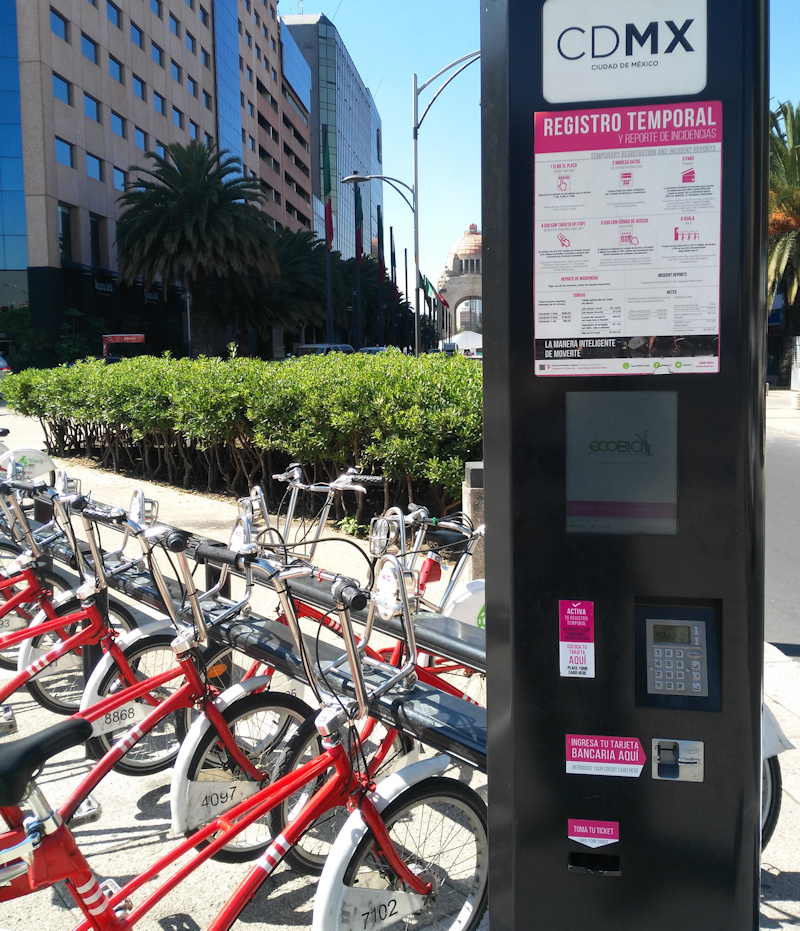
My week in Mexico City also included a visit to CIC at IPN (the computational research centre city’s main polytechnic) where I was introduced to a product building visualisations of ECO-BICI data to help create more effective strategies for redistribution. I also visited LabCDMX, a research group and ideas hub to study Mexico City that has been created by the city government, to give a couple of talks in their rooftop on visualising London transit and a summary of web mapping technologies. The organisers also squeezed in a couple of short TV interviews, including Milenio Noticias (23 minutes in). The week ended with a tour of the ECO-BICI operations, repair, management and redistribution warehouse, located centrally and a hive of activity. This included a look at their big-screen redistribution map and vehicle routing system.

Some of the companies and products I cited included CityBikes, Cycle Hire Widget, TransitScreen, ITO World, Shoothill, Waze, Strava Metro and CityMapper. I also showed some academic work from myself, James Cheshire and Steve James Gray in UCL GSAC and UCL CASA respectively, an article in The Guardian by Charles Arthur, an artwork by Keiichi Matsudaa and a book by James Cheshire and Oliver Uberti. I also mentioned WhatDoTheyKnow and heavily featured the open data from Transport for London.

I also featured some work of my own, including CDRC Maps, TubeHeartbeat, London Panopticon, Tube Stats Map, CityDashboard, Bike Share Map and London Cycling Census map.

ecobici

Categories
Conferences

Twelve Talks

November is shaping up to be a very busy month for me, in terms of giving talks – I will have presented 13 times by the end of the month. I appreciate that lecturers might not agree that this is a particular busy month! Anyway, here’s a list of them:

  1. 1 November – CDRC Maps: Introduction and Impact (10m)
    Audience: ESRC/Moore-Sloan Meeting
  2. 3 November – Guest Lecture & Practical: Web Mapping (60m + 2h)
    Audience: Second Year Geography Undergraduates at UCL
  3. 9 November – Research Lab Update: Worldnames & CDRC Maps (3m)
    Audience: Jack Dangermond Keynote Lecture at UCL
  4. 11 November – London: Visualising the Moving City (30m)
    Audience: EU COST Action London meeting
  5. 15 November – CDRC Maps: Introduction (5m)
    Audience: Academic visitors from South Korea
  6. 17 November – London: Visualising the Moving City (60m)
    Audience: Geospatial Seminar Series (UCL CEGE)
  7. 22 November – Data visualisation for Bikeshare Systems (60m)
    Audience: CIC-IPN staff and students (Mexico City)
  8. 22 November – Web Mapping (60m)
    Audience: CIC-IPN students (Mexico City)
  9. 23 November – London: Visualising the Moving City (60m)
    Audience: Public officials and students (Mexico City)
  10. 23 November – Data visualisation design workshop (60m)
    Audience: ITDP staff (Mexico City)
  11. 24 November – Third-party App Ecosystems using Open Data (45m)
    Audience: Public officials (Mexico City)
  12. 25 November – Open Data and Innovation for the Private Sector (60m)
    Audience: Small businesses (Mexico City)
  13. 28 November – CDRC Maps: Introduction (5m)
    Audience: Academic visitors from Japan

I have also contributed material for a further talk given by a colleague – an introduction to geodemographics in the UK, for the Brazil governmental statistical service.

Categories
Technical

Taxonomy of Web Mapping Frameworks and Formats

Here’s an attempt to create a simple taxonomy of the currently active and popular web mapping frameworks available. This covers web mapping that delivers a consumer-navigable geographic “slippy” map of raster and/or vector tiles containing bespoke geographic data.

FRAMEWORKS
< < < EASY, costs, limited, quick
Flexible, Needs resources, time, HARD > > >
Ecosystems Hosted Wrappers Managed Wrappers Managed APIs Open Frameworks Spatial Servers Server Programming
Mapbox Studio


CARTO Builder


ESRI ArcGIS Online


Tableau


Google Fusion Tables


Google MyMaps

Google Maps Embed API


Google Static Maps API


OSM StaticMapLite

HERE Maps API for JavaScript


Google Maps JavaScript API


Microsoft Bing Maps V8 SDK

OpenLayers


Leaflet


D3 DataMaps


Leaflet for R/RStudio


RMaps

MapServer


GeoServer

R (ggplot)


Unfolding (Processing/Java)


Mapnik (C++/Python)

Capabilities/Requirements of the above Frameworks
Data analysis Data analysis
Remote server dependency Server with shell access required
Web space required
Scripting knowledge required Programming required

I will aim to update based on feedback and new discovery. This initial version is based on my own usages/experiences in the field, so it is quite possible there are some very obvious candidates I have missed.

Additionally (and with the some proviso as above) here’s a 2×2 table of file formats used in slippy and static web mapping, for vectors and rasters – the latter including attribute fields like UTF Grids. I am only including formats widely used in web mapping, rather than GIS in general.

DATA SPECIFICATIONS & FILE FORMATS
Static “WebGIS”
Raster OGC WMS


GIF, JPG, PNG, (Geo)TIFF

OGC WFS, GeoJSON, TopoJSON, KML, SVG


XML, SHP, JSON

Vector
TMS, WMTS, XYZ, UTFGrid


GIF, PNG, JSON

Mapbox Vector Tile Specification


JSON, PBF

Tiled “Slippy”