Categories
Data Graphics London

Tube Heartbeat

tubeheartbeat

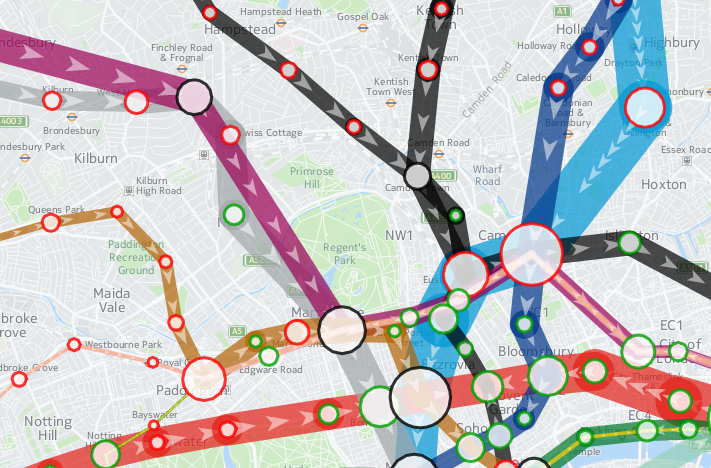
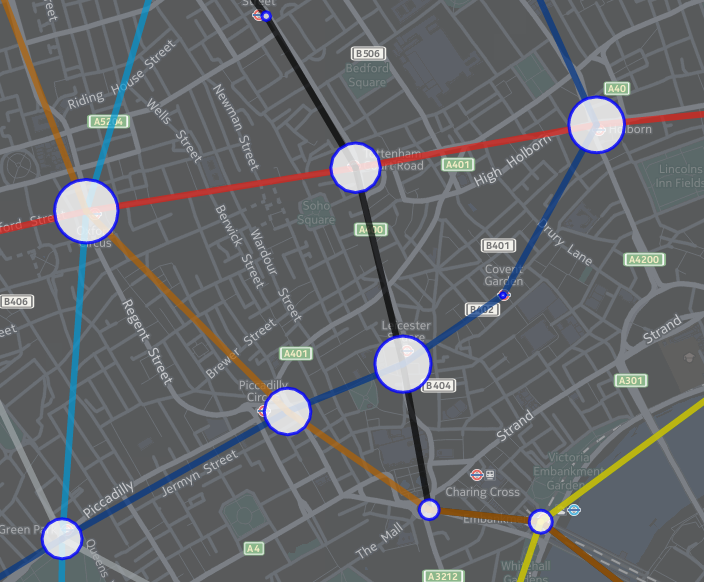
Tube Heartbeat is a interactive map that I recently built as part of a commission by HERE, using the HERE JavaScript API. It visualises a fascinating dataset that TfL makes available sporadically – the RODS (Rolling Origin Destination Survey) – which reveals the movements of people on the London Underground network in amazing detail.

The data includes, in fifteen-minute intervals throughout a weekday, the volume of tube passengers moving between every adjacent pair of stations on the entire tube network – 762 links across the 11 lines. It also includes numbers entering, exiting and transferring within each of the 268* tube stations, again at a 15 minute interval from 5am in the morning, right through to 2am. It has an origin/destination matrix too, again at fine-grained time intervals. The data is modelled, based on samples of how and where passengers are travelling, during a specimen week in the autumn – a period not affected either by summer holidays or Christmas shopping. The size of the sample, and the careful processing applied, means that we can be confident that the data is an accurate representation of how the system is used. The data is published every few years – as well as the most recent dataset, I have included an older one from 2012, to allow for an easy comparison.

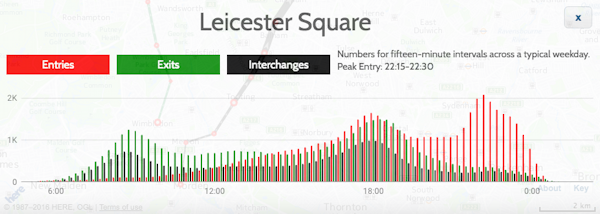
As well as the animation of the data, showing the heartbeat of London as the the lines pulse with passengers squeezing along them, I’ve including graphs for each station and each link. These show all sorts of interesting stats. For example, Leicester Square has a huge evening peak, when the theatre-goers head for home:

leicestersquare

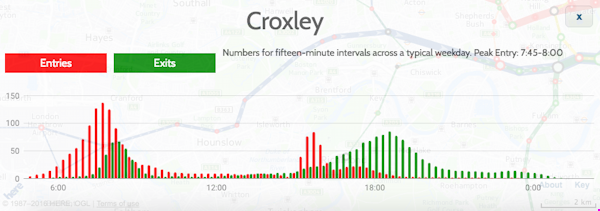
Or Croxley, in suburban north-west London, with a very curious set of peaks, possibly relating to the condensed school day:

croxley

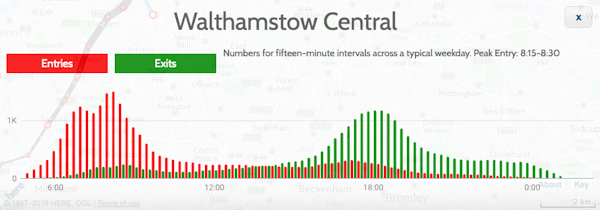
Walthamstow (along with some other east London stations) has two morning rush-hours with a slight lull between them:

walthamstow

Check the later panels in the Story Map, the intro which appears when first viewing Tube Heartbeat, for more examples of local quirks.

This is my first interactive web map produced using the HERE JavaScript API – in the past, I have extensively used the OpenLayers, as well as, a long while back, Google Maps API. The API was quick to pick up, thanks to good examples and documentation, and while it isn’t quite as full-featured as OpenLayers in terms of the cartography, it does include a number of extra features, such as being quickly able to implement direction arrows along lines, and access to a wide variety of HERE map image tiles. I’m using two of these – a subdued gray/green background map for the daytime, and an equivalent darker one for the evening data. You’ll see the map transition between the two in the early evening, when you “play” the animation or scrub the slider forwards.

Additionally, I’ve overlayed a translucent light grey rectangle across the map, which acts to further diffuse the background map and highlight the tube data on top. The “killer” feature of HERE JavaScript API, for me, is that it’s super fast – much faster than OpenLayers for displaying complex vector-based data on a map, on both computer and smartphone. Being part of the HERE infrastructure makes access to the wide range of HERE map tiles, with their distinctive design, easy, and gives the maps a distinctive look. I have previously used HERE mapping for some cities in the Bike Share Map (& another example), initially where the OpenStreetMap base data was low in detail for certain cities, but now for all new cities I “onboard” to the map. The attractive cartography works well at providing context for the bikeshare station data there, and the tube flow data here.

There is some further information about the project on the HERE 360 blog, and I am looking to publish a more deatiled blogpost soon about some of the technical aspects of putting together Tube Heartbeat.

Stats

Number of stations Number of lines Number of line links between stations
268* 11 762

Highest flows of people in 15 minutes, for the four peaks:

Between stations (all are on Central line)
Morning 8208 0830-0845 Bethnal Green to Liverpool Street
Lunchtime 2570 1230-1245 Chancery Lane to Holborn
Afternoon 7166 1745-1800 Bank/Monument to Liverpool Street
Evening 2365 2230-2245 St Paul’s to Bank/Monument
Station entries
Morning 7715 0830-0845 Waterloo
Lunchtime 1798 1130-1145 Victoria
Afternoon 5825 1730-1745 Bank/Monument
Evening 2095 1015-1030 Leicester Square
Station interchanges
Morning 5881 0830-0845 Oxford Circus
Lunchtime 2060 1330-1345 Oxford Circus
Afternoon 5043 1745-1800 Oxford Circus
Evening 1109** 2215-2230 Green Park
Station exits
Morning 6923 0845-0900 Bank/Monument
Lunchtime 2357 1145-1200 Oxford Circus
Afternoon 7013 1745-1800 Waterloo
Evening 1203 1015-1030 Waterloo

* Bank/Monument treated as one station, as are the two Paddington stations.
** Other stations have higher flows at this time but as a decline from previous peak.

I’m hoping to also, as time permits, extend Tube Heartbeat to other cities which make similar datasets available. At the time of writing, I have found no other city urban transport authority that publishes data quite as detailed as London does, but San Francisco’s BART system is publishes origin/destination data on an hourly basis, there is turnstyle entry/exit data from New York’s MET subway, although only at a four-hour granularity, and Washington DC’s metro also publishes a range of usage data. I’ve not found an equivalent dataset elsewhere in Europe, or in Asia, if you know of one please do let me know below.

tubeheartbeat2

The data represented in Tube Heartbeat is Crown copyright & database right, Transport for London 2016. Background mapping imagery is copyright HERE.

Categories
London

Open Doors: Battersea Power Station

batt5
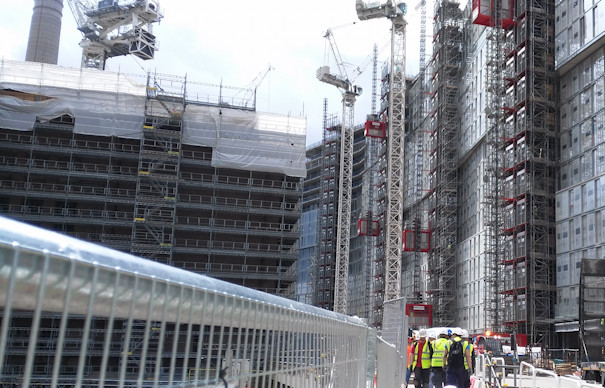
I’ve been slow to write about all my Open Doors week construction-site visits back in June, but as well as seeing a soon-to-be-skyscraper, I also made it to two other sites, the largest of which far-and-away was Battersea Power Station – more specifically, the “Phase 1” work beside it, which is the construction of two huge 20-story-high blocks that will surround the venerable power station – itself also a building site right now as part of the “Phase 2” work.

batt3

The blocks were all sold off-plan long ago, and construction is taking place at a frenetic pace, as the developer aims to deliver the accommodation as soon as they can. The sheer amount of activity is breathtaking, with over 2000 workers on site.

batt2

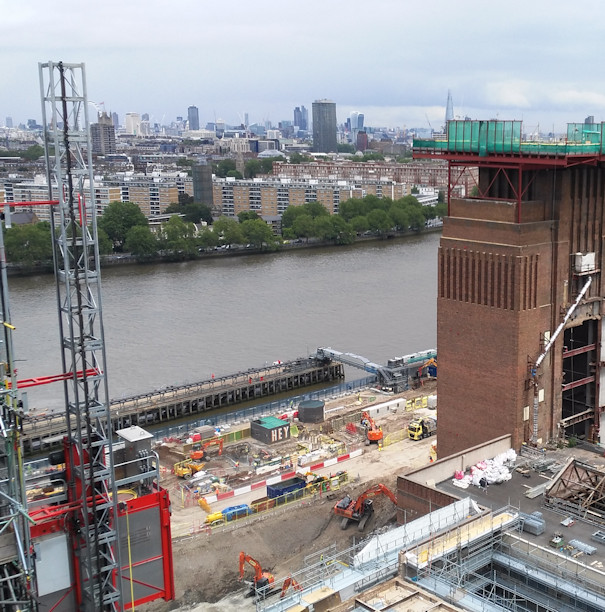
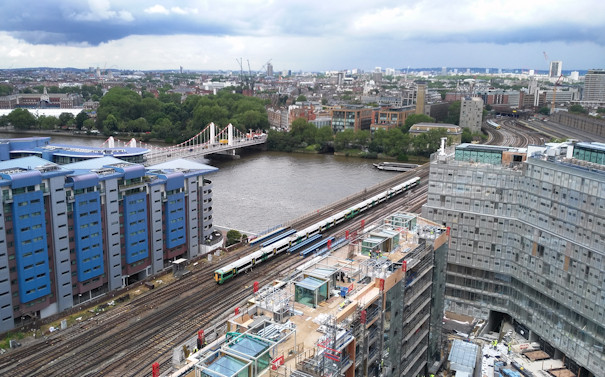
The tour included a visit to the basement infrastructure of the new blocks, as well as looking inside a couple of the flats (which include pre-fabricated bathrooms that have been just dropped in), and – the definite highlight – a journey up a hoist to the roof, from which you looked down to the roof of the old power station, or across the Thames to central London, and to the garden of the £4m+ penthouse that will be there soon.

batt6

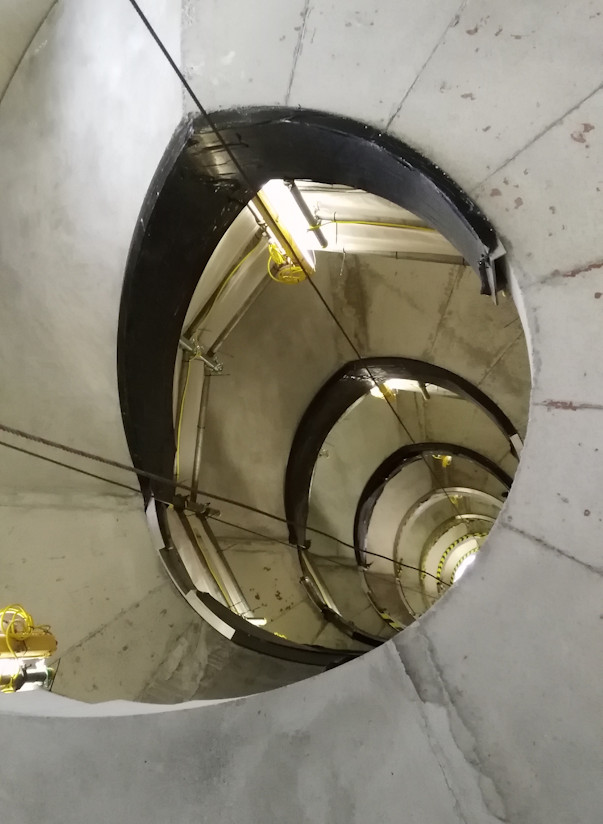
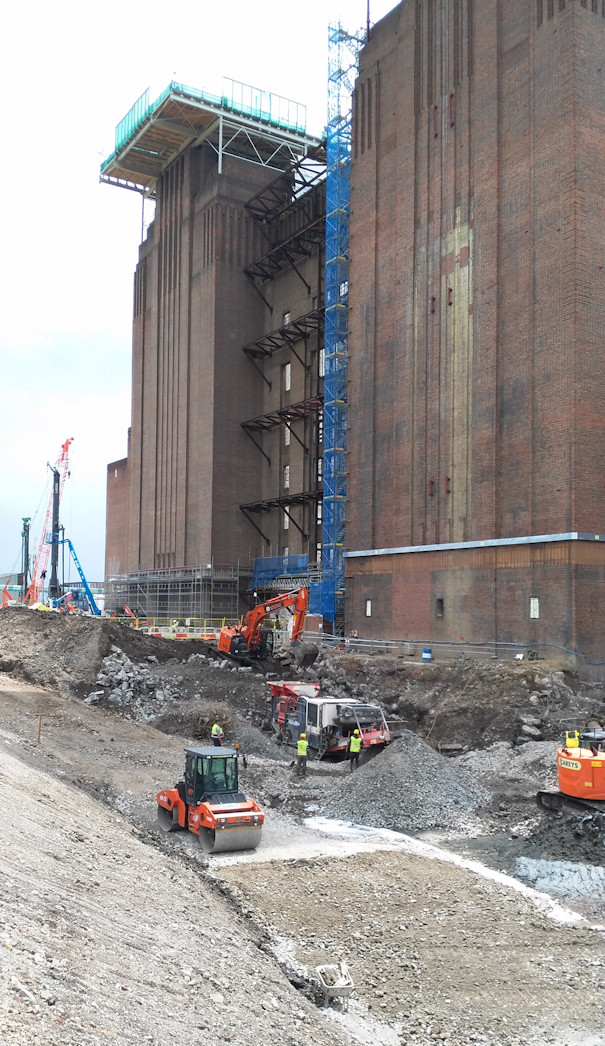
There were a few additional surprises, such as a spiral staircase being constructed, and a close-up view of the power station in transformation (the route to the Phase 1 work is along a narrow pathway between the station and the river).

batt7

batt1

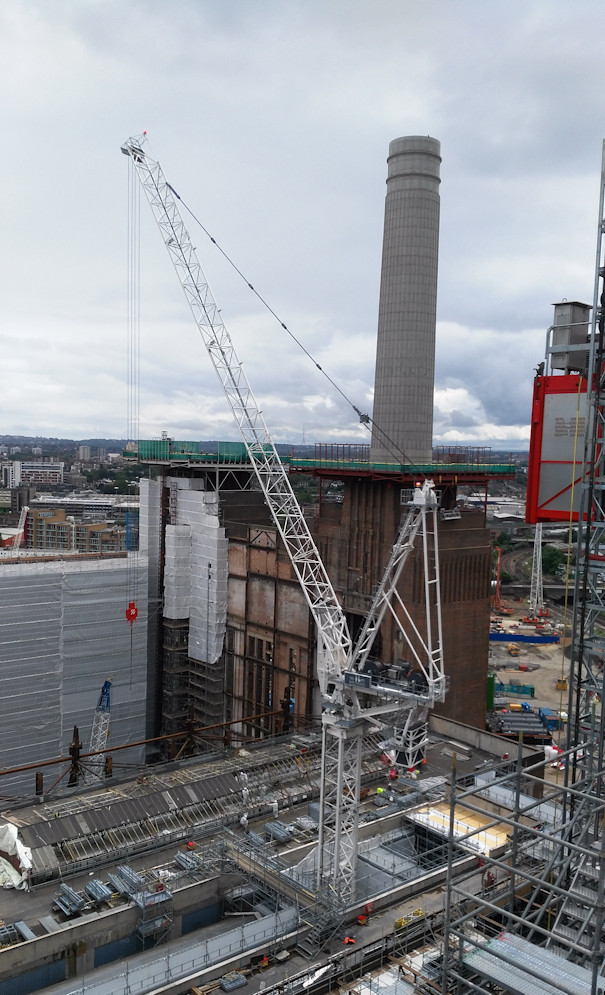
It was great to see too the chimneys of Battersea Power Station being restored – having disappeared from the skyline at the beginning of the project (sulphur damage had made them structurally unstable), the first of the four replacements, constructed with the same techniques and materials, has now reappeared.

batt4a

Categories
Data Graphics

Putting Cartography Back on the Map – Google Maps Getting Prettier

googlemaps_july2016

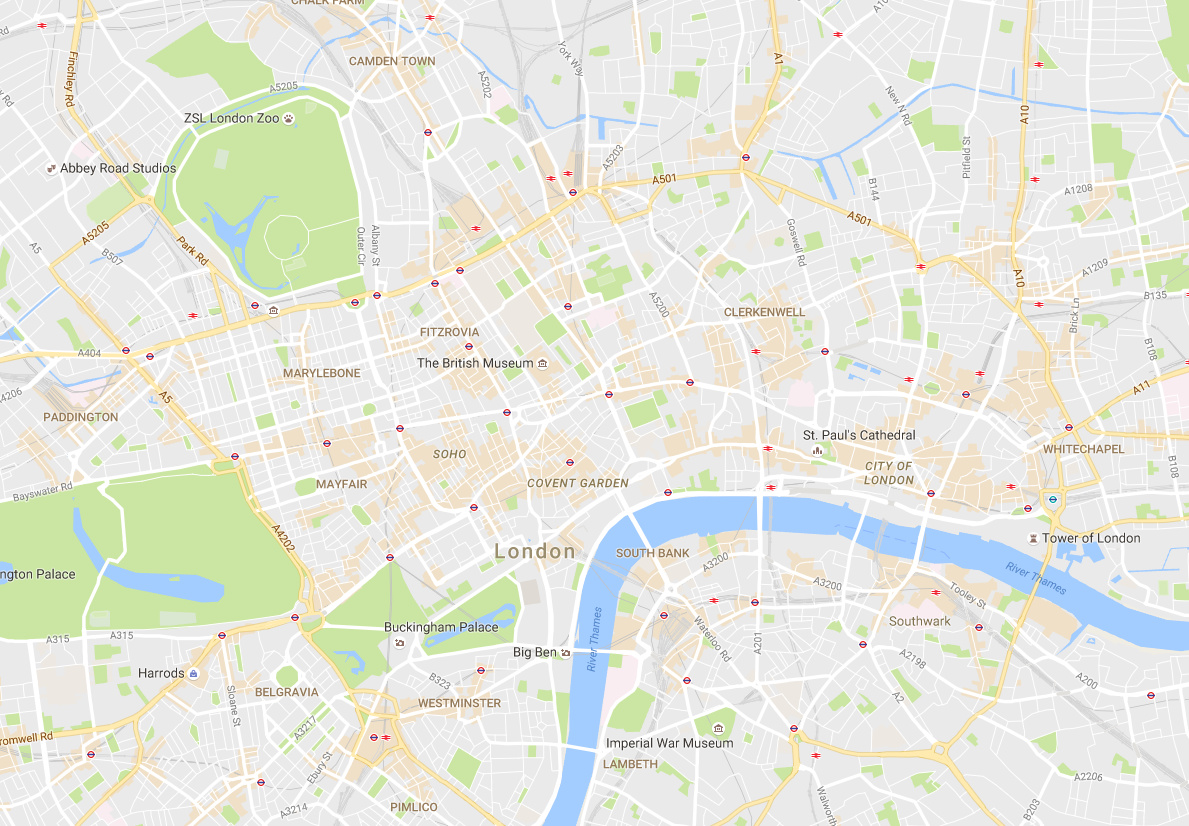
There was a time when Google Maps was an ugly ducking. It started life as a road map, and its grey background was decryed at a memorable keynote at the British Cartographic Society annual conference 8 years, contrasting with the classic Ordnance Survey Landranger maps where the spaces between roads were normally full of “something” – be it contours, trees or antiquities. Google’s features, on the other hand, were pretty messy, and often wrong. However, Google has been steadily beautifying its functional map (and correcting it), focusing on the cartography as well as the data, as it turns from a map of roads and POI pins, to a map of everything. 2013 was a big step forward, when the map became vector-based and superimposed features customised to just you. Now in 2016, it’s the look of the map itself that is the focus. Cartography on digital maps is far from dead.

This week, Google has unveiled a the latest update to Google Maps, showing that it is serious about the cartography and colour. The map has a cleaner, more refined look that continues its trend of taking out the detail you don’t need and focusing on the information that you are looking for. The two most obvious changes are (a) a new, brown/orange shading showing “areas of interest” – think high streets and tourist attractions, and (b) smaller roads have had their borders removed and are now simple white lines overlaid on a grey, green or brown background. I have been keen on this technique, using it for OOMap, DataShine and CDRC Maps. MapBox’s basic-style map of OpenStreetMap data also has taken this “white on grey, + data” approach which I am sure has helped inspire Google’s new look. (OpenStreetMap.org has always taken a different approach, with the many contributors wanting their particular mapping visible, it has always looked very busy and colourful. Unlike MapBox and Google Maps, OpenStreetMap.org’s map is to be seen “as is”, rather than acting as a background map upon which colourful project-specific data is intended to be overlaid.)

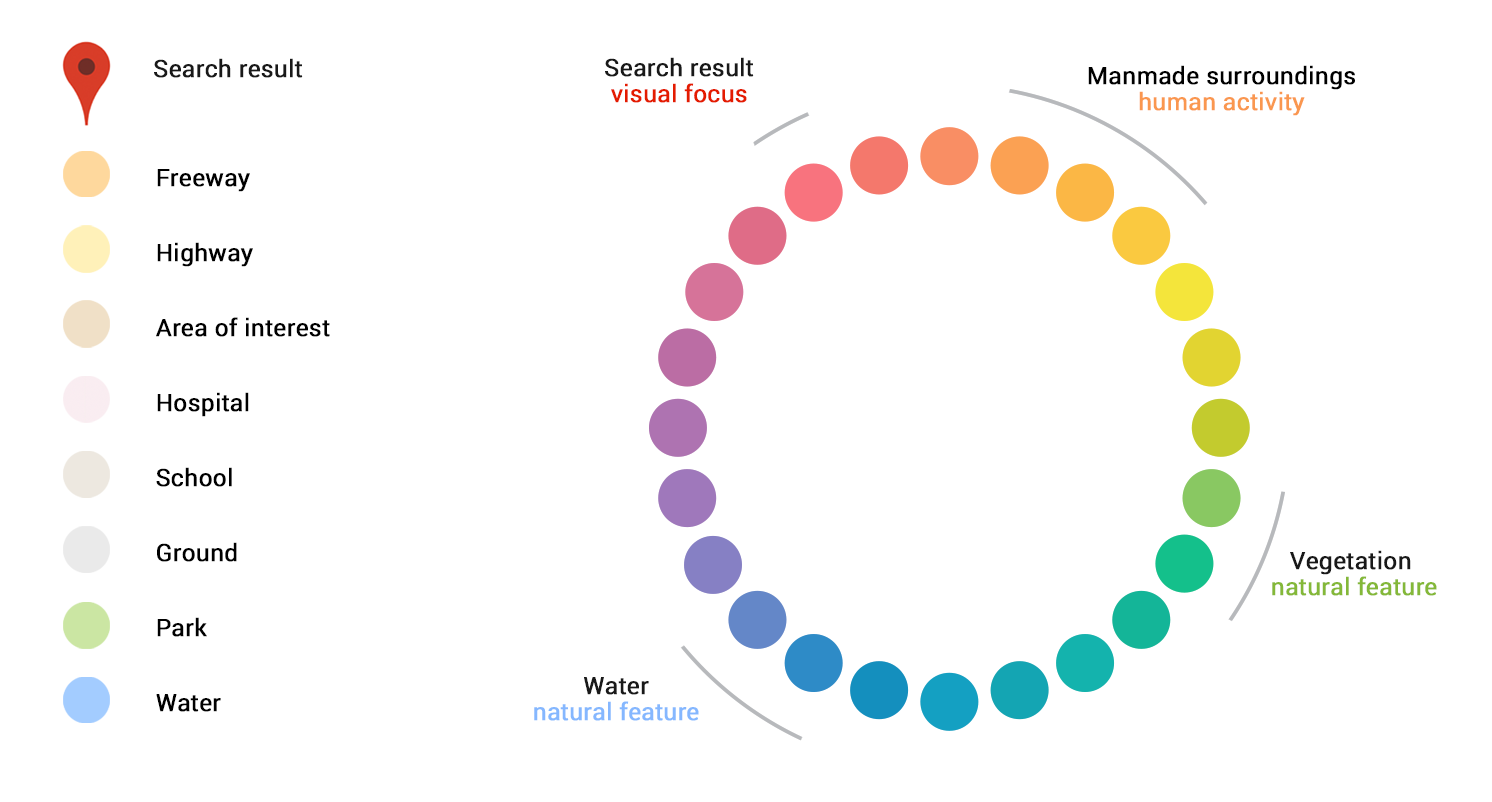
An accompanying blog post goes into more details about the changes. It includes a nice graphic demonstrating the new colour palette used and how Google are using colour to group and categorise map features, which I’ve reproduced here:

SS3

There is a clear use of complementary colours to balance out the map – the search results and current user interest shown in red, man-made features in pinks and oranges, and natural features in greens and blues, all criss-crossed with the white (and yellow) transport networks. It makes for a map that is logical to look at – and crucially, one that is immediately pleasing to the eye. It doesn’t “shout” at you any more.

One final note – the “Areas of Interest” is a powerful new bit of cartography – it draws the eye to it, and means Google Maps has a significant influence on what parts of an unfamiliar city you are likely to visit. It’s a subtle but key bit of “suggestive” mapping. Bad news for the businesses though that rely on passing trade, and are not in these areas.

Categories
CDRC

Population Change in Great Britain 2011-14

popchange_doncaster

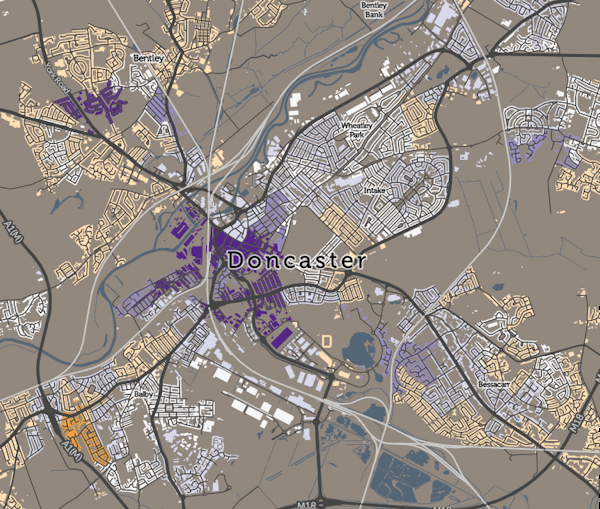
The ONS publish small-area population estimates annually, for England and Wales, and the NRS similarly do for Scotland. By taking two of these datasets, we can see how the population of Great Britain is changing – births, deaths, internal and international migration and military deployments/homecomings all act to fluctuate the population.

I’ve taken the 2011 and 2014 “mid-year” population estimates for LSOA and DZs – statistical areas with a typical population of 1000-1500 people – and compared them, to derive small-area population changes. You can see the resulting map here.

In London, a couple of striking patterns appear. Inner West London – Kensington & Chelsea, Fulham, Wandwsorth – is seeing a striking depopulation (orange on the map). This may be due to the tendency of landlords in these wealthy areas to convert old housing stock, that was split into multiple flats, back into houses for the (very) rich. In a few exceptional cases, houses themselves are being knocked together. The unaffordability of the area and its old-age population may also have something to do with it. Further east in Tower Hamlets, increased immigration and a high to-immigrant birth rate may be contribution to the rapid rise in the population here (10%+ in many area – dark purple on the map) in just 3 years. The increase across GB in total, from 2011-14, is 2.1%. Some of the large increases can be due to new university campus accommodation opening up, while large falls are often an indication of housing estates being demolished and redeveloped.

Many cities across Great Britain show a characteristic of newly-desirable city centres increasing in population, as denser housing developments pack people in, while the suburbs decrease in population. The Liverpool/Wirral conurbation is a fine example of this. An exception is Milton Keynes, where no Green Belt constraints its expansions, and new housing estates keep being built in the outer “blocks” of this grid city. Some smaller places with special employment constraints on them seem to be almost universally decreasing, such as Barrow in Furness, as well as Thurso and Greenock, both in Scotland.

Explore the map on CDRC Maps, and Download the data on CDRC Data.

Categories
Conferences

FOSS4GUK Conference

foss4g_atrium

I was at FOSS4G UK 2016 which took place at the new Ordnance Survey buildings in Southampton, a few weeks ago. FOSS4G is short for “Free and Open Source Software for Geospatial”, and the conference focuses on some of the key free GIS software such as QGIS and PostGIS. This was a UK-focused event, following on from the global FOSS4G in Nottingham in 2013, which I was also at. (The next FOSS4G is in Germany in August.)

The OS is a little hard to get to if you aren’t driving there – I ended up cycling right through Southampton from the central station. Once on site though, it’s a lovely new venue, light and airy inside, with the floors and desks of OS cartographers and digital information managers sweeping away to one side of the central atrium, while the conference took place in a couple of large rooms on the other side. Breakout was overlooking the atrium (above). Around 180 people attended, split into two conference streams.

Highlights included:

foss4g_pgrouting
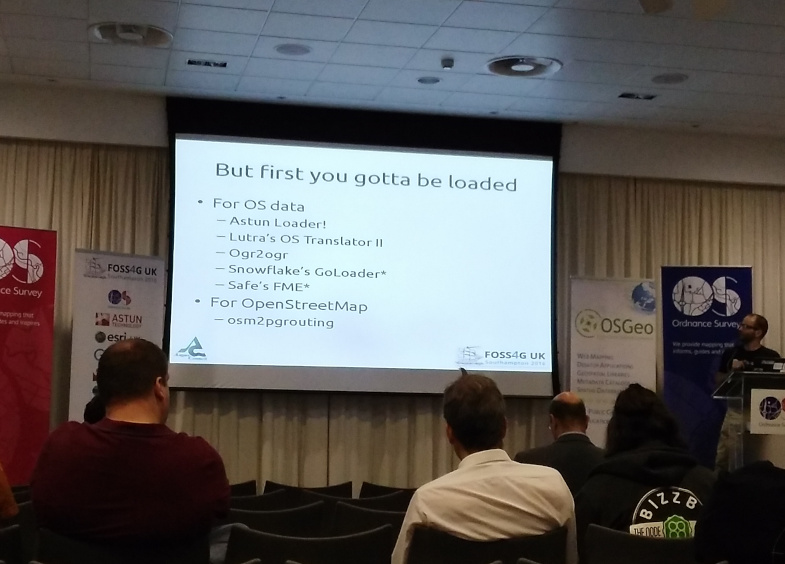
Above: A nice demo of pgRouting usage from Angus Council who’ve switched to open source for asset access mapping. Open and effective code and mapping in a practical, real world context.

foss4g_pgrouting_software
Above: The software used for the Angus Council asset project.

foss4g_chevrons
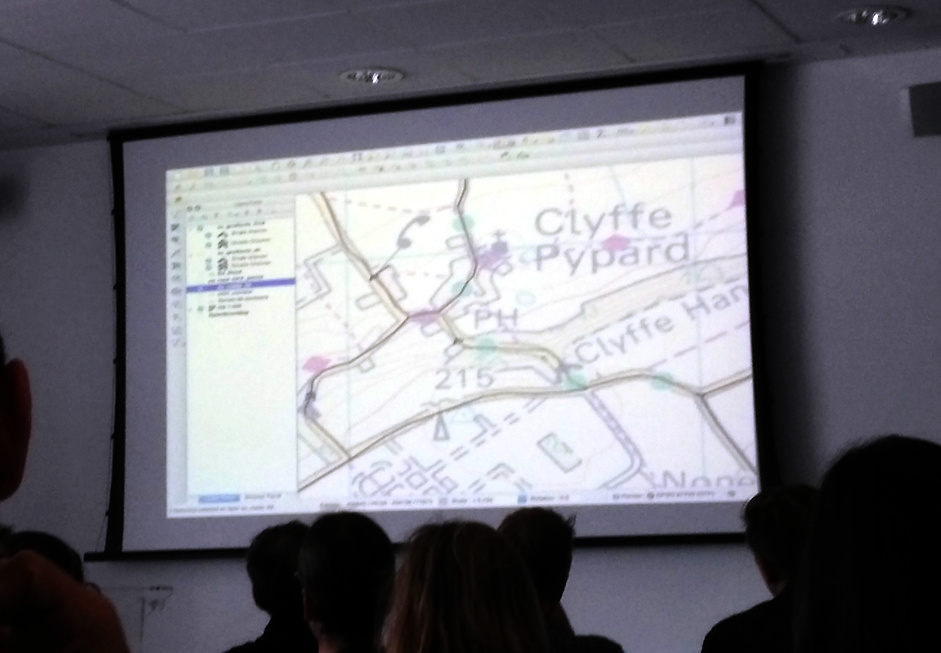
Above: Add Ordnance Survey Landranger-style hill chevrons to your GIS-created digital maps with this nice bit of code. I love these kinds of talks/demos, which you typically only get at these enthusiast/community-driven meetings like FOSS4G UK. Really interesting bits of code or hacks, demonstrated by the creator who did it just because they thought it would be cool.

foss4g_datashine
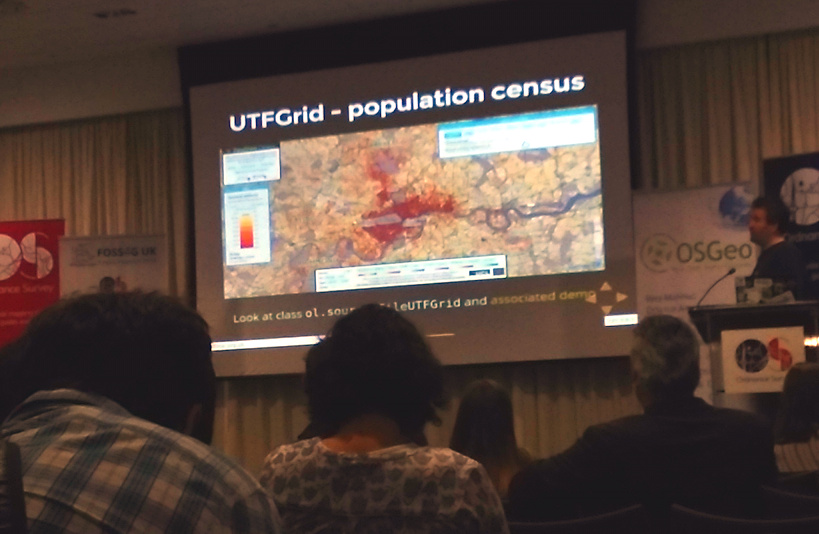
Above: I was pleased also to see DataShine getting a mention, specifically its use of OpenLayers UTFGrid for the attribute mouseovers. The talk was by a FOSS/OpenLayers consultant who’s written a book about the mapping platform, which powers most of my web maps. It’s always flattering to get mentions like this, especially as the speaker was probably unaware I was in the audience!

Outside in the atrium there was a mini-exhibition by the talk sponsors, including, intriguingly, ESRI UK, who are presumably keeping an eye on the FOSS4G community, their core business being far from open source (software), even if they have been very keen on demonstrating their products operating on open data.

FOSS4G UK was an interesting and useful couple of days, pulling together the professional and enthusiast geospatial community in the UK to see what’s happening in the space, and a good opportunity to network.

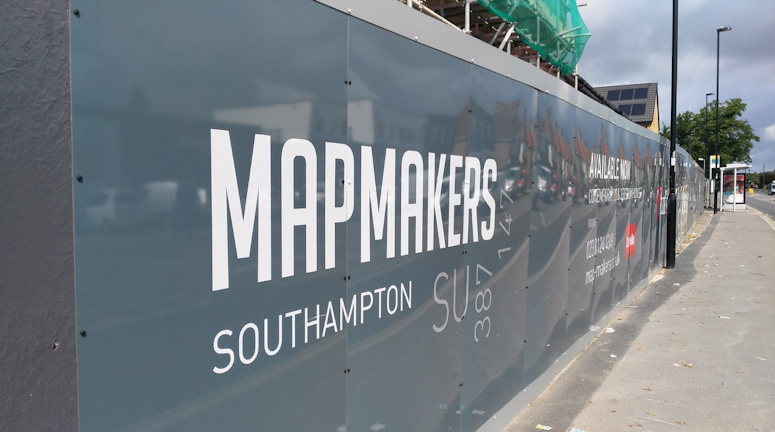
foss4g_mapmakers
Above: “MapMakers”, a housing development next to the old Ordnance Survey office, which is on the way to the new one from the station. The inclusion of the OS grid reference is a nice touch.

Categories
Data Graphics

Inside HERE

Z

A startup with a billion dollar asset. This is how HERE’s new CEO Edzard Overbeek describes the location services company that is making a striking pitch for being the third major digital mapping and location platform alongside Google and Apple.

HERE has had an interesting recent history. Originally NAVTEQ, one of the major cross-world road network databases, used by various “sat nav” systems, it was bought by Nokia and became Nokia Maps, before being rebranded as Ovi Maps. Nokia then sold its phone business to Microsoft – but as the latter already had Bing Maps, the digital mapping business was spun off into a new unit and sold to a consortium of German car companies. At the time, this perhaps seemed a surprising new set of owners but it has quite quickly become obvious – with self-driving car technology suddenly seemingly closer on the horizon, the need to have a global, highly precise digital map of the world’s streets is suddenly incredibly important – the aforementioned billion dollar asset. Google has been building it up from its initial, low-precision mapping, using its fleet of LIDAR mapping cars, and Apple has been doing the same, arguably starting from an even worse base. HERE has arrived in the space with the highest quality start, having been based on a digital map that is over 20 years old.

The insideHERE Event

HERE was kind enough to invite me to an event, insideHERE, at their European headquarters in the heart of Berlin, for demonstrations of their portfolio, using some of the platforms used recently at MWC, CES and the other major trade exhibitions in the technology and mobile space. They also discussed a few “under the hood” features, and what they are working on right now.

There were three themes, reflecting the three main segments of digital mapping at the moment – business, consumer and auto. A cancelled flight at very short notice (thanks for nothing, Norwegian!) meant that I arrived in Berlin late and so missed the first two. The first can be summarised with the HERE Reality Lens Lens product which provides high quality asset and street furniture mapping for the use and management by local authorities, and the second is encompassed by the HERE mobile app digital app, which occupies the same space as Apple Maps and Google Maps app, aiming to displace these on their respective platforms. This is a challenge of course, as the existing apps are pretty good, so HERE’s unique selling point is that they are designed for offline from the ground up (Google Maps offers this on a slightly more restricted basis, but HERE will be available in offline mode for an area, as soon as you initially load it up online.) Reality Lens and the HERE Offline Maps app are nice pieces of technology that utilise data from HERE’s car data gathering options and make it accessible to public sector and consumer users respectively, but it was clear, both from HERE’s new owners and the comparative length of time used during the day, that HERE Auto is the key sector for the company now.

Geodemographics

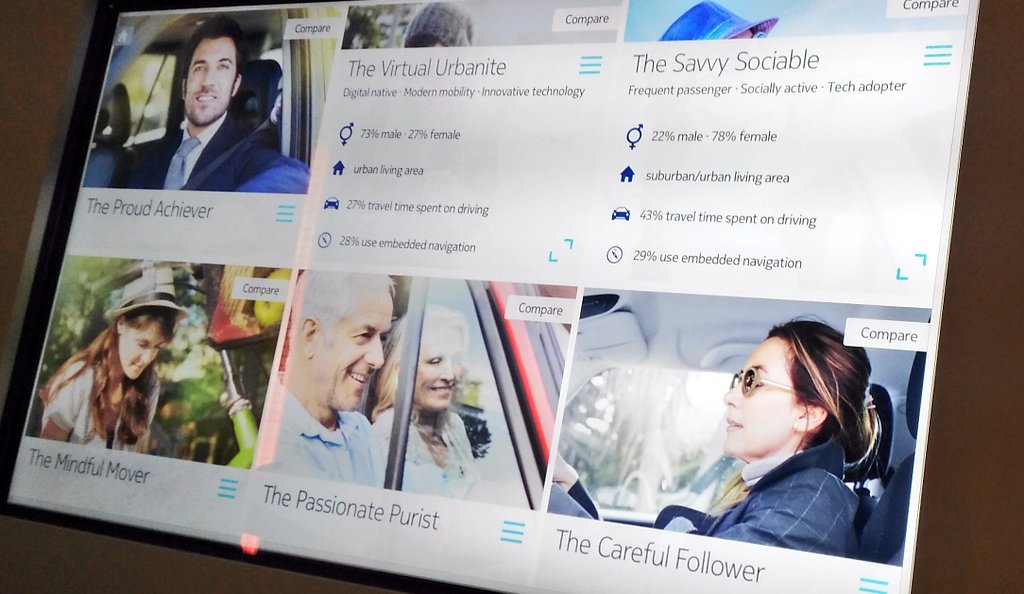
HERE have developed geodemographic profiles for car users (drivers/passengers), based on surveys in the USA, South Korea and Germany. Using cluster analysis of the results, they have identified six characteristic types of users, based on how they use cars and other transport options, day to day:
Z-2

Autonomous Navigation Data

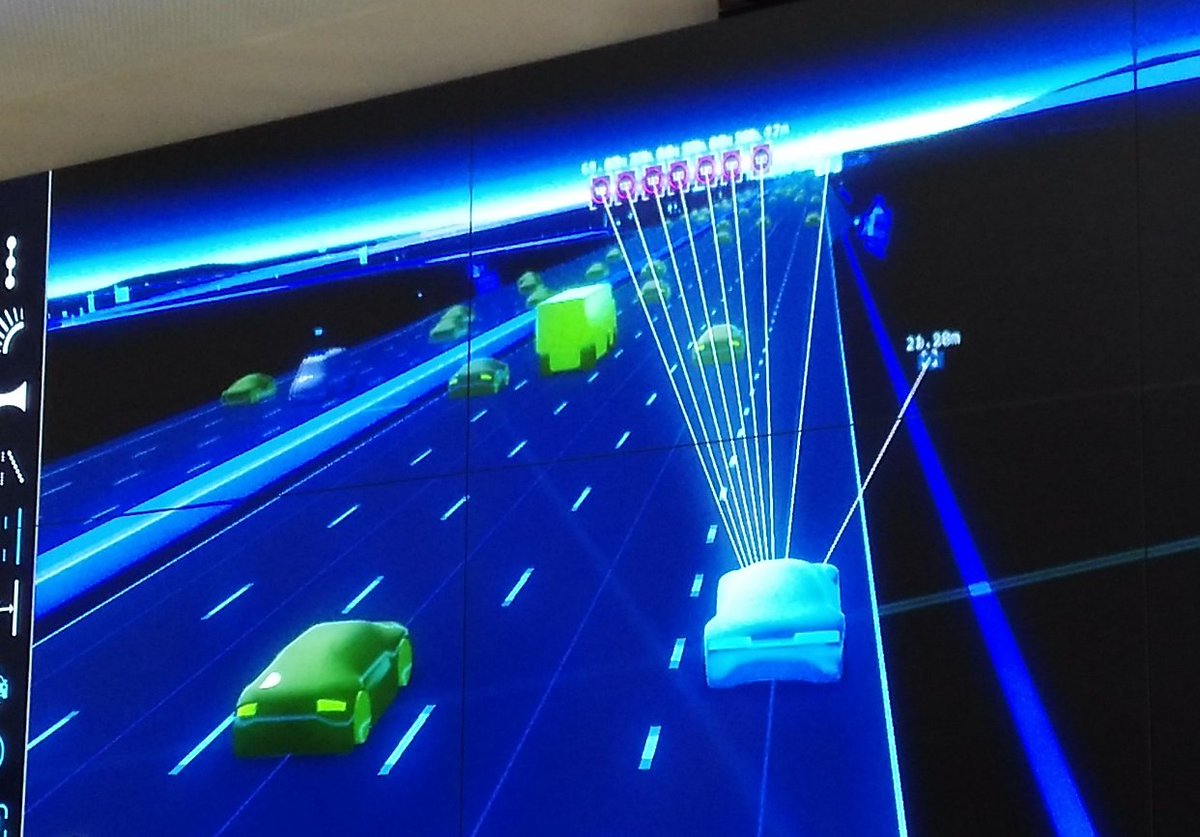
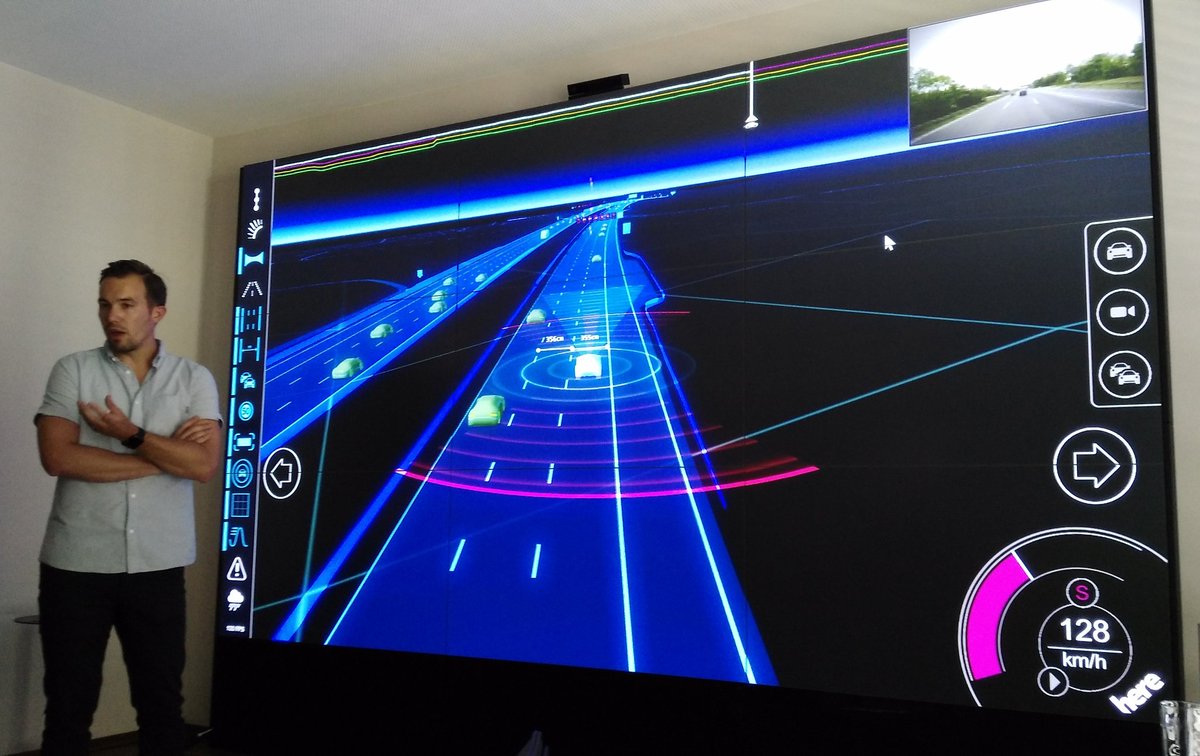
Here’s a visualisation of the datasets that HERE use for self-driving cars. These are datasets designed for machines, not people, and the maps of the datasets, shown here, show the breadth and detail of the information used by self-driving cars to determine road information:
9k=

The data in these maps is highly compressed and delivered to cars, anywhere in the world, in cacheable 2km x 2km squares. (N.B. In one of the three pictures showing the maps of these datasets here, there is a mistake with the data shown. Can you see it? It’s obvious – once you’ve spotted it. No, it’s not that the cars on the wrong side of the road, as it’s showing a German autobhan rather than a British highway. Leave a comment if you find it!)
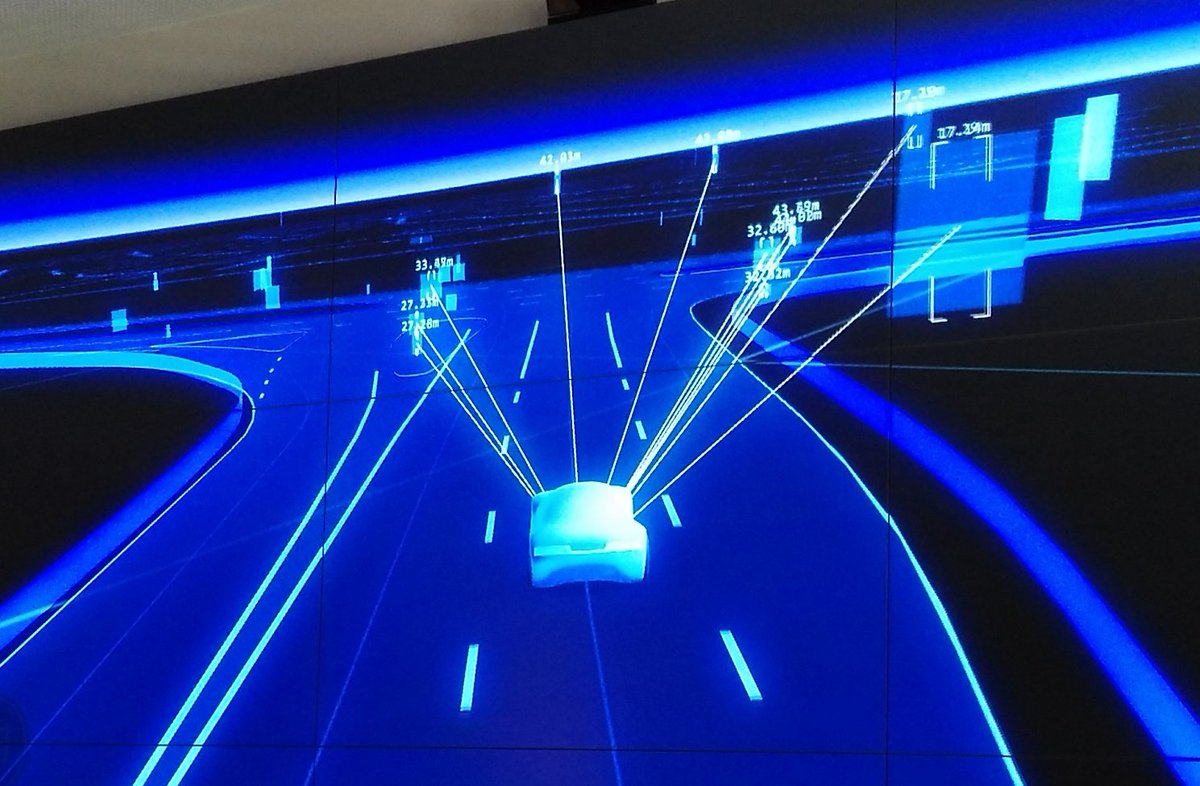
2Q==

Spatial Data Visualisation

HERE also have some nice demo rigs to show their data in a context that is familiar to people, such as using a top-down projection on a 3D model city section, allowing data to be draped over the buildings and street structure:
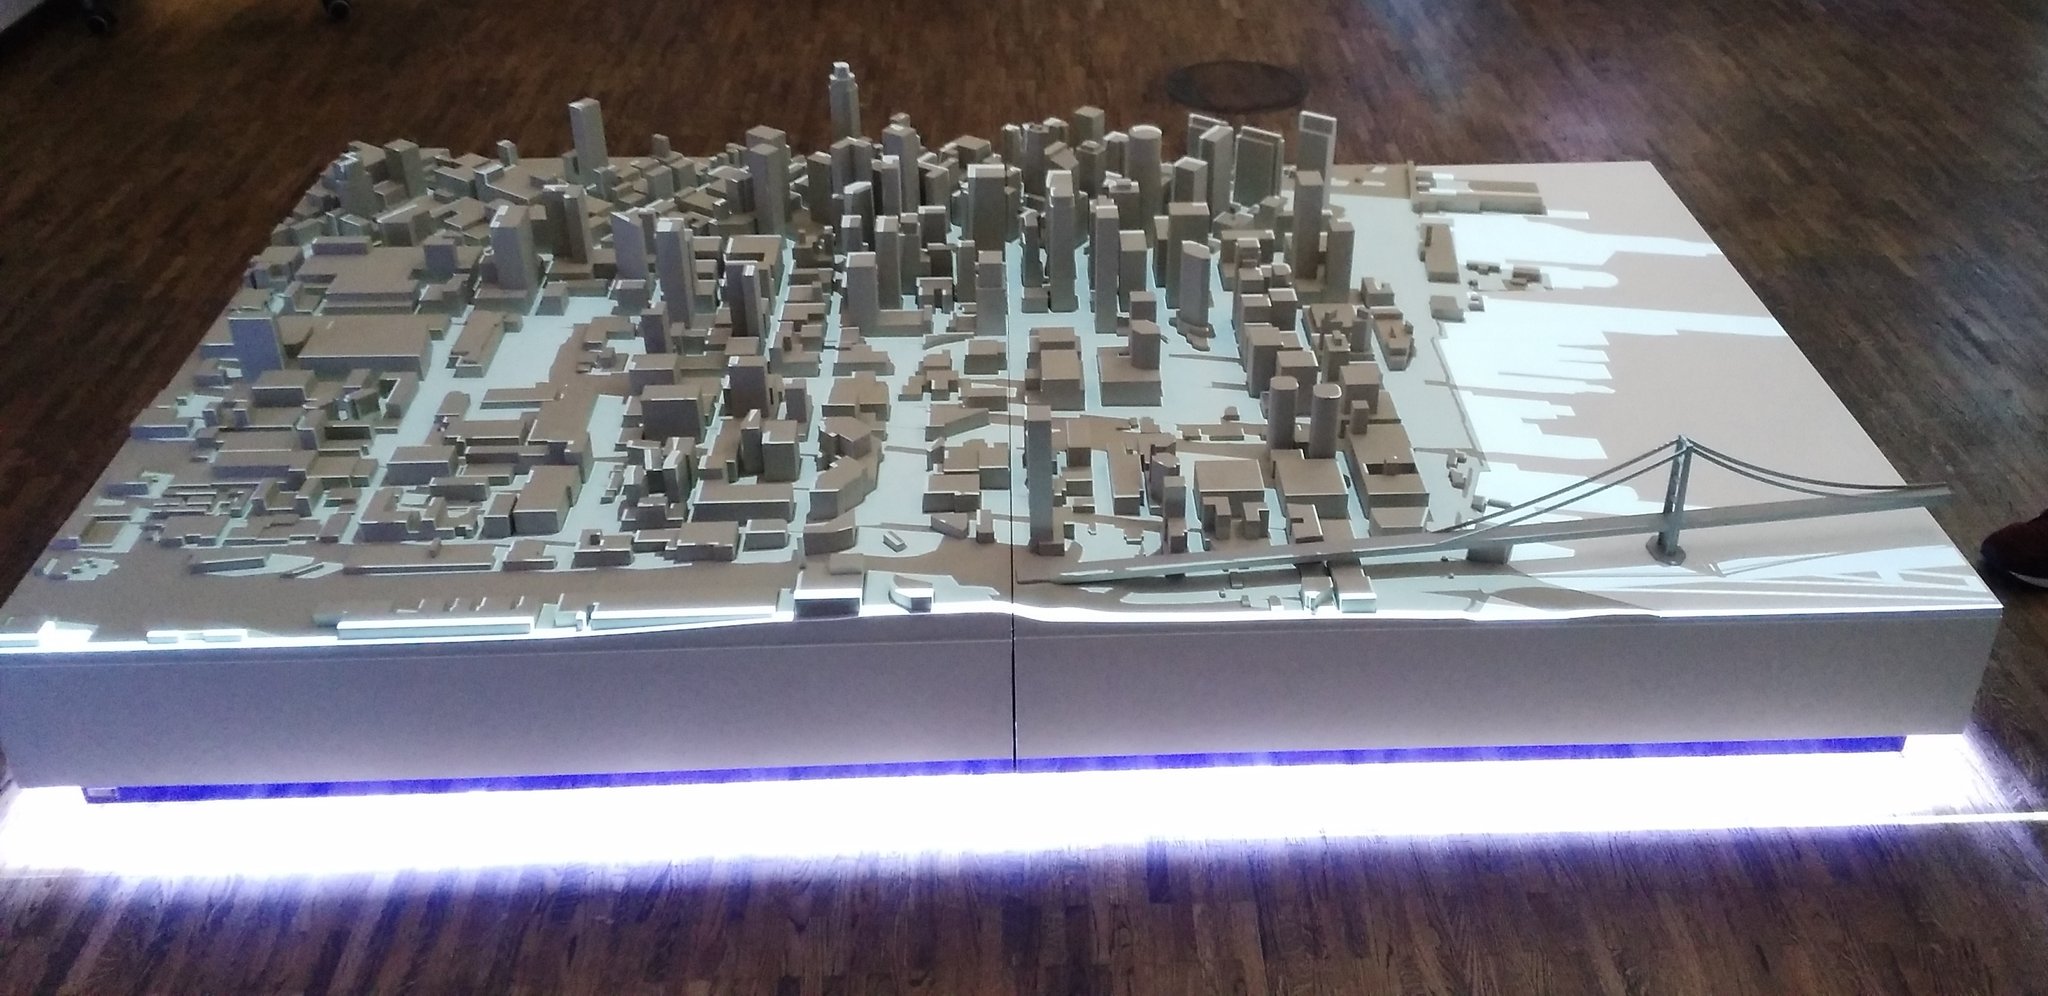
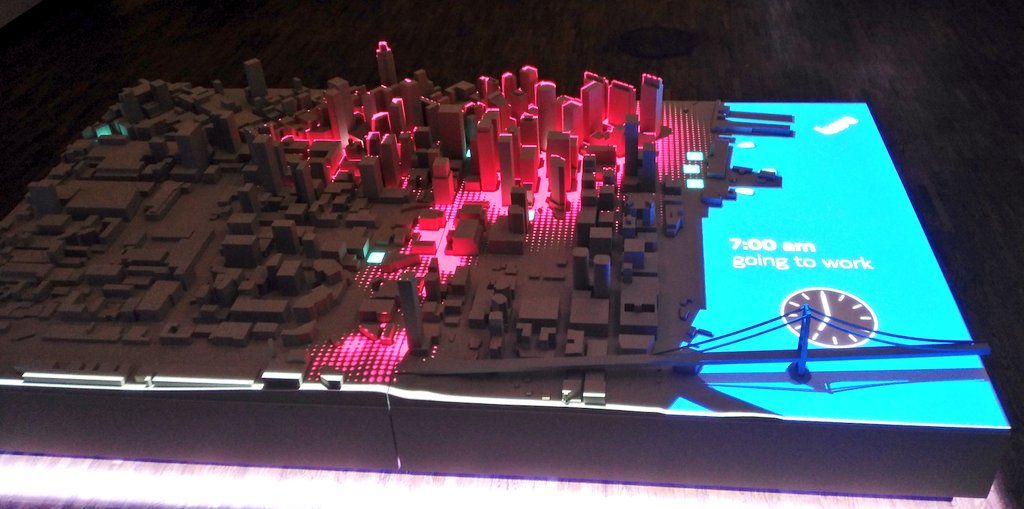
2Q==-1

9k=-1

Transit Demand Modelling

We also saw a glimpse of a microsimulation-based travel demand model (TDM) for central Berlin, with what-if scenarios possible by placing various objects on the screen visualising the output of the model, such as a rain shower or closed road. The transport mode share will likely continue to adjust in large cities throughout the world, while the street network will often remain static, so such models (and associated visualisations) try and predict what will happen on the ground:
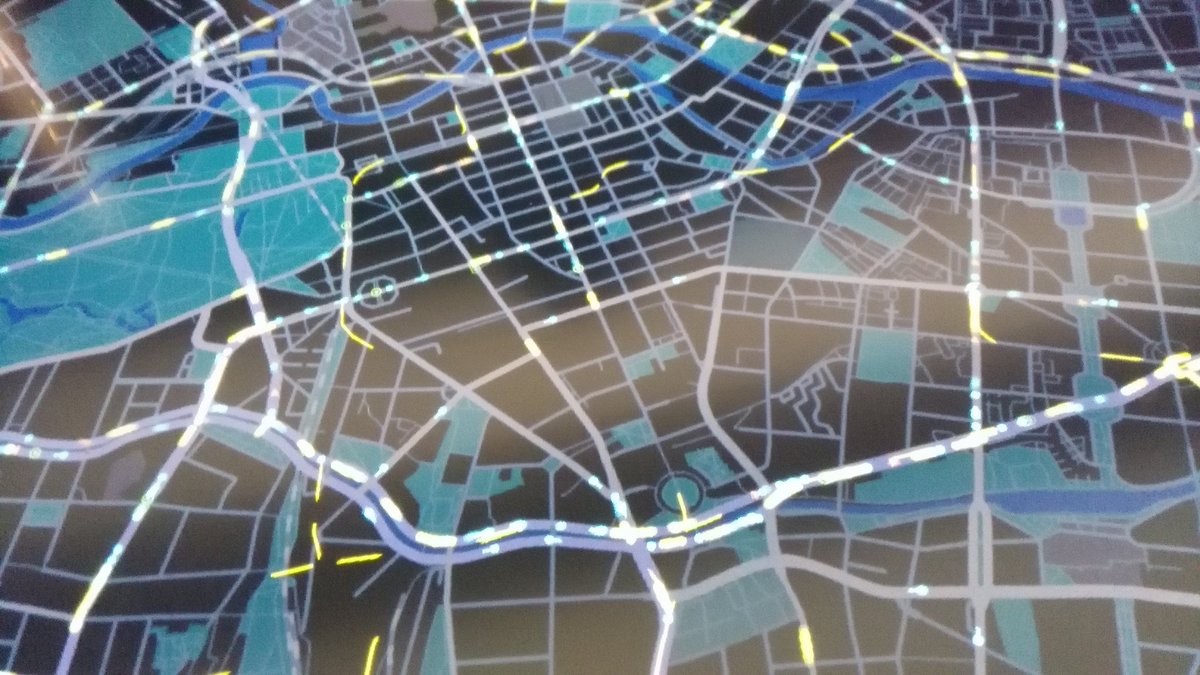
2Q==-2

The other maps shown were in the user interface (i.e. dashboard/HUD) of a car test-rig, which is being used for UX/UI testing of autonomous/mixed-mode driving. I wrote about this in this previous blogpost.

HERE and the Future

Perhaps the most “exclusive” part of the day’s event was an hour long “fireside” chat with the new CEO of the company. As a relatively small group (there were around 10 of us)l, this was an excellent opportunity to grill the top-guy of one of the world’s three from-technology digital mapping providers (as opposed to from-GIS like ESRI or from-paper like the OS). Edzard Overbeek answered every question we threw at him efficiently. I quizzed him on whether indoor digital mapping, the “next frontier” identified by Google at least, will also be a priority for HERE given its new driving focus, to which Mr Overbeek was clear that, in order to be a serious player in the space it needs to be mapping everything, so that a single platform is available cross-use, i.e. if a customer journey ends with a walk through a department store, the platform needs to do the “last 100m” mapping too. It’s clear also that the HERE offline maps app will remain a key part of the company’s offering – not just to realise the value of their existing, long-built-up “consumer-grade” mapping, but to build the “HERE” brand to consumers. Ultimately though, their most important clients are the car companies – both the three that own the company but also others needing a “car mapping operating system”.
Categories
Reviews

Testing Map-Based UIs for Self-Driving Cars: HERE’s Knight Rider

https://www.youtube.com/watch?v=8kSwtVVsx_8&feature=youtu.be

I was kindly invited, earlier this week, to take part in “insideHERE” in Berlin, a small event run at the HERE HQ in Berlin. HERE, being born out of the ashes of Navteq and Nokia Maps, is now owned by a consortium of German car companies. For the special event, HERE’s developers and engineers opened up their research labs and revealed their state-of-the-art mapping and location services work. HERE Auto is making a real play to be the “Sat Nav of the future”, competing directly with Google and Apple to create, manage and augment data between your smartphone and your car. Tomorrow I’ll outline the general visualisation work I saw that demonstrates their high-precision spatial datasets, but first, today, I mention one particular research project which shows how maps will be continue to be a crucial part of driving, even when cars drive themselves.
“Knight Rider” is a test rig, built to simulate a car, where the engineers and UI/UX designers can try out different configurations and locations of controls and maps on a dashboard. They key aspect being tested is how much trust the user can place in the car, based on what they can see and information that is displayed. Testers can sit in the “car” and drive it, to experience map/control designs and, crucially, how it feels to give up the steering wheel but continue to have the confidence that the journey will proceed as planned! Large exterior screens, fans and a windshield provide some depth of realism. The intention is not to create a realistic driving simulator, completely with fully photorealistic buildings and roads, but instead to get the tester as comfortable as possible to evaluate the designs effectively, before they are put in a real test car on the road.

When we saw the rig, it was configured with maps in three places – a short but wide one that wraps across the dashboard, a circular map that sits just to the right of the dashboard, beside the steering wheel, and finally a heads-up display (HUD) that reflects in the windshield, this achieved by a carefully angled screen pointing upwards.

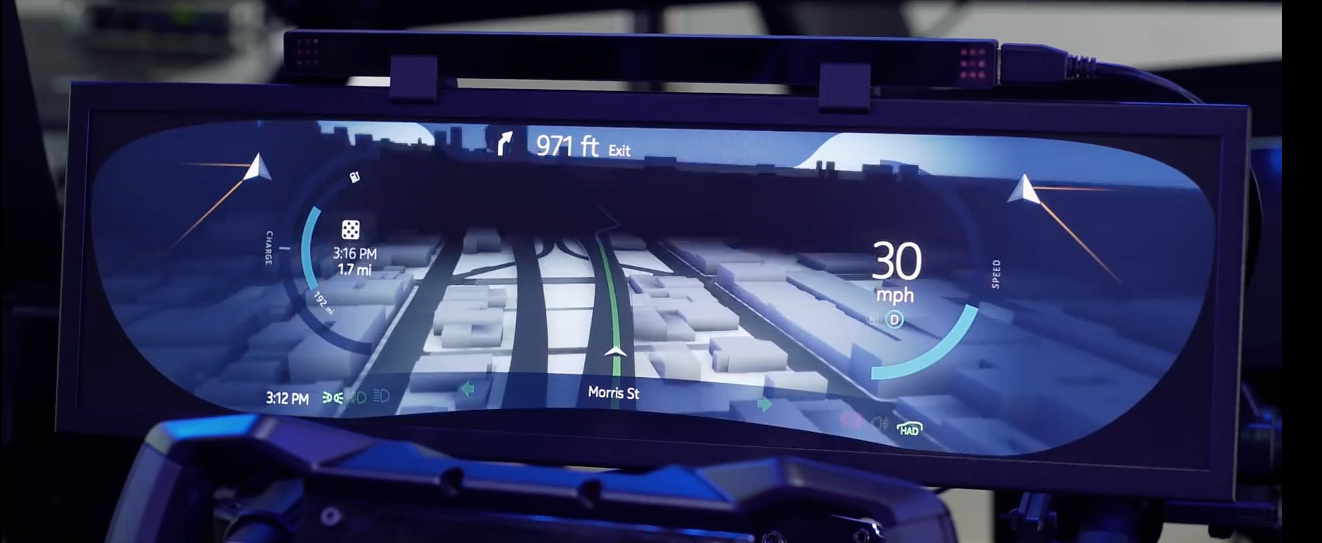
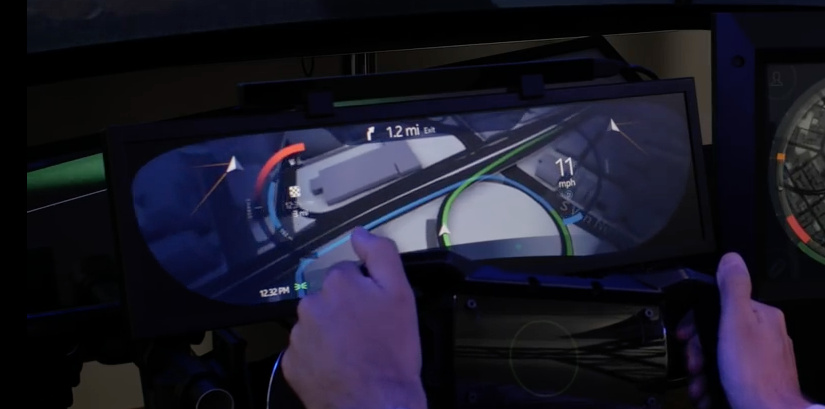
The dashboard map shows a single map, behind the regular digital numbers/dials you would expect on a normal dashboard. The map here switched between a general 3D overview of the journey ahead, when “cruising”, to a more detailed, but still a “helicopter” 3D view, when carrying out manoeuvres such as approaching a destination or a complex junction:

dashmap1

dashmap2

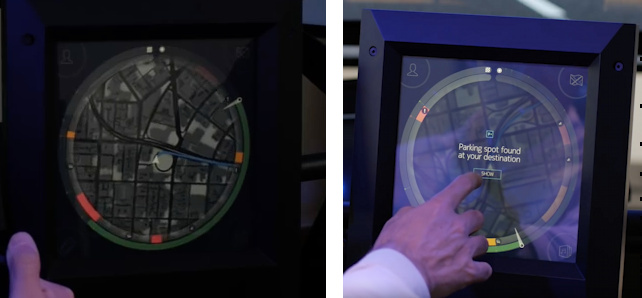
The panel alongside typically shows an overhead map, in a circle with your location on the centre, it rotates as you move:

circlemap
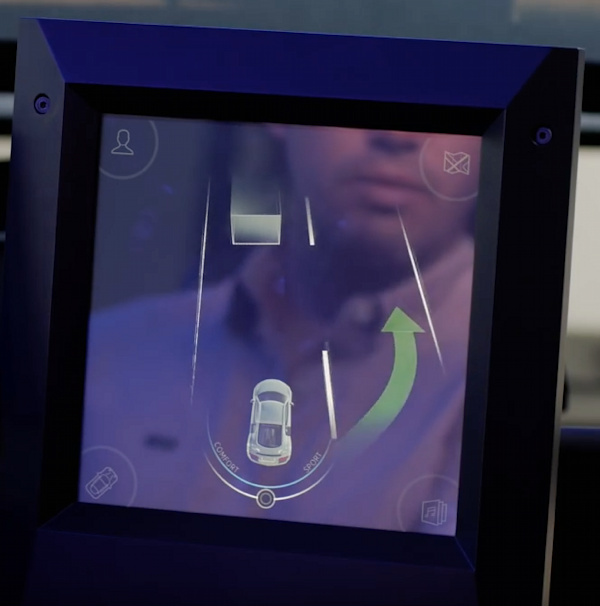
It is also the main drive control panel when not steering, for example if you want to tell the car to overtake a car in front, the AI having decided not to do so already – you are not steering that car here, but “influencing” the AI to indicate that you would like it to do this, if safe:

circlemap2

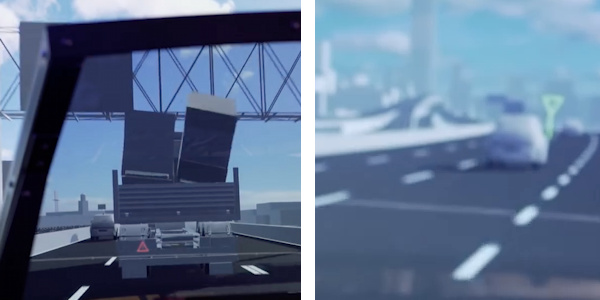
Finally, the HUD necessarily does not show much information at all, apart from a basic indication of nearby traffic (so that you are reassured the computer can see it!) and any indication of hazards ahead. You mainly want to be looking though the window for the traffic yourself, of course:

hud

The key interaction being tested is changing from human to computer controlled driving, and back. The first is achieved by listening for the comptuer voice prompt, then letting go of the steering wheel once asked to. If you don’t retake control of the car when you need to, for instance as you are changing onto a class of road for which autonomous driving is not available, and you have ignored the voice prompts, then then the car will park up as soon as it’s safe to do so.

It’s an impressive simulator and crucial to shaping the UI of the autonomous cars which are starting to appear on the horizon, in the distance, now.

Photos and video courtesy of HERE Maps.

Categories
London

Open Doors: 22 Bishopsgate

22bishopsgate_1

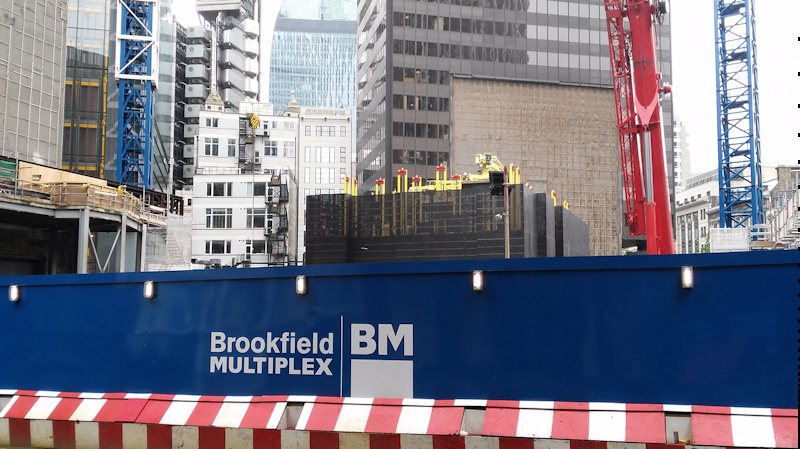
It’s Open Doors week this week, where the public get a glimpse into many construction sites, and this morning I visited the site of 22 Bishopsgate, in the City of London. The site itself has an interesting recent history – it was going to be the Pinnacle, an elaborate, spiraling skyscraper. But construction stopped as the downturn hit hard in 2011, and for the last few years, it’s been nicknamed “The Stump” – an abandoned nine-storey concrete core. It’s taken Brookfield Multiplex, the chief contractors for the new skyscraper, around a year to dismantle the old core, by slicing up the concrete into 8-14 tonne sections, lifting them out, digging back down into and rebuilding the basement to the new design. Finally, pretty much in the last few weeks, they’ve been able to stop digging down and start building up again.

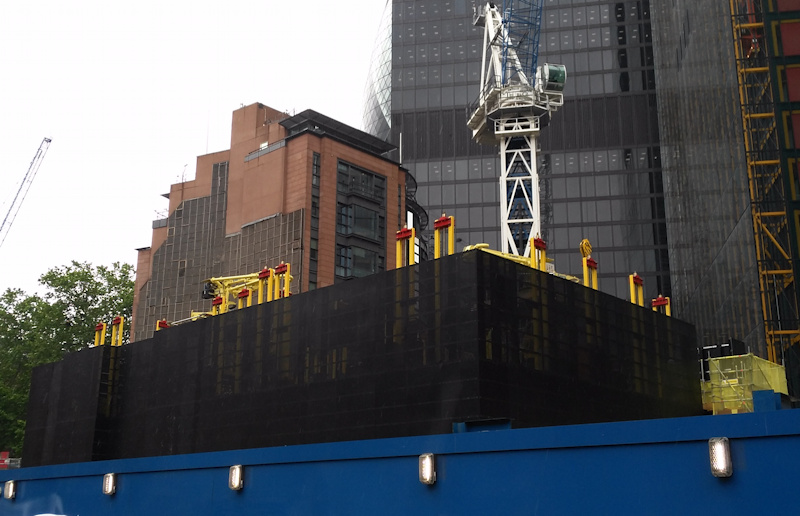
The building will start to rise quite quickly in the next few weeks. The new design consists of two cores – a square-ish one, which will lead a rectangular one alongside. This reflects the non-square shape of the site – it being narrow to the north than to the south, and squeezed to the east by the Cheesegrater and the long-suffering Hiscox building. Both will rise by around a storey a week, with the square one leading the rectangular one by around five storeys, and the metal structure of the floors surrounding the cores another five or so storeys below. Currently, the main core is 2-3 storeys up already and is about to start its long continuous rising phase. The rectangular core, which we looked down on from the elevated viewing platform, is a storey below ground level at the moment, and today is having a temporary wall added to the top of it, creating a platform and work area “raft” that will rise up with it. The square core already has its temporary wall erected, coloured black and made of perforated steel, and can be seen as the main feature in both the photos above and at the bottom, surrounding a small yellow crane and other yellow machinery that will sit on the raft.

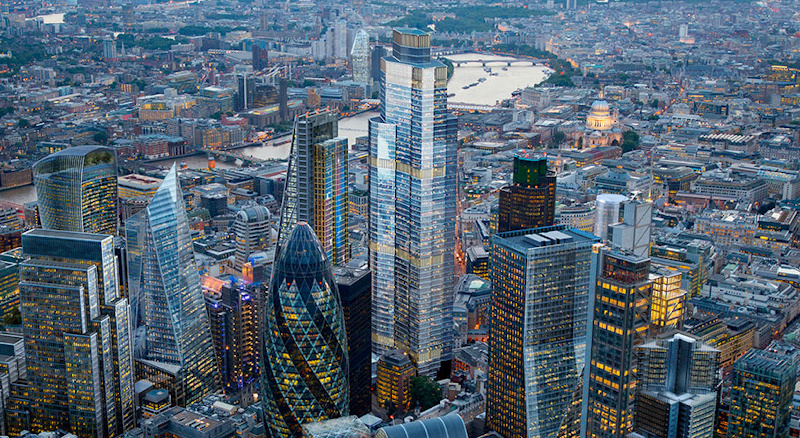
Even with a storey-per-week rise, this process will take more than a year, for 22 Bishopsgate will be a huge “slab” type skyscraper, with vertical walls, stretching an impressive 64 storeys high. It will be only marginally lower than the nearby Shard skyscraper, at 278m. It will fit snuggly in to the skyscraper cluster of the Cheesegrater, Gherkin, Natwest Tower and various others. The design is not “exciting” – it is a straight up-and-down building which is using up its full footprint, but his means it will provide a good balance to the nearby flamboyant Gherkin and Walkie Talkie building. In this artist’s impression, in which it is the obvious tallest building in the cluster here, it looks like an updated, taller/wider and glassier version of the classic Natwest Tower nearby which is just to the right hiding behind another under-construction skyscraper, 100 Bishopsgate:

22_bishopsgate_impression

From the viewing platform, we could also see active work going on for 100 Bishopsgate, just up the road as the name suggests, as well as the recladding and height extension of One Angel Court, and finally a very small tower going up in the small space between Bishopsgate and the Natwest Tower. As part of this latter project and 22 Bishopsgate itself, the Highwalk around the Natwest Tower has now been completely removed. This is a shame – it was a largely unknown but nice elevated walking space. However, I understand that the Highwalk will be rebuilt once both projects are complete, so we will once again be able to walk above the roads and amongst the towers.

Unfortunately we weren’t allowed to take photographers on the tour, but you can see the square core clearly from Bishopsgate now – see the photos here. Our wooden-clad viewing platform can be see in the background of the first photo, on the left.

22bishopsgate_2

Middle image is an artists impression of the completed cluster, from Lipton Rogers.

Categories
Leisure London

A Glimpse into Walthamstow Wetlands

I was on a guided tour of the Walthamstow Wetlands today, a huge area of 10 historic reservoirs that has long been the preserve of fishermen, birdwatchers and water company workers, that is about to be turned into a large, publicly accessible nature reserve. The area is near to the Woodbury Wetlands, which similarly was a largely unknown area of water and reeds that has now been opened up, the guest of honour at the opening ceremony last month being none other than Sir David Attenborough. However, Walthamstow Wetlands is ten times larger, and the London Wildlife Trust, who are delivering the tranformations in both areas and led today’s tour, describe Woodbury Wetlands as just a “dress rehearsal” for the Walthamstow Wetlands area, which is 6 times the size and is due to open in 2017. It will be far and away the largest area of wetland habitat in London and one of the most important in Europe.

ww_reeds2

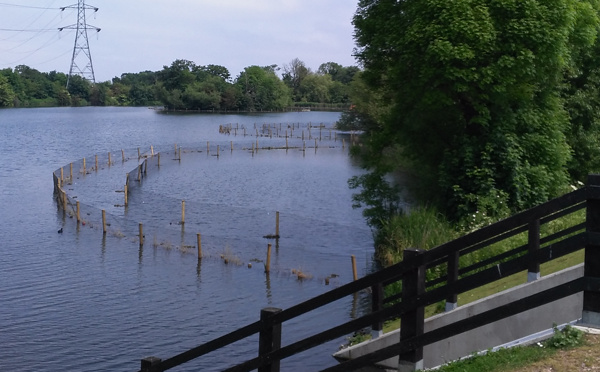
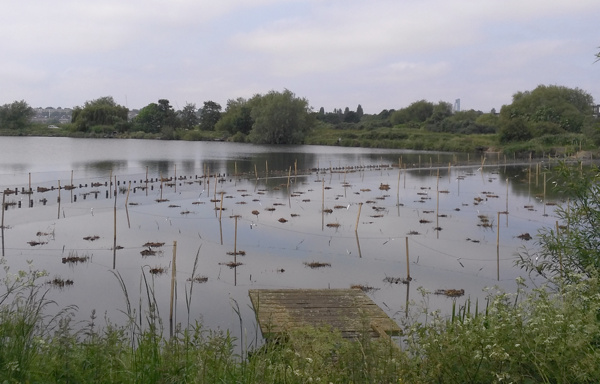
The area is already teaming with birds, other animals, and wildflowers, and some early signs of the conversion are already in progress, compared with my previous visit a few years back. The surface has been laid on a new walking/cycling route that will run the length of the reserve, with two new entrances being created at either end to complement the only current access which is from Ferry Lane in the middle of the reserve. Several areas have been fenced off in the Reservoirs 1, 2 and 3 – the earliest, hand-dug and shallow ones, the aim being to turn these into areas of reed beds to encourage bitterns back into the area. The two main islands, Heron Island and Cormorant Island, are full of their respective birds – the latter island being largely bare of vegetation and full of the squarking animals. Other wildlife spotted included a variety of geese and ducks (some as families), some large fish (the area is a major spot for angling) and many dragonflies. Also, somewhat less fortunately, there was a grass snake near the entrance – run over and squashed presumably by estate traffic.

Plans include complete renovation of the historic engine house in the middle of the site, to act as the main visitor centre, cafe, exhibition and an education facility. The house will have part of its tower rebuilt with hollow bricks, to encourage skylarks to nest. The renovation is well underway with the building gutted and in scaffolding. Various bits of machinery from its days as a pumping house will be retained, although the main pump itself was removed many years ago. At the southern end of the reserve, the central part of the Coppermill building will have a lift added, allowing access into the tower for a great view over the reserve. The look of the building will be carefully preserved, this means the lift will not make it to quite the top of the tower. Access to the reserve, centre and viewpoint will all be free. Possible future plans, subject to the success of the reserve and its ability to be self-funding following opening, will be a second small visitor facility being built in the rest of the Coppermill building, which, for now, remains a storage site for Thames Water.

ww_wildflowers

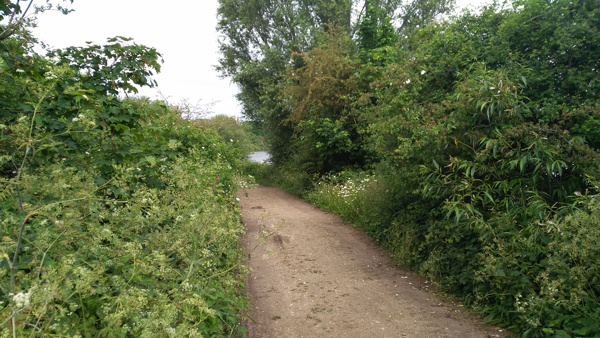
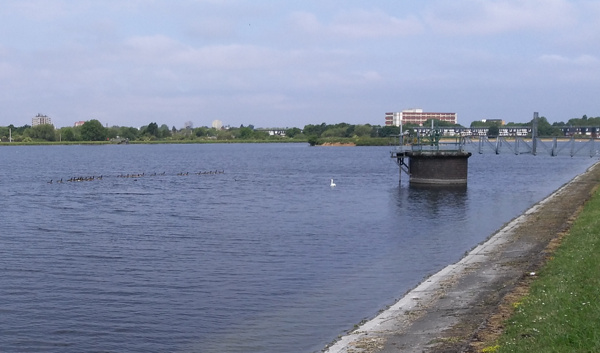
Top and second: Preparation of the new reed beds. Above: One of the tracks through the reserve, which has had bracken removed and has been planted with wildflowers to encourage different kinds of birds. Below: Geese and a swan on another of the reservoirs. Bottom: Looking from Ferry Lane into the north part of the wetlands, which was not part of today’s tour.

ww_water

There is more information about the project on the official website.

ww_north

Categories
CDRC Conferences

Mapping Data: Beyond the Choropleth

I recently gave a presentation as part of an NCRM Administrative Data Research Centre England course: Introduction to Data Visualisation. The presentation focused on adapting choropleths to create better “real life” maps of socioeconomic data, showing the examples of CDRC Maps and named. I also presented some work from Neal Hudson, Duncan Smith and Ben Hennig.

Contents:

  • Technology Summary for Web Mapping
  • Choropleth Maps: The Good and the Bad
  • Moving Beyond the Choropleth
  • Example: CDRC Maps
  • Example: named – KDE “heatmap”
  • Case example: Country of Birth Map – concerns of the data scientist & digital cartographer

Here’s my slidedeck:

(or you can view it directly on Slidedeck).