Categories
Bike Share Conferences

Velo-City Preview

[Updated] I’ll be presenting at Velo-City in Vancouver later this week. Velo-City is the “world’s premier cycling planning conference”. It is likely to have a significant bike-sharing flavour – the lead sponsor being PBSC which designed the 6000-odd “Boris Bikes” (aka Barclays Cycle Hire bikes) that are a distinctive sight in central London, as well as equivalent systems in Montreal, Washington DC, Minneapolis, Boston and (shortly) New York City – known generically as Bixi bikes. Vancouver does not have a bike-sharing system of its own, but PBSC have imported a whole load of their Montreal bikes for delegates to borrow for the week, although a recent collar-bone break means I unfortunately won’t be taking up the offer. I did however spot a PBSC/Bixi bike “in the wild” in Vancouver’s beautiful Stanley Park – see above.

I’ll be talking about some new insights into bike-sharing cities worldwide that have been revealed by my Bike Share Map, as part of a three-part presentation on looking at bike-sharing cities at different scales – my co-presenters being the author of the Bike Sharing World Map, and the software developer behind the B-Cycle bike sharing systems.

My presentation is on Wednesday morning (Pacific time) and I’ll write/tweet about it on the day, wifi-access permitting.

To prepare for the presentation, I’ve added a few new cities to the Bike Share Map: Suzhou, Zhongshan, Wujiang, Shaoxing and Heihe in China; and Kanazawa in Japan. One early insight coming from these new maps could be that the Chinese really do work hard (if you excuse the gross overgeneralisation) – typically 11 hours between morning and evening commuter peaks, and seven days a week!

Hehei is shown below – it’s right on the Russian border, opposite a much larger Russian city – hence the Cyrillic (although no bridges across the river near there!)

Note that, in the maps of the Chinese systems, the docking station locations are slightly misaligned with the background maps because of location obfuscation carried out by that country – I’m using OpenLayers rather than the Chinese-based map service that corrects for the errors. The resulting offset is typically only 1-400m though so you can still get a good idea of the shape and size of each system.

Categories
Olympic Park

Inside the Olympic Park

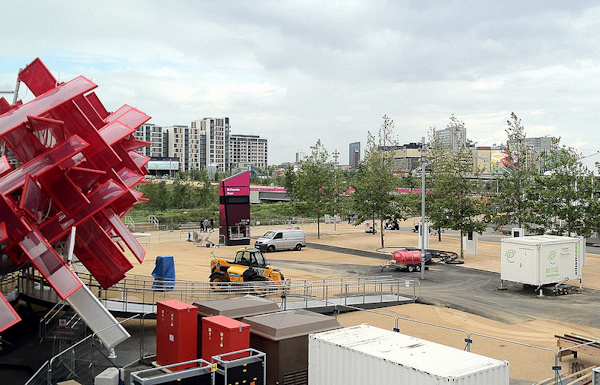
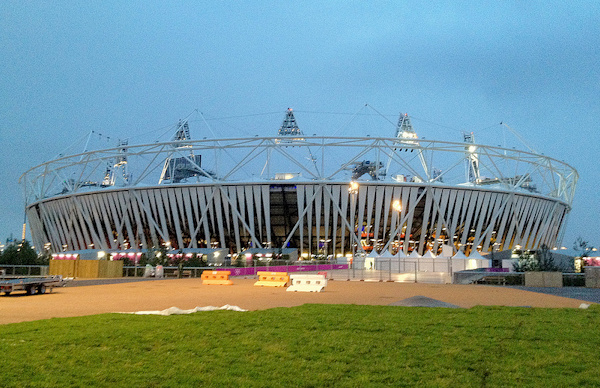
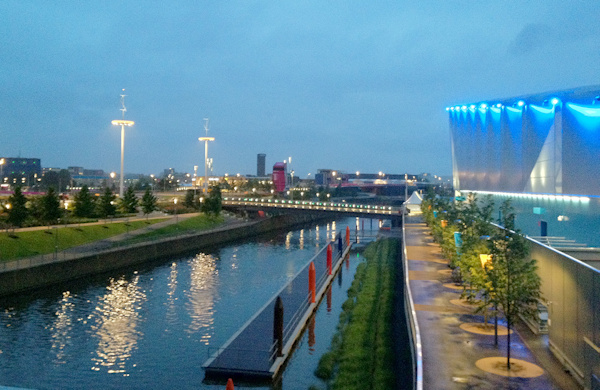
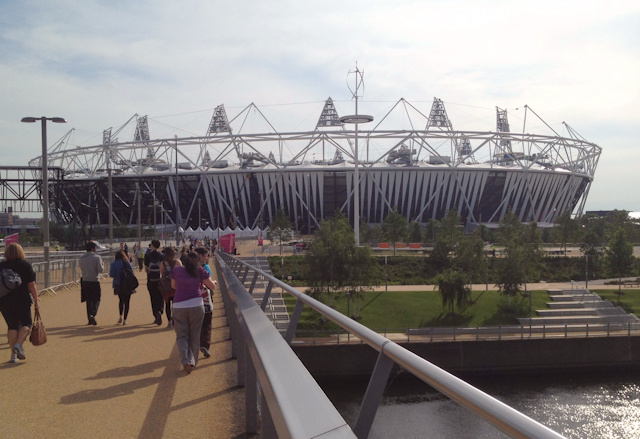
Here’s some new photos from the Olympic Park in east London.

The main changes recently are:

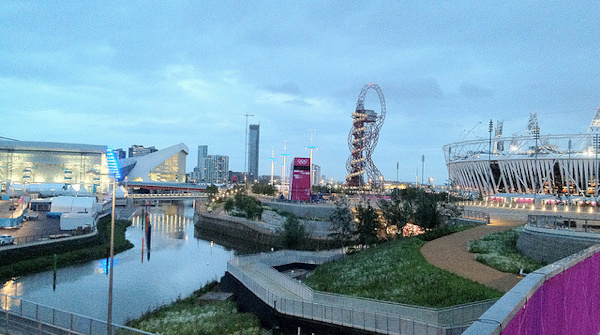
  • It’s the first time the Park feels like a park and not a building site!
  • A more obvious entrance to the park is being created – Stratford Gate – consisting of a pair of large triangular gantries that people will pass underneath. It hasn’t been “dressed” yet.
  • The plastic “wrap” has started to appear around the outside of the Olympic Stadium. Each strip turns inwards near the base and becomes coloured, with seating block numbers appearing on the coloured portion.
  • The giant wooden McDonalds building is nearing completion.
  • Installation of the RUN sculpture outside the Copper Box look about complete.
  • Sponsor pavilions are appearing – Panasonic’s is near the McDonalds and looks quite attractive, although it feels rather out of place in a sporting complex.
  • Cisco has a very large, obvious and ugly brightly coloured pavilion mounted on top of the Westfield Stratford City complex, facing directly out to the park and the Aquatic Centre in particular.

Categories
Olympic Park

New Olympic Park Map

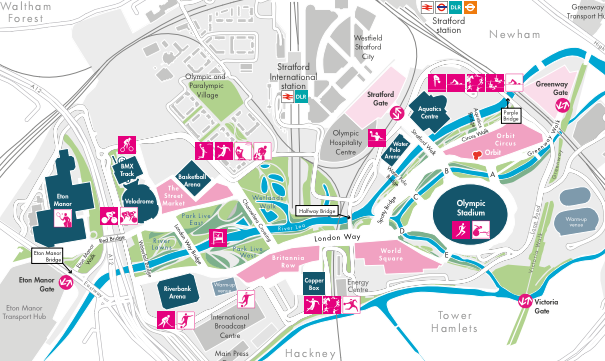
Here’s an updated Olympic Park Map, an extract of which is above. This one is notable as it includes names for many of the bridges in the park.

From north to south:

Eton Manor Bridge
Red Bridge
Waterfall Bridge
London Way Bridge
Channelsea Crossing
Halfway Bridge
Spotty Bridge
Water Polo Bridge
Stratford Walk
Aquatics Bridge
Purple Bridge

There’s also bridges A, B, C, D and E surrounding the Olympic Stadium.
Plus several unnamed bridges in the back-of-house part of the park.

Categories
Notes

Inactivity

So… I fractured my collarbone when I fell off my bike last weekend, cycling too fast through a deeper than expected ford, while on a long cycle through country lanes in Essex. It’s a very minor break, not “clean-through”, but last week was a whole world of pain, and it will still be a few weeks before I’ll be back on my bike and/or running around again.

That’s not to say there won’t be interesting things posted to this blog imminently, though. Later this week I should have a chance to get right inside the Olympic Park. I am hoping to take some photographs of the park, as the finishing touches are made to the landscaping and the buildings.

Categories
Technical

CityDashboard – the API

Here is the API documentation for CityDashboard. It’s really not a very advanced API, and it’s not delivered in a “proper” format (e.g. XML or JSON), instead it’s available as a number of CSV/TXT-formatted files. It ain’t pretty but it works!

I’ve put together this documentation as a number of people have asked. However, it should still be considered to be a “private” API, so could change or break at any time, for one of three likely reasons:

  • I make a change to the API structure. If it’s a big change, I will attempt to preserve the old structure, possibly by using an extra parameter (e.g. &v=2) to indicate the new one.
  • Our server goes down. Certainly not inconceivable!
  • One of the upstream data providers changes their feed format in such a way that it causes the CityDashboard data to freeze up. Again, quite likely, particularly as generally I don’t have a formal agreement with the upstream organisations.

1. Finding the cities available

The list of cities available can be found at:
http://citydashboard.org/cities.txt

Notes:

  • Comma-separated.
  • The city_id is the first field of each line.
  • Ignore lines starting with #.

2. Finding the modules available for a city

The list of modules available for london can be found at:
http://citydashboard.org/cities/[city_id].txt

Notes:

  • Comma-separated.
  • The module_id is the first field of each line.
  • Ignore lines starting with #.

3. Getting the data for each module

The data for each module can be found at:
http://citydashboard.org/modules/[module_id].php?city=[city_id]&format=[csv|html|blob]

Example:
http://citydashboard.org/modules/weather_cr.php?city=london&format=csv

Notes:

  • Comma-separated or HTML, depending on the format parameter you use.
  • Ignore lines starting with #.
  • The CSV format will be most useful, as the HTML and “blob” formats are specifically designed for the CityDashboard website. However, many of the modules don’t (yet) have a CSV format feed available – a blank page will instead be returned.
  • The first line in each CSV file contains a number in the second field. This is the number of seconds between each update. i.e if this is 5, then the file won’t update more than once every 5 seconds.
  • Modules which have a CSV feed for them, have an “m” included in the sixth field in the appropriate row in the london.txt file (typical values, d, db, dbm etc)

By the way, the module list will most likely be changing very soon to add a couple of important fields that I overlooked – first of all, the source URL will be in a field of its own, and secondly I will add in a proper attribution statement for each source.

Categories
Technical

The MySQL Groupwise Maximum Problem

There is a surprisingly difficult task to solve with MySQL queries, which I’ve been spending some time trying to do – the Groupwise Maximum problem.

This is the name for the type of query that I was trying, although in fact I am trying to find a set of minimum (rather than maximum) values.

The question: What is the time each day that we a see a minimum of available bikes for? (a research question – as finding this answer will tell us something about the commuting habits of the city.)

The source data table:

timestamp bikes_available
2012-05-29 17:12:00 4265
2012-05-29 17:14:00 4251
2012-05-29 17:16:00 4251
2012-05-29 17:18:00 4253
2012-05-29 17:20:00 4259
etc…

My initial thoughts were:

select date(timestamp), time(timestamp), min(bikes) from bike_agg_london group by date(timestamp)

date time bikes_available
2012-05-22 00:00:01 4662
2012-05-23 00:00:02 4600
2012-05-24 00:00:02 4594
2012-05-25 00:00:01 4805
2012-05-26 00:00:01 4144
2012-05-27 00:00:02 3710

This produces the minimum bikes number for each day, which is great, but the timestamp included is just the first one of each day (in fact it could be a randomly chosen timestamp from within the day, but MySQL’s internal logic happens to pick the first one out). This is because the time(timestamp) is not part of the “group by” (aggregate) clause, and all fields in a query must be included in the group by unless they are part of the aggregate. I don’t want to aggregate the time(timestamp) though – I want the value associated with the minimum bikes, rather than the maximum, minimum or average (etc) value.

Here’s 10 ways to solve the problem, although I tried a few and they didn’t work for me.

Here’s a technique that worked for me (the second solution)

Here’s the SQL that worked for me, quite quickly (~18 seconds for around 166000 rows representing 600 days):

select date(b1.timestamp) theday1, b1.timestamp, b1.bikes from bike_agg_london b1 inner join (select date(timestamp) as theday2, min(bikes) as min_bikes from bike_agg_london group by date(timestamp)) b2 on (date(b1.timestamp) = b2.theday2 and b1.bikes = b2.min_bikes)

date time bikes_available
2012-05-22 2012-05-22 18:22:01 4662
2012-05-23 2012-05-23 18:12:02 4600
2012-05-23 2012-05-23 18:16:01 4600
2012-05-24 2012-05-24 18:18:01 4594
2012-05-24 2012-05-24 18:20:02 4594
2012-05-25 2012-05-25 17:54:02 4805
2012-05-26 2012-05-26 15:56:01 4144
2012-05-27 2012-05-27 17:24:01 3710

It’s the second solution from the above link. There is one problem, where if there are multiple rows in a day that share the same min(bikes) value, they each appear. Using distinct won’t get rid of these, because the time(timestamp) does vary. The fix is to use an additional wrapper (tables co3) to eliminate these duplicate rows:

select theday1, time(min(timestamp)), bikes from
(select date(b1.timestamp) theday1, b1.timestamp, b1.bikes from bike_agg_london b1 inner join (select date(timestamp) as theday2, min(bikes) as min_bikes from bike_agg_london group by date(timestamp)) b2 on (date(b1.timestamp) = b2.theday2 and b1.bikes = b2.min_bikes)) b3 group by theday1, bikes

date time bikes_available
2012-05-22 18:22:01 4662
2012-05-23 18:12:02 4600
2012-05-24 18:18:01 4594
2012-05-25 17:54:02 4805
2012-05-26 15:56:01 4144
2012-05-27 17:24:01 3710
Categories
Orienteering Events Log

A Room for London

I was lucky enough to get invited for dinner last night at A Room for London which is a boat/artwork perched on the top of the Queen Elizabeth Hall on South Bank (beside Waterloo Bridge), to discuss CityDashboard in the context of a future project, Big Data in the Londonscape. Thank you very much to the artists for inviting me a long for a nice dinner and discussion in unusual and scenic surroundings!

My photos from the evening are on Flickr.

Categories
Bike Share

NYC’s Bike Share Approaches

New York City last week released a preliminary map showing the proposed sites for the launch of its bike sharing scheme, now named Citi Bike (with Citigroup being the lead sponsor along with Mastercard).

Citigroup’s sponsorship is crucial for the scheme, which has promised no public subsidy on at least operating costs, and is a rather convenient sponsor in terms of its name. In several other cities around the world, their bike share schemes are known as City Bikes, such as Stockholm and Vienna, so Citi Bike has a good chance of becoming the “on the street” name for the scheme, unlike the unwieldy “Barclays Cycle Hire” name we have here in London – most people here know them as the snappier, if politically incorrect “Boris Bikes”.

NYC’s scheme is clearly influenced by London’s – its of a similar size, it has a big sponsor from financial services and a mayor fully behind it, and a Boris Bike from London even appears on the front cover of the NYC DOT presentation to communities. The technology used is the same and the bikes are also the same design.

I’ve extracted the data from the official map and added it to my own set of maps for 50+ bike share cities across the world allowing for a direct comparison between the scheme and the existing ones. The initial map has 413 stands – the districts either side of Central Park are missing, as is central Brooklyn, as these areas are still undergoing consultation and will gain coverage next year. The scheme should be opening this summer and is then due to expand by 50% by Autumn 2013.

The stand sizes and descriptions are also from the official map, and I’ve simulated the empty/full status of each stand, based on the distance from Wall Street and random perturbation. This results in just under 7000 bikes, based on a roughly 1:1 empty to occupied stand ratio, which is fairly standard around the world.

New York vs London

New York London
System Name Citi Bikes Barclays Cycle Hire
Bicycle design Devinci/PBSC Devinci/PBSC
Operator Alta Bicycle Share Serco
Lead sponsor deal $41m over 5 years £25m ($40m) over 5 years
Bikes (at launch) 7000* 4200
Docks (at launch) 13639 7685
Stations (at launch) 413 345
Largest station size 128 126
Average station size 33 19
Ratio bike:docks 1:1.95 1:1.83
System footprint (at launch) 53 km2 42 km2
Annual membership $95 £45 ($72)
24 hour membership $4 £1 ($1.60)
Max free journey time (24h mmbr) 30 minutes 30 minutes
Max free journey time (annual mmbr) 45 minutes 30 minutes
Single metro journey (smartcard) $2.25 £2** ($3.20)
Single metro journey (cash) $2.50 £4.30 ($6.90)

* Announced figure. Actual figure may be less due to bikes in maintenance and temporary storage. London’s equivalent figure was 6000 bikes. ** Zone 1 only. Cost higher if travelling to Zone 2 (which has bike share bikes in it). Cost lower if only in Zone 2.

What stands out for me, when comparing New York‘s and London‘s bike share schemes, which are roughly similar in terms of number of bikes and stands, is that NY’s footprint is similar in size to London’s at launch , but with many more bikes, and the scheme is accordingly more dense. Certainly, New York will have the critical mass of stand locations, so allow the scheme to work efficiently – you’ll never have to travel very far, if your destination stand is full, to find another one.

The other thing that strikes me is that all the stands are quite big – very few of them have less than 20 docks. The biggest, on Pershing Square (by Grand Central Station) has 128 docks – this is ever so slightly larger than our own “superdock” at Waterloo Station and presumably designed with a similar purpose of satisfying the commuter “tide”. The other big commuter station in NYC, Penn Station, has three large docks surrounding it. The coverage is also fairly uniform, my only surprise is that there are only two docks in Battery City, which is surely full of people likely to use the scheme – or perhaps they just walk to work? Also there are none in Central Park – although perhaps these will be included in the Upper East/Upper West areas for next year’s expansion?

One big difference is the fee structure – at $10 a day but only $95 a year, this suggests that tourists and public-transport-based commuters are the target users, rather than local residents and errand users. This is a pity – the latter group tends have more heterogenous usage flows and help “mix” the scheme up and redistribute it organically, requiring less redistribution of bikes trucks by the operator.

$10 is four times more than the cost of the New York subway ($2.50/trip with Metrocard) so you would need to do at least four journeys a day to save money. In London, our tube in Zone 1 is £2 per journey with Oystercard) or £1 a day on the Boris Bikes. So end up often using the latter simply on cost, even for one journey. The over-30-minute journey extra cost is also significantly more – $4 compared with £1 here. Subscribers get 45 minutes free rather than 30 minutes. This gives those commuters a chance to travel further in the busy rush hour – although surely this increase the redistribution challenge even further.

NYC’s CitiBikes are thinking big, and the design of the scheme suggests that it is expected to be wildly successful at launch. Hopefully this will prove to be the case!

You can see my map here.

Photo credit: Edward Reed / NYC Mayor’s Office
Categories
Conferences

WhereCampEU 2012

I was at the third WhereCampEU “unconference” which took place in Amsterdam over the last weekend of April, following previous editions in London and Berlin which I was also at. The meeting was an ideal opportunity for me to feature CityDashboard which I unveiled at the CASA Smart Cities conference a week before, and to show a couple of the items that were popular at the exhibition that accompanied Smart Cities – namely the London Data Table and PigeonSim.

Amsterdam proved to be a challenging city (financially) to visit for the conference, as it was the weekend before Queen’s Day – which is essentially a massive party throughout central Amsterdam, resulting in expensive transport to get there and all the central hotels being booked up or extremely pricy. So it was that I ended up on the outskirts of the city, overlooking a motorway, although this did mean I got to use the very fast and efficient metro service into town each day. Pre-conference drinks were held upstairs in De Waag, the oldest non-religious building in Amsterdam and a fantastically atmospheric venue. The conference venue was a short walk from here.

To get to Amsterdam I took the Eurostar to Brussels, spent an hour and a half cycling around the city on one of the Villo bike-share bikes, and then got another high-speed train to Amsterdam. A nice way to see the countryside, but it did take six hours in total. My return was a 40-minute flight.

Unconferences have no set speaker schedule, but instead participants put a post-it note with their talk title on a grid of times and rooms, and everyone looks at the grid to determine what to go to next. The plan had been to present early on the Saturday and then just relax and enjoy the rest of the meeting, but the Saturday grid was very quickly full, and it wasn’t until Sunday lunchtime that I was able to squeeze in my talk. Although 26 minutes of my 30 minute slot was spent on CityDashboard, most of the tweeted photos were of PigeonSim (that I squeezed in the last four minutes) and my attempts at demonstrating the flying gestures…

There was as usual a wide range of geo and tech talks, one of the most unusual being a psychogeography session with Tim Waters – this unexpectedly involved a practical where we went out in groups and followed and observed pedestrians going about their business (an initial “meta” idea to follow the followers having been vetoed by Tim). I also enjoyed Jeremy Morley’s update on the OSM-GB project at Nottingham to quantify the quality of OpenStreetMap in the UK, and Peter Miller’s peek at a 2.5D rendering of OSM data. Peter also showed behind the scenes of ITO Map’s map layer scripts, these produce simple overlays highlighting particular OpenStreetMap content – these were the inspiration for similar functionality I incorporated into GEMMA. Finally, a short Geo-yoga (mimicing the shapes of countries) session was certainly an eye-opener. Parallel sessions meant I missed some more interesting talks, including one from Google on why Google can work with OSM.

Thanks to all the organisers for putting on another excellent, and free, WhereCampEU!

Categories
Geodemographics

Modal Council Tax Bands in England

Here’s a map of England, overlaid on it is a choropleth map showing the modal (i.e most common) council tax band within each Census Output Area (OA) in England, based on March 2011 data released by the Office of National Statistics and listed on data.gov.uk.

I’m using a manually created colour ramp instead of a “standard” (i.e. ColorBrewer) diverging or sequential ramp, to emphasise the outliers (the big, expensive Band H houses and the small, cheap Band A ones) and try and reduce the “patchwork quilt” effect that you get when looking at such a map (which has nearly 170000 areas.) Another way to minimise this effect would have been to use larger geographies (LSOAs and MSOAs) at the smaller scales.

The map shows a swathe of light blue Band A housing across the north of England, and in Birmingham. In London, generally this doesn’t happen, and indeed a band of very large, expensive houses, protrudes from the affluant commuter belt right into the centre of London, from the south-west and north.

The map was created using UCL CASA’s MapTube, with a CSV file, descriptor file and stylesheet being the inputs. Welsh council tax bands use a different scale so are not included here. The Scotland/N.I. data is not available through the ONS website.

A gotcha when producing this map is that the file uses the new (2011) identifiers for OAs. Thankfully I found a file that maps the old to the new ones, although it took a bit of sleuthing to find it on the ONS website.

A zoomable, explorable version of the map is available..