Categories
Bike Share

More Cities, More Bikes, More Data

Screen Shot 2014-05-06 at 16.06.21

I presented some research I’ve carried out at CASA, at the Cycle City conference in Leeds last week. The research shows how the numbers of bikeshare bikes and docking stations have varied between 2010 and 2014, for 46 systems across the world (not all systems have numbers for whole period of study). The numbers are from the database which backs my live global map.

View the slides from my presentation here.

The work has been written up into a CASA Working Paper (#196). The appendix includes the numbers of bikes and docking stations, for the 46 systems, across eight periods of collection in six-monthly intervals from October 2010. You can view the paper as a PDF by following the link above.

Categories
Bike Share

5.5 Million Journeys at NYC Bike Share

nycbikeshare_journeys

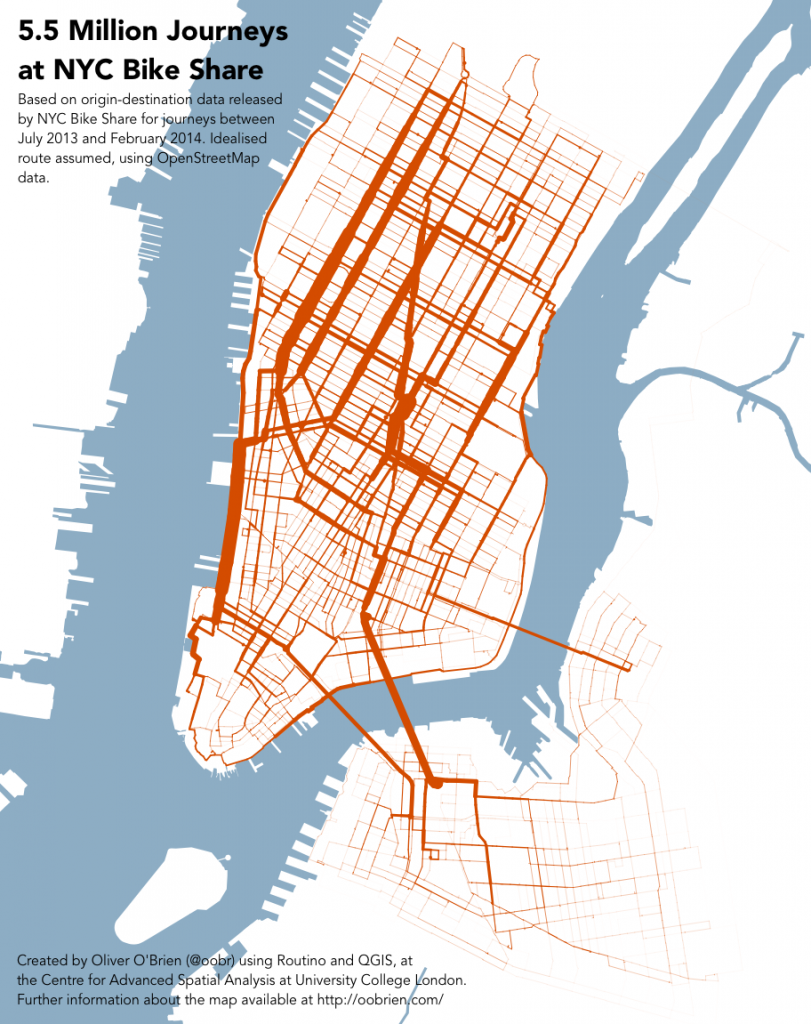
[Updated – timeperiod-split maps added] Following on from my London bikeshare journeys graphic, here is the same technique applied with the data released by NYC Bike Share (aka Citi Bike) earlier this week.

If you look carefully at the full size map you can see a thin line heading north-eastwards, initially well out of the bikeshare “zone”, representing journeys between Williamsburg and Central Park, via the Queensboro Bridge cycle path. We see a similar phenomenon for journeys between Tower Bridge and Island Gardens in London. Whether any of the riders actually take this route, of course, is open to question – they might take a longer – but more familiar – route, that stays more within the area of the bikeshare.

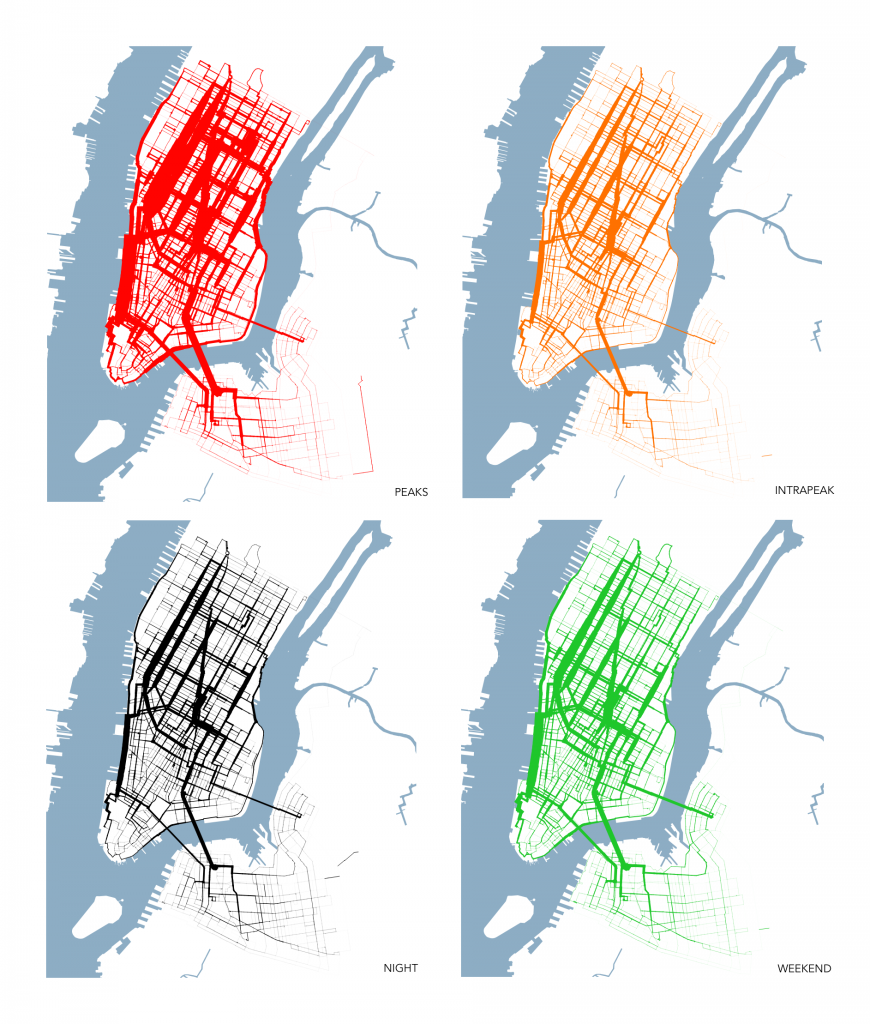
Below is a version of the graphic with the data split into four timeperiods – weekday rush-hour peaks (7-10am and 4-7pm starts), weekday interpeak (10am-4pm), weekday nights (7pm-7am) and finally weekends. The data is scaled so that the same thicknesses of lines across the four maps represent the same number of journeys along each street segment – but bear in mind that there are fewer weekends than weekdays. While, as would be expected, the rush-hour peaks see the most number of journeys, there is less spatial variation across the city, between the four timeperiods, than I expected. Click on the graphic for a larger version.

timesplits

The graphics were produced by creating idealised routes (near-shortest path, but weighted towards dedicated cycle routes and quieter roads) between every pair of the ~330 docking stations in the system, using Routino and OpenStreetMap data (extracted using the Overpass API). Edge weights were then built up using a Python script, a WKT file was created and then mapped in QGIS, with data-based stroke widths applied from the weights.

The routes are only as good as the OpenStreetMap data – I think the underlying data is pretty good for NYC, thanks to great community work on the ground, but there is still a possibility that it has missed obvious routes, or proposed wacky ones. It also doesn’t account for journeys starting or ending at the same place, or journeys where the prime purpose is an exploration by bike – with the user unlikely therefore to take an “obvious” A-B route.

Even with that caveat, it’s still a revealing glimpse into the major route “vectors” of bikeshare in New York City.

Categories
Bike Share Data Graphics London

London Cycle Hire on the Cover of BMJ

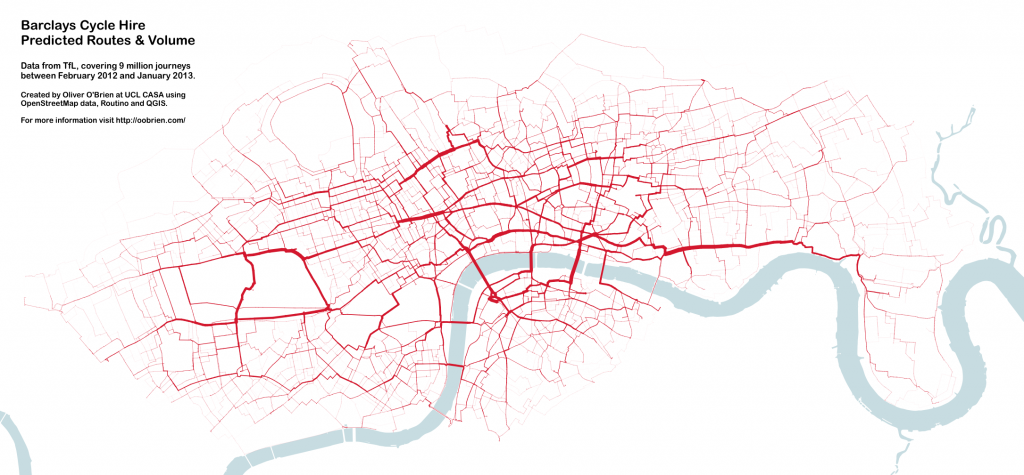
7946.cover_89I produced this data map which forms the front cover of this week’s British Medical Journal (BMJ). The graphic shows the volumes of Barclays Cycle Hire bikeshare users in London, based on journeys from February 2012 to January 2013 inclusive. The routes are the most likely routes between each pair of stations, as calculated using Routino and OpenStreetMap data. The area concerned includes the February 2012 eastern extension to Tower Hamlets (including Canary Wharf) but not the December 2013 extension to Putney. The river was added in from Ordnance Survey’s Vector Map District, part of the Open Data release. QGIS was used to put together the calculated results and apply data-specified styling to the map.

The thickness of each segment corresponds to the volume of cyclists taking that link on their journey – assuming they take the idealised calculated route, which is of course a not very accurate assumption. Nevertheless, certain routes stand out as expected – the Cycle Superhighway along Cable Street between the City and Canary Wharf is one, Waterloo Bridge is another, and the segregated cycle route south of Euston Road is also a popular route.

The graphic references an article in the journal issue which is on comparing health benefits and disbenefits of people using the system, with comparison to other forms of transport in central London. Pollution data is combined with accident records and models. The paper was written by experts at the UKCRC and the London School of Hygiene and Tropical Medicine (LSHTM) and I had only a very small part in the paper itself – a map produced by Dr Cheshire and myself was used to illustrate the varying levels of PM2.5 (small particulate matter) pollution in different parts of central London and how these combine with the volume of bikeshare users on the roads and cycle tracks. The journal editors asked for a selection of images relating to cycle hire in London in general and picked this one, as the wiggly nature and predominant red colour looks slightly like a blood capillary network.

A larger version of the graphic, covering the whole extent of the bikeshare system at the time, is here or by clicking on this thumbnail of it:

bmjfinal

Very rare journeys, such as those from London Bridge to Island Gardens, have faded out to such an extent that they are not visible on the map here. An example route, which the map doesn’t show due to this, goes through Deptford and then through the Greenwich Foot Tunnel.

For an interactive version of the graphic (using a slightly older dataset) I recommend looking at Dimi Sztanko’s excellent visualisation.

Categories
Bike Share

Citibike beating Barclays Cycle Hire

NYC Citibike’s meteoric rise continues – for October, the New York City bikeshare beat London’s Barclays Cycle Hire on average journeys per day, for both weekdays and weekends. Even more impressive considering that it’s only just over half the size.

Thanks to this release published today at the London Data Store, and this daily updating data from New York, I’ve been able to plot month-by-month figures, for the last three years for the Barclays Cycle Hire, and the last few months for Citibike, on the same graph. I’ve split out weekdays and weekends. Grey/black is New York City’s Citibike, while the colours (red, orange, green, blue) are the Barclays Cycle Hire for 2010, 2011, 2012 and 2013 respectively.

bch_numbers_monthbymonth

Click for the large version.

What’s even more impressive is that Citibike is currently physically smaller than London’s Barclays Cycle Hire. It currently has 330 docking stations and 4500 bikes, while London has 558 docking stations and 7600 bikes. These numbers don’t match exactly with official numbers, as I combine a small number of adjacent docking stations, and don’t count bikes in repair or otherwise unavailable for use.

London’s more temperature climate (a “warm/cool” city) means it should have a lead on NYC (a “hot/cold” city) in the summer and winter, while NYC may well be strongest in the spring and autumn.

Apologies for the rather lame looking graph. Excel crashed as I was setting it up, I sneaked a screenshot as the crash reporter popped up, but had to add the NYC data in manually in GraphicConverter…

Categories
Bike Share Conferences

Tracking, Visualising and Cycling

Along with Martin Zaltz Austwick, who blogs as Sociable Physics, I led a workshop session as part of CASA’s annual conference. The topic was “Tracking, Visualising and Cycling” and focused on analysing and mapping bikeshare data. I concentrated on mapping the near-real-time docking station data, while Martin graphed journey data. Both of us used Google Drive as a quick an easy platform to map spatial data and graph it. The techniques that the participants were led through are relatively rudimentary, but hopefully acheived our main purposes of demonstrating the availability of such data and the utility of Google Drive for quick analysis, without leaving anyone on the course behind.

After short presentations by Martin and myself, presenting our recent related output, there were two practical sessions. In the first session, I led participants through downloading the live dock locations/status JSON data files from bikeshare systems in the US, before hacking the JSON into a CSV suitable for upload to Google Drive and showing on a map as a Google Fusion Table. A calculated column was then added to show the empty/full ratio and the docking stations on the maps were coloured appropriately. The result looked a bit like this (if the New York dataset was picked):

trackingworkshop

A couple of gotchas we ran into: (1) If using Notepad, don’t save the JSON text, as that will “burn in” linebreaks that break it. (2) If you don’t see Google Fusion Tables in your Google Drive apps menu, you need to add it as an app using the button at the bottom of the popup.

Martin then followed by showing participants how to download journey data from the Washington DC “Capital Bikeshare” website, extracting just the data for Saturday 30 June 2012, extracting the number of minutes each journey took in Excel, binning the journeys by minute and then plotting it on a Google Speadsheet chart. An additional section was breaking down the plots by user type – showing a pronounced difference between Subscriber and Casual hires – the latter generally taking much longer for their journeys.

You can view the slides here.

Categories
Bike Share Data Graphics Mashups

Analysing “CitiBike” in New York City

The above interactive map compares the popularity of different CitiBike docking stations in New York City, based on the number of journeys that start/end at each dock. The top 100 busiest ones are shown in red, with the top 20 emphasised with pins. Similarly, the 100/20 least popular ones are shown in blue*.

CitiBike is a major bikesharing system that launched in New York City earlier in the summer and has been pulling in an impressive number of rides in its first few weeks – it regularly beats London’s equivalent, whose technology it shares, in terms of daily trip counts, even though London’s system is almost twice as big (compare NYC).

Different areas have different peak times

Here are three maps showing the differences in the popularity of each docking station at different times of the day: left covers the “rush hour” periods (7-10am and 4-7pm), the middle is interpeak (10am-4pm), the domain of tourists, and on the right is evening/night (7pm-7am) – bar-goers going home? The sequence of maps show how the activity of each docking station varies throughout the day, not how popular each docking station is in comparison to the others.

nyc_rushhour_small

Red pins = very popular, red = significantly more popular than average, green = significantly less popular than average. Binning values are different for each map. Google Maps is being used here. See the larger version.

Some clear patterns above – with the east Brooklyn docks being mainly used in the evenings and overnight, the rush hours highlighting major working areas of Manhattan – Wall Street and Midtown, and interpeak showing a popular “core” running down the middle of Manhattan.

The maps are an output from the stats created by a couple of requests for CitiBike data came through recently – from the New York Times and Business Insider – so it was a good opportunity to get around to something I had been meaning to do for a while – see if I can iterate through the docking station bike count data, spot fluctuations, and infer the number of journeys starting and ending at each docking station.

I was able to relatively quickly put together the Python script to do this fluctuation analysis and so present the results here. I can potentially repeat this analysis for any of the 100+ cities I’m currently visualising collecting data for. Some of these cities (not New York yet) provide journey-level data in batches, which is more accurate as it’s not subject to the issues above, but tends to only appear a few months later, and only around five cities have released such data so far.

Places with persistently empty or full docks differ

Here are two maps highlighting docks that are persistently empty (left) or full (right).

nyc_emptyfulldocks

Left map: green = empty <10% of the time, yellow = 10-15%, red = 15-20%, red pins = empty 20%+ of the time. Right map: green = full <2% of the time, yellow = 2-3%, red = 3-4%, red pins = empty 4%+ of the time. Google Maps is being used here. Live version of full map, live version of empty map.

The area near Central Park seems to often end up with empty docking stations, caused perhaps by tourists starting their journeys here, going around Central Park and then downtown. Conversely, Alphabet City, a residential (and not at all touristy) area fairly often has full docking stations – plenty of the bikes for the residents to use to get to work, although not ideal if you are the last one home on a bike.

How the stats were assembled and mapped

As mentioned above, I assembled the stats by looking at the data collected every two minutes, iterating it, and counting changes detected as docking or undocking “events”, while also counting the number of spaces or bikes remaining for the second set of maps.

There are a couple of big flaws to this technique – firstly, if a bike is returned and hired within a single two minute interval (i.e. between measurements) then neither event will be detected, as the total number of bikes in that docking station will have remained constant. This problem mainly affects the busiest docks, and those that see the most variation in incoming/outgoing flows, i.e. near parks and other popular tourist sites. The other issue is that redistribution activities (typically trucks taking bikes from A to B, ideal from full docks to empty docks) are not distinguishable. In large systems, like New York’s, this activity is however a very small proportion of the total activity – maybe less than 5%, and so generally discountable in a rough analysis like this. I detected 1.6 million “events” which equates to 0.8 million journeys which each have a start and end event. The official website is reporting 1.1 million journeys during the same period, suggesting that this technique is able to detect around 64% of journeys.

I’ve used Google Fusion Tables to show the results. Although its “Map” function is somewhat limited, it is dead easy to use – just upload a CSV of results, select the lat/lon columns, create a map, and then set the field to display and which value bins correspond to which pin types. Just a couple of minutes from CSV to interactive map. There are a few other similar efforts out there – which aim to take point-based data and stick it quickly on a map, but Google’s Fusion Tables does the job and is easy to remember.

The data is one month’s worth of journeys – 17 July to 16 August. One note about the popularity map – the data. I am really just scratching at the surface with what can be done with the data. One obvious next step is to break out weekend and weekday activity. There are a few other analysis projects around – this website is analysing the data as it comes in, to an impressive level of detail.

* Any docks added in the last month will probably show as being unpopular at the moment, as it’s an absolute count over the last month, regardless of whether the dock was there or not.
Categories
Bike Share Conferences

Bikeshare 100

vcpres_front

This is the presentation I gave at the Velo-City 2013 conference last week – I’m uploading it here as quite a few people have asked for it. The PDF contains my whole talk, except for some graphics from a couple of forthcoming papers which haven’t been published yet, and a conceptual image from a paper that we haven’t even started doing the research for yet!

The paper includes an introduction to EUNOIA, which is my main research project. Bikesharing data will form a small but useful part of this two-year EU transport mobility modelling project.

Here is the PDF of the presentation.

At time of presenting last week I was monitoring 85 cities live, since then I’ve added quite a few more (and dropped a couple) so I am now at 98 cities!

The new cities are:

Castellon and Leon were particular headaches, as they don’t have an official live map with location data – so I had to use a combination of third-party location data and manual georeferencing the newer locations! Oxford is also the first system where there are not a fixed number of docks. Implementing this on my map was a bit of a kludge. I’ve assumed that there are always more docks than bikes there, with a minimum 10 docks at each docking station.

Fixed cities are:

I’ve also switched the Mexico City feed to using the citybik.es service.

Dropped cities include Pavia (too small) and Stockholm East (too small). Nantong and Guadalajara have also been put on hold as their feeds have frozen for the last few days.

Cities I’m hoping to add very shortly are:

  • Portugal: Torres Vedras (launches 22 June)
  • France: Clermont-Ferrand (launches 27 June)
  • USA: Chicago (launches 28 June)

So Chicago’s DivvyBikes could well be the 100th system I’m tracking – and my presentation title will be valid!

You can see all the cities I’m tracking on the global view of my Bike Sharing Map – I also took the opportunity at the conference to launch this new, consolidated view.

Categories
Bike Share Conferences

Velo-City 2013 Review

I was at Velo-City 2013 (a major urban cycling trade conference) in Vienna last Thursday, to present my latest work on the Bike Share Map, EUNOIA’s link to bikesharing, and a CASA research paper update. It was great to be able to attend the conference for free, thanks to winning a ticket in the raffle at last year’s Velo-City in Vancouver.

My paper was presented as the last of four talks, specifically on bikesharing, in the mid-morning session. Despite the session venue being hidden away catacombs deep underneath Vienna City Hall, the room was full with an audience of around 100.

First up was Albert Asséraf of JCDecaux, talking about the history of JCDecaux-built bikesharing systems, staring with Vienna itself 10 years ago:

vc1

The talk focused on Paris which is as large as the other JCDecaux systems put together:

vc2

…although London is closer than the top statistic suggests – London’s, at 8100 bikes, is ~44% of Paris’s 18300 (and London is set to get another ~2000 in the next 6-9 months).

Next up was Hans Dechant, talking about Citybike Wien. The Viennese system is one of Europe’s cheapest – after a 1 EUR one-time verification charge, it’s completely free, as long as journeys are under an hour. It was important to structure charges for longer rentals on a progressively steeper scale, so that bikesharing doesn’t complete directly with daily and longer hires from the established bicycle rental firms:

vc3

The talk also highlighted the intensification (increased density of docking stations) that has taken place in the Viennese system over the last couple of years, moving it to be more in line with other large systems across the world:

vc4

There was also discussion of the automatic maintenance system, where bikes are locked in the system to be picked up for preemptive maintenance, after they have done a certain number of journeys or if they haven’t been used for a long time, even if the users haven’t flagged issues on the bikes.

The third talk, by several people, was on the soon-to-be-launched, but much delayed, Budapest “Bubi Bikes” bikesharing system, now likely to appear in summer 2014 – they are just moving to tender now. The system will be 85% funded by a European Union grant. Trip analysis has been performed to identify the areas of the city most likely to be used for bicycle trips and therefore define the system boundaries – mainly on the east side of the river.

Finally, I was on, and talked about the link between my main project (EUNOIA) and bikesharing:

vc5

I also launched a new global view of my Bike Share Map:

vc6

Finally I touched on some ongoing and potential CASA research into bikesharing, including one possible project we are considering studying the spatial analysis of individual users in London:

vc7

One metric that all three of the previous speakers in the session had mentioned was the average distance between docking stations – it is clearly one which is therefore valued by operators and city/transport authorities, so I included some results of a spatial analysis of bikesharing systems – including docking station density – in the talk.

(I’ll aim to upload most of the slides from my talk in the next few days.)

After the session there were two further main sessions on the day – the first being a round table and the second a “speed date” – in both cases, interested parties gathered around a table in the room and the speaker gave a 10-15 minute talk on their project, then people moved to another table and the talks were repeated. It was a good, lively format – the speed date in particular had 91 tables and 7 “slots” and so I was able to learn about projects as interesting as NextBike‘s technology, the ScratchBikes system (Newcastle) which, via their new Grand Scheme brand, is coming to Headington (Oxford) as OxonBike, a wearable cycle light that changes colour/intensity when turning or braking, and an ambitious project to build a cycleway on the east side of Manhattan – which includes blocking off part of the East River and building a power station underneath a new lake!

As well as the talks there were various opportunities to see trade stands – one thing that struck me was the number of companies now offering bike sharing systems. While my research focus has been on the large, “heavyweight” systems that offer many docks and so present many interesting opportunities for spatial analysis, it is clear that there is a large additional movement towards small-scale, cheap systems which can add this new form of public transport system to an urban area of any size.

One regret from the conference was that there was little presence from cycle companies or operators in the Far East. I would loved to have learnt more about the systems and technologies being used there, but Velo-City 2012 proved to have more coverage from Asia.

I had to leave for my plane as the final event of the day was getting underway – a mass cycle parade using bikeshare bikes and various other borrowed bicycles, around Vienna. Various streets were getting blocked off by the police for the event as I headed towards my bus. The benefit of having a conference organised by the city authorities!

Categories
Bike Share

The Top 20 World Bikeshare Cities*

With NYC’s big bikeshare launching on Monday, it’s time to update my list of the world’s biggest systems.

* I’m only including the systems where there is publically accessible live (or near-live) data on the number of bikes available for use. This means that most of the large Chinese systems don’t appear – accurate and up-to-date numbers for many of them are hard to obtain, as they either never had live online maps, or, in several cases, the live running information from them has been recently removed. If they were included, and the data from press releases, news articles and other research sources were accurate, then Chinese systems would make up 17 of the top 20, including the top 4.

The Biggest Bike Sharing Cities with Live Bike Numbers (May 2013)

City Country Data Bikes
May 2011
Bikes
May 2012
Bikes
May 2013
1 Paris** France API 17875 (Dec) 18135+ 18380
2 London Great Britain API 4886 6603+ 8128+
3 New York USA Data* 4683
4 Barcelona Spain API 4993 4482 4303
5 Montreal Canada Data 4309 3943 3954
6 Zhongshan China Data n/a 2491 (Jun) 3919+
7 Brussels Belgium API 1833 (Jun) 2494+ 3723+
8 Lyon France API 3063 (Oct10) 3318+ 3411+
9 Mexico City Mexico Map 1129 1149 3408+
10 Milan Italy Map 1315 1559+ 2681+
11 Changwon South Korea Map n/a 2010 (Jun) 2527+
12 Valencia Spain API 2278 (Dec) 2444+ 2495
13 Nantong China Map n/a n/a 2487 (Jun)
14 Seville Spain API 1941 (Oct10) n/a 2312+
15 Toulouse France API n/a n/a 2091
16 Lille/Tourcoing France API 711 (Sep) 1336+ 1967+
17 Washington DC/Arlington USA Data 918 1402+ 1902+
18 Brisbane Australia 3P 1018 1623+ 1883+
19 Nice France Data 784 (Nov) 1361+ 1400
20 Minneapolis/St Paul USA Data 605 977+ 1392+
21 Taipei City Taiwan Data 336 (Jul) 310 (Mar) 1374+
22 Kaohsiung Taiwan Map n/a 992 (Jul) 1312+

The numbers are coming generally from the monthly recorded max from my Bike Share Map.
* API anticipated appearing soon.
** Not including 400 bikes from a couple of separate systems on the outskirts.

Anecdotal evidence suggests that some “official” information releases overstate the numbers of bikes available – operators may consider bikes that are in docks but broken, in a workshop for repair, or in redistribution vans, to be available for use, whereas I’m counting the maximum recent number of bikes available in docks for people to use at a particular instant. So, for consistency, I’m sticking to the raw statistics that I can see, for the list here.

(I know there’s 22, not 20. I initially missed out Taipei City by mistake, then didn’t have the heart to move out Kaohsiung. Then I found a new datasource for Nantong.)

Categories
Bike Share

NYC’s Bikeshare is Almost Here

nycbikes

Not long now – less than a month – until the 1 May launch of New York City’s long-awaited and delayed (the hurricane last year didn’t help) bikeshare system, Citi Bike. Stations are starting to be rolled out.

A pilot test is currently being run with some docking stations and bikes, in the Navy Yard area of Brooklyn. I’ve discovered the live data feed for these stations, and combined it with the “planned stations” data feed, to produce a map of the system as it stands, which I’ve added to my Bike Share Map. The live docking stations are in blue/red colours, depending on how full of bikes they currently are, while the planned stations are in grey – dark grey for Phase 1 (launching in May), and light grey for Phase 2 (later this year). The rollout is happened in two phases due to damage inflicted on some of the warehoused bikes caused by the flooding from Hurricane Sandy late last year. Disasters like that kind of put the occasional complaints about the London’s own system into perspective!

London and New York share a common base design for both the bikes and docking stations, so in theory if you were to fly a Boris Bike to NY, it would fit in a dock’s slot – although I presume the system would then reject it for having an alien ID! Both cities’ docking stations and bikes have had design modifications from the Montreal BIXI original, with London’s docking stations being concreted in to the ground while NY’s docking stations have a solar “tower” for power, and a credit-card shaped slot as well as the normal key slot, for future integration with transport smartcards.

One of the most promising parts of the Citi Bike website is the System Data tab – right there on the front page. This looks like NYC will potentially be joining London, Minneapolis, Washington DC and Boston (and possibly Paris soon) in making anonymous journey data available to anyone who wants to analyse it.

Incidentally I’m delighted to see that the NYC system has an official blog and it looks like it’s not alone, with the largest non-Chinese system in the world, Paris, also having an official blog. Come on London, get blogging!