Categories
Olympic Park OpenStreetMap

Mapping the Queen Elizabeth Olympic Park

[Updated – Event webpage here]

The southern section of the Queen Elizabeth Olympic Park opens on 5 April. Much of the northern section is already open.

I’m considering organising an OpenStreetMap mapping party (likely using Walking Papers as a basemap for people) to map the park in its new, legacy mode. Currently, much of the area is shown on OpenStreetMap as it was during London 2012, or as out-of-bounds.

The date is the evening of Wednesday 9 April from 6pm until dark (7:30pm?) followed by beers in The Crate pub. People can then add their discovered detail into the map in their own time or (if they are really keen and bring a laptop/dongle) at the pub.

Post-event pub will be The Crate pub in Hackney Wick, which is right beside an exit to the park, and is a nice pub and brewery that does great pizzas and serves some great beers brewed on site and also Dalston Cola, made just down the street by my bro. It’s a more relaxing experience than the pubs at Westfield.

Stratford is easiest to get to by tube so meeting at Westfield (ground level – that’s UP from the station exit level) at the Westfield end of the big iron bridge that goes over the station, would be the best location. I am planning on setting out from there shortly after 6pm, and then meeting people at The Crate pub (which is at the other side of the park) at 7:30-8pm. The Crate pub is near Hackney Wick station for those who don’t want to walk back across the park afterwards.

The idea is that everyone picks a slice of this cake – if we get more than 10 people, then we can double-up in the complex central sections, and if we get fewer, then we can concentrate mainly on the central area.
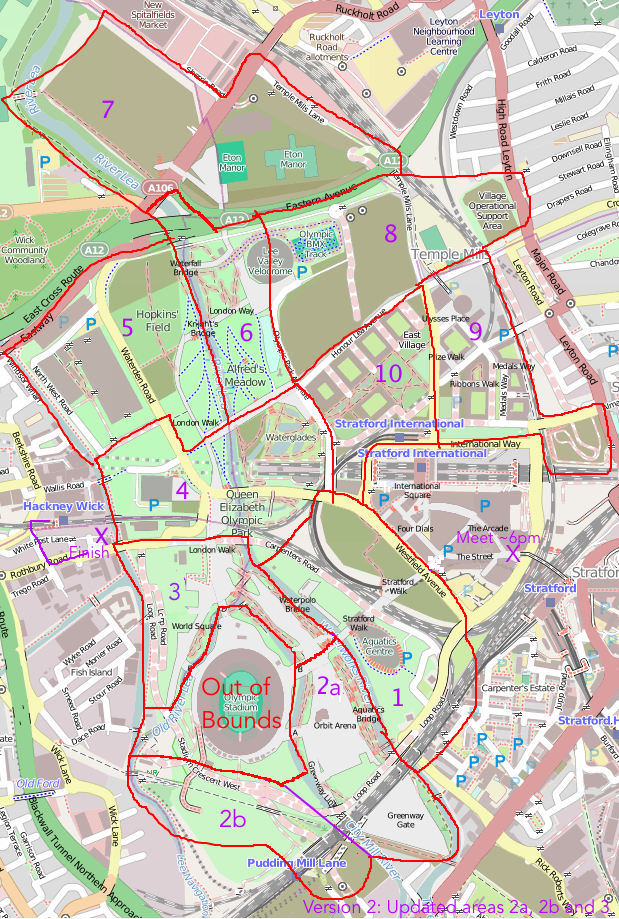
map_qeop

Some notes on the slices:

  • 1. Eastern part will still be a building site but plenty of detail to be both added and removed elsewhere.
  • 2. The southern half of the new South that will be newly opened, includes the Orbit and associated buildings. If time then it’s worth progressing to section 2b – unclear how much of this is open but there are a couple of new links here. The Greenway Gate area may still be inaccessible.
  • 3. Northern half of the new South Park, including the Great British Garden on the other side of the stadium. Lots of natural detail to be added.
  • 4. Not sure if the Waterglades will be open – but if not, some other new detail to add here.
  • 5. May still be under construction in places but definitely some changes from what’s on the map – even simply things like bus stops.
  • 6. The north park is already open but could do with a lot more detail, e.g. the Olympic Rings sculpture, vegetation, and link path to the north.
  • 7. Quite far away and mostly will still be a construction site. Good for someone on a bike.
  • 8. May not be too much to see here as under construction and/or fenced off for the cycling.
  • 9. This part of East Village is partially open and lots of residential detail can be added in.
  • 10. This part of the East Village is mainly closed but some bits, e.g. the park bit, are open.

I will aim to print Walking Papers maps for each of the slices and bring them to the pub.

I’ve added this to the London wiki and Lanyrd. If it’s raining cats-and-dogs on the day we can just go to the pub.

We held a similar mapping party back in late 2011, to map Westfield Stratford City. We based the party at the Cow pub on the edge of the shopping centre. Here’s a neat video that Derick created, showing the map evolving as people added to it, following the party.

Things to add to the map

  • Bus stops (& number of bus service)
  • Car parks (no. of spaces, disabled-bay information)
  • Roads and paths – particularly at park edges/entrances: official or unofficial, walking or cycling, steps
  • Vegetation – woodland, grass, garden, marsh, water
  • Individual trees, if distinctive or ‘street’ trees, ie planted in hard standing or grass
  • Facilities – toilets, concession stands, playgrounds
  • Fences, walls and gates
  • Electricity substations
  • Artworks, sculptures (with name)
  • Traffic lights, zebra crossings
  • Names of areas, places, things – many of these are new – look at what signs say
  • However do not copy names or details from official maps – these may be copyright and not open data
Categories
Leisure Olympic Park OpenStreetMap

Olympic Park Rising

7629386754_86db110501

The Olympic Park in east London was a flurry of colour and activity during a few weeks in summer 2012, but since then it has been largely locked away – a parcel of land opened last year, but with a security fence, access only from certain points and at certain hours, it hasn’t really felt like a proper park. A few cycleways have also appeared, but considering the “blank slate” of the area, they are laughably awful. Tradtionally the excuse for London’s poor standard of cycle tracks is that the roads are too narrow to fit them in, or there’s too much traffic to close a lane for cyclists. Both of these are rubbish reasons for many of our streets of course, but the lack of positive and effective action (apart from in a few isolated places) has allowed places like New York to leap-frog London as cycle friendly cities – during Autumn, more people used the bike-sharing system in New York than in London. I really hope it’s not too late to fix these mistakes.

The good news is that a lot more of the park is due to open very soon. The Aquatic Centre and the Velodrome are due to open in March, along with the outside BMX, mountain bike and road tracks. I’m rather disappointed that we’ll have to pay to use the latter, I had originally envisaged all the bridges being open to the public at all times, but with two of the bridges are forming the circuit, this will represent quite a large part of the park that is fenced off. I appreciate the venue buildings need to be self-sustaining in funding but it’s a shame that the outdoor as well as the indoor circuits are pay-to-play.

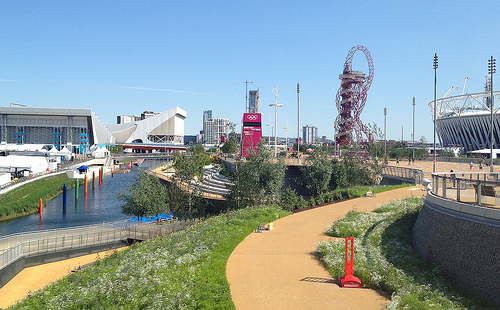
Then in April the south of the park reopens, and the Orbit. The orbit will, I’m sure, be about as popular as the cable car, at least until the view improves, but with the southern part of the park opening up, finally there will be a large, green(-ish) space which just might start to feel like a proper London park.

olympicpark_jan2014

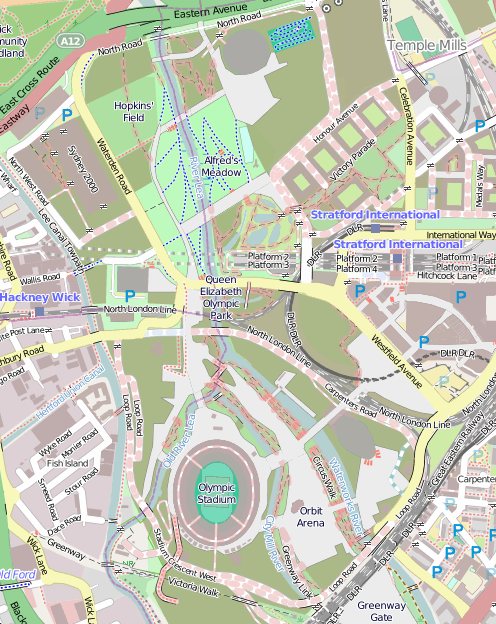
One thing that is going to need updating is the map. The official one is really not that great (What do the dashes mean? What do the dots mean? Why are the open areas outside the park shown in the same grey as closed areas inside the park?) so we’ll have to turn to the crowdsourced map of choice, OpenStreetMap. This map (above) isn’t looking great at all either at the moment – some features that were around only in 2012, such as the athlete’s access tunnel across the Greenway, are still on there. Red dashes show out of bounds paths – how many of these will come in bounds in March/April? So we’ll need a Mapping Party some time there in April/May, and after that, the map should look pretty good.

The park was great for a few weeks in 2012, but the slow pace of opening, and the efforts so far, have been disappointing. But despite my grumbles above I’m greatly looking forward to the park opening, them sorting out the cycle lanes and access, and it maybe becoming, one day, a great space for cycling through, jogging in, or maybe even a bit of park orienteering?

Map © OpenStreetMap & contributors.

Categories
London Mashups OpenStreetMap

Ironways of London

london_ironways

It’s always irked me slightly that many online maps of London show the various tube services as straight lines between stations, or as idealised Bezier curves. Perhaps the regimented lines and angles of the official “Beck-style” tube diagram has meant that, when translating into a “real life” geographical map, people have tended to keep the simplifications. After all, if you are travelling around London on the tube or railways, only the location of the stations are important – not how you travel between them.

Focusing on the section of the DLR just south of Canary Wharf:

Google Public Transit view, using Bezier curves between stations:
iw_google

A typical “straight lines between stations” map – from CASA’s own MapTube:
iw_maptube

One of DLR’s own official diagrammatic maps:
iw_official

Where the line actually goes:
iw_actual

OpenStreetMap contributors have faithfully mapped most of London’s railways, including best-guess alignments for tube tunnels, using ventilation shafts on the service and “feeling” corners and curves that tube trains take – bearing in mind that GPS does generally not work underground. There are a couple of minor mistakes, such as orientations of the Northern Line curves near Mornington Crescent, and a part of the Piccadilly Line in north London.

I’ve taken this now excellent dataset, and as part of work to produce a comprehensive vector file of Transport for London (TfL) service routes, I’ve produced this interim map – the Ironways of London. TfL’s public service routes are highlighted in green. Lines in red are other train operator routes, sidings and depots, freight rail routes, disused lines, unusual chords and the odd ornamental railway. Many of these are obscured by the green lines of TfL routes, where the two coincide. There are a few missing sections, e.g. a couple of tunnels to the south of London are not shown.

The map here uses Google aerial imagery as a background, Ordnance Survey Open Data to show the boundary of Greater London, and OpenStreetMap to show the rail routes themselves. As such, it’s a nice mashup of the three major sources of free-at-point-of-use spatial datasets for London.

Here is the full size version.

There are a few other examples around on the net of the same thing – here’s an ESRI one. The Carto Metro one is excellent and is a level of detail beyond what I am aiming for.

In the new year I hope to complete and release the tidied vector data. [Update: Data released, more info.]

Categories
OpenStreetMap Orienteering

OpenOrienteeringMap v2.Beta

oom2_gui

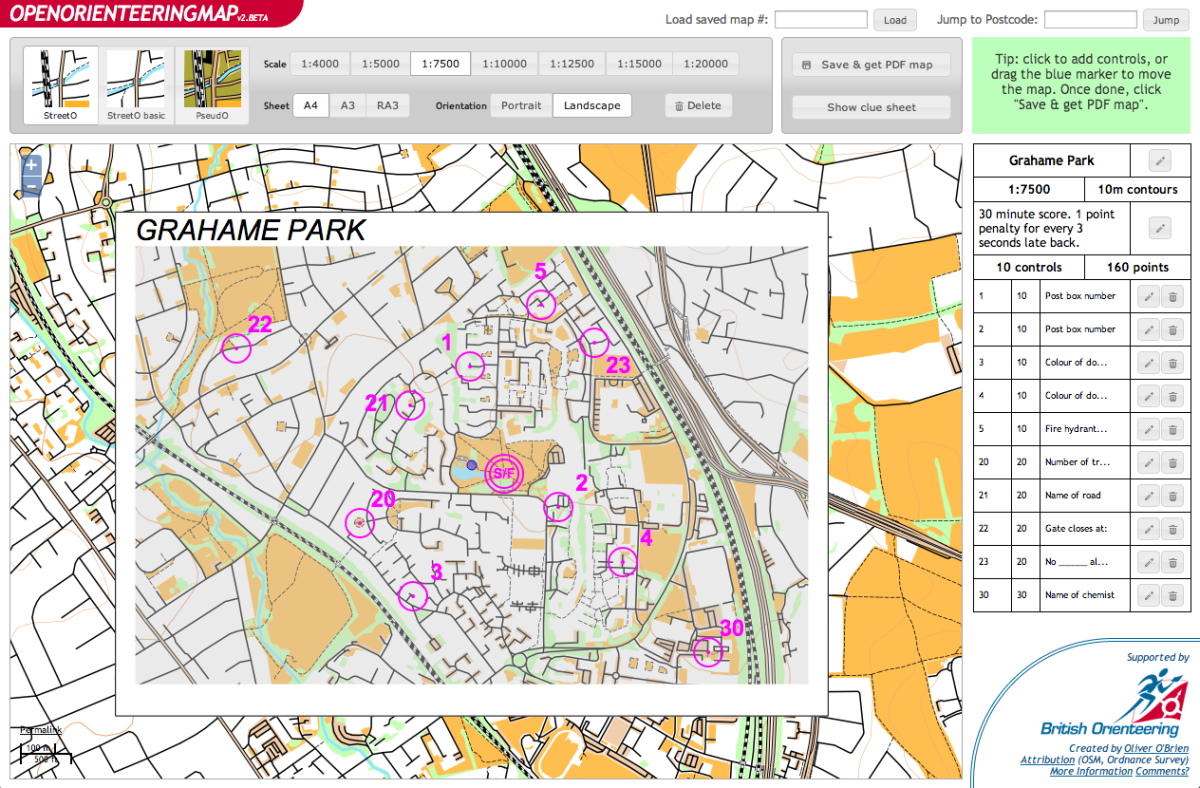
About a year ago, I mentioned that I would be spending a bit of time rewriting OpenOrienteeringMap (OOM). The web application, which people use to create printable simple “street orienteering” (or Street-O) maps for use in low-key events such as the SLOW Street-O series events, has been around for a bit, and was not the most intuitive or prettiest application to use.

More seriously, the map creation process had little in the way of safety checking, meaning that mistakes could be made – one recent Street-O event I went to had two control points with the same number, and another one had misaligned the control “clue sheet”, so that the clues corresponded to the wrong control – resulting in much confusion out on the course. There was also a popular complaint from course planners – namely that they couldn’t go back and change their map – if they made one slight misplacement or misnumbering, they would have to start all over again from the beginning. A less frequent but still valid complaint was that it was easy for control numbers to overlap (or be near) other control circles, causing confusion. There was a non-trivial workaround for this last point. The new version, which I’m releasing today as a beta (while it awaits final signoff) addresses all these issues and has a few more features.

If you want to jump right in, then have a play now at http://oomap.co.uk/ – or read on for more details of what’s new.

oom2_newcontrol

A list of the main new and updated things:

  • Much more intuitive to use.
  • Set a direction for the control number.
  • Set a point score and control description, for use with the new clue sheet.
  • Edit and delete controls after they are created.
  • You can now move the map incrementally (drag the blue move marker.)
  • Validator to make sure duplicate numbers are not entered!
  • You now get given a code when saving a map. Copy this code somewhere, and use it to reload your map in the future.
  • New clue sheet which can be edited and printed – useful in conjunction with the map, for an event.
  • New design for the PDF maps – with British Orienteering branding.
  • The standard Street-O map now shows parks (yellow) and forests (light green). If you don’t like them, use Street-O basic, which leaves them out, as well as railways.
  • Daily updates to the background map.
oom2_save

A note on schedules for updates to the background map, which is created from a local database based on the data in the OpenStreetMap database:

  • The local database is now updated from OpenStreetMap every day between 6am and 8am. During this time, OpenOrienteeringMap is not available for use – the maps on the website will appear partially or completely blank and PDF generation will not work.
  • The map data is based on what is in OpenStreetMap up to and including 7pm the previous day.
  • This means that edits to the background map in OpenStreetMap should take between 13 and 37 hours to appear in OpenOrienteeringMap.
  • The image “tiles” of the map that you see on the OOM website are created on-the-fly from the local database and cached for quicker future viewing – the cache is emptied daily at the same time as the map data is updated.
  • The PDF map is always created on-the-fly from the data, and not cached.
  • The process is subject to occasional delays and may stop altogether for a while if upstream processes/timescales change.
  • I’m using Geofabrik’s download service – thanks guys!
oom2_cluesheet

Unfortunately this new version (and the old one) will only be available for the UK (& Ireland) at the moment. Partly this is because the new site is very UK-centric – it searches for UK postcodes, takes advantage of freely available contour line vectors for Great Britain, and is branded as a British Orienteering product. But the main reason is that the OpenStreetMap dataset for the whole world is huge, it’s unwieldy and almost unmanageable – not to mention requiring many hundreds of gigabytes of expensive server disk space, and a lot of RAM. The UK/Ireland cut, on the other hand, is much more straightforward to handle.

oom2_pdf

You can download this example PDF, which is of Grahame Park in north-west London, here.

Get started making your own Street-O map, at http://oomap.co.uk/. Your comments are, as ever, welcomed below.

[Update – fixed the following bugs: Western Ireland not being rendered, clue sheet labels in the wrong order, not being able to edit a control until at least one is added (problem when loading in a previously saved map), permalinks not using WGS84 lat/lon.]

Categories
OpenStreetMap

Extracting Feature Geometries from OpenStreetMap

minnea_summary

I’ve recently been extracting some river geometries for major cities around the world. The data needs to be a list of latitude/longitude coordinates, representing the nodes on the shape for the river concerned.

I’m sure there’s easier ways to do this, but here’s my technique, shown here for Minneapolis. Click the images for larger version.

1. Extract the data from OpenStreetMap. Use the Export function, and draw out the area concerned with a bounding box. Choose OpenStreetMap XML as the format. I originally tried SVG, but this presents you with screen coordinates instead of latitude/longitude pairs.

2. Open the resulting file in Quantum GIS (QGIS). I used QGIS 1.9. You need the OpenStreetMap plugin installed, this will allow the OSM file that was created in Step 1 to be read straight in (in fact you could download the file directly from the OSM servers, if you wanted to).

3. Select the feature you are interested in. My river (actually a waterbank polygon) is a “hairy feature” as it extends well beyond the extent of the data that was downloaded. Make sure you are selecting it (feature turns yellow) rather than highlighting it for feature information (feature turns red). Otherwise, the subsequent file is, rather unhelpfully, blank.

4. Do Layer > Save Selection as Vector File. Choose “KML” as the format. You probably don’t need to change the coordinate reference system (CRS) as the data will already be in WGS 84, and this (“normal GPS-style latitude/longitude) is the CRS you want.

5. Edit the resulting file, removing the XML tags, and header/footer, and replace spaces with return characters, to leave a long list of latitude/longitudes, ready for importing into your visualisation code.

Categories
OpenStreetMap Orienteering

OpenOrienteeringMap – Thoughts on a Version 2

I’m hoping to do some significant work on OpenOrienteeringMap (more information) in the near future.

Below is a summary of the major features that I am hoping to include, and you are invited to leave your feature requests as comments here too. (I may eventually get around to formalising this in a code repository.)

High Priority

  • [1] Editing of control locations, numbers and number positions for existing maps, via the web interface.
  • [1] Saving of existing maps, via a short URL.
  • Applying out of bounds points (e.g. gates), lines (e.g. major roads) and areas (e.g. closed parks) to the maps.
  • [1] Addition of a new style – Street-O Enhanced, which builds on the Street-O style but adds parks, open areas and other useful features.
  • Addition of a new style – Urban Adventure, which includes street names for the larger roads.
  • [1] Automatic creation of the clue-sheet.
  • [1] Assignment of points values to the controls. This will help with the clue-sheet creation and potential future route-analysis applications.
  • Optional colouring of control circles based on points values.
  • Better match of the look of the web preview and the final PDF.
  • A basic how-to guide.
  • Inclusion of a OpenStreetMap editing 101 guide.
  • Output of a high-resolution raster (e.g. JPG) of completed maps and “blank” maps, for embellishment in Purple Pen etc.
  • [2] Automatic daily refresh of the data from OpenStreetMap.

Medium Priority

  • [2] Increase contour widths and/or darken colours.
  • More configuration options, e.g. railways on/off, contours on/off.
  • Import/export of courses, probably via text config file.
  • Allow separate start and end points.
  • Creation and setup of an alternative tile rendering source.
  • [2] Use source code management for the website and the stylesheets.
  • [2] Better usage tracking and statistics.

Low Priority

  • Use OS Open Data Vector Map District as alternative data source – misses out paths/parks, but complete coverage for roads.
  • [1] Apply OpenOrienteeringMap logo and branding.
  • Create point-to-point courses, with straight lines between each line.
  • Use SVGs rather than raster graphics for points and complex lines.
Categories
Mashups OpenStreetMap

Run Every Street in Edinburgh – in Strict Alphabetical Order

…it sounds like one heck of a lot of running. But Murray Strain, one of Scotland’s top terrain runners, is counting on it for his basic training. He’s logging the whole venture, which is based on his trusty Edinburgh A-Z. If two adjacent streets with very similar names are nonetheless separated in the A-Z index by one on the far side of the city, it means a couple of legs right across the city.

Since he started the exercise last year Murray’s got through all the As, and is currently midway through the Bs. I’ve produce a couple of GEMMA maps, one showing the A-Bs (above, As are red and Bs are orange) and one showing the A-Gs (below, in rainbow order). That’s a lot of streets. N.B. The maps in fact show all linear features in the area in OpenStreetMap, so the odd named cycleway and waterway has crept in there too. But the ~95% of the coloured lines will be the streets that Murray will be run.

In order to produce the map, I’ve added a new feature to GEMMA – it now allows you specify only one desired geometry type, i.e. points, lines OR polygons, when adding an OpenStreetMap layer to your map. Previously, you got all three types, although you could reduce each to a dot if desired. This example also highlights the need for legends on the PDF maps that GEMMA produces – a larger coding change, so one that would make it into a future version 2 of GEMMA.

Categories
Data Graphics Geodemographics OpenStreetMap

Main Street UK

GEMMA is the project I’ve been working on for the last six months, it’s one of the JISCgeo projects and it is now released – although consider it to be beta as there are lots of bugs and UI quirks that we are aware of. More about GEMMA can be found on the project’s blog.

One use of the OpenStreetMap feature highlighter in GEMMA, that was suggested by one of the participants at the JISCgeo Meeting earlier this week where we launched the web application, and augmented by a friend who was trying it out, was mapping the occurrences of the “High Street” road name – and a few regional variations, namely Main Street, Front Street, Market Street, Fore Street and The Street. Using GEMMA, and the high level of completion of OpenStreetMap in the UK and Ireland, allows us to visually show the spatial patterns of such street names.

Here’s a stitched-together screenshot of the GEMMA webpage showing the pattern throughout the UK and part of Ireland:

It turns out that Main Street is popular in the Midlands and in Scotland and Ireland, and Front Street is popular in the North-East of England (around Newcastle) while High Street is used nearly everywhere in the UK – but only sparingly in Ireland. Market Street is popular in the Manchester and Devon areas. Fore Street is popular in Cornwall and The Street very popular in Essex and Kent.

Note that many parts of Northern Ireland and the Republic of Ireland, are not yet well mapped in OpenStreetMap, so the street names will be missing in some parts here. The base-map is copyright Google and the street data is CC-By-SA OpenStreetMap.

You can see the live version of the map here.

Categories
OpenStreetMap Orienteering Training

OpenOrienteeringMap is on Attackpoint

Just a quick post for people who use Attackpoint – >a OpenOrienteeringMap (OOM) is on it! More specifically, you can view GPS routes that people have uploaded, using OpenOrienteeringMap as a background.

To do this:
1. Click on the little “globe” icon beside an entry that has a GPS log. Here’s an example from my Venice Street Race run on Sunday.
2. On the map that loads, click on the “OSM” button on the top right.
3. Click on one of the OOM items on the menu that appears just below the OSM button.

(Note, the global version of OOM is used – this one does not update as the OpenStreetMap database updates, but instead on a more occasional schedule.)

The basemap is based on OpenStreetMap data.

Categories
Olympic Park OpenStreetMap Orienteering Events Log

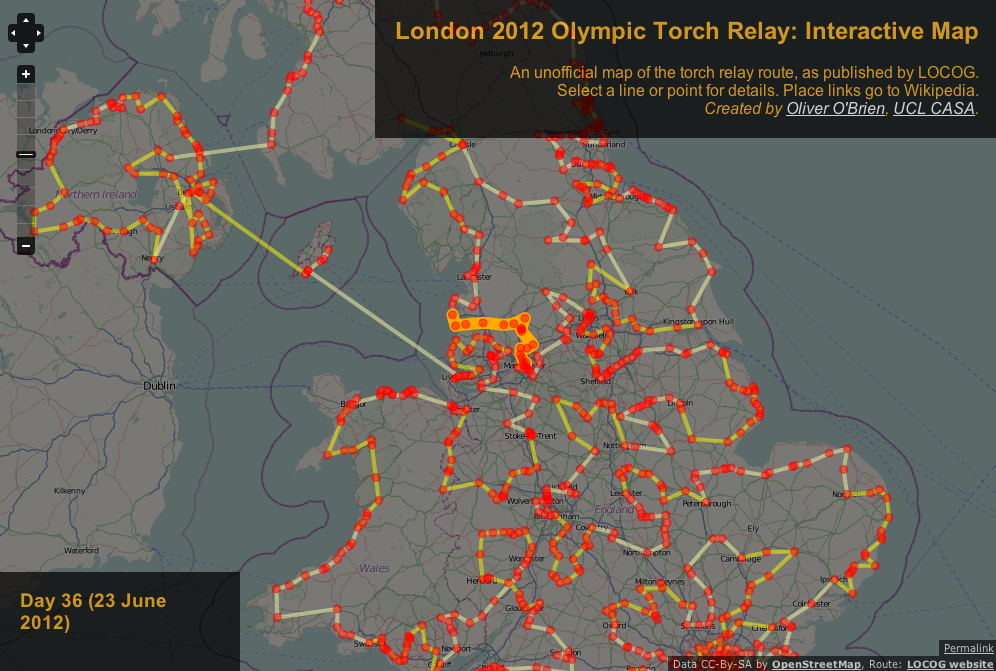
Olympic Torch Relay – The Unofficial Map

Cross-posted from my research blog.

The organisers of next year’s Olympic Games in London, LOCOG, have unveiled their map of the 1000+ places that the Olympic Torch Relay will pass through. The data that the map is built from is readily accessible (as a JSON file that gets downloaded to your computer when you view the map) so I’ve taken the data and built my own (unofficial) map. It has a number of advantages over the official map:

  • The base map is OpenStreetMap, which is much more detailed.
  • The map takes up the whole browser page, allowing for easier panning around.
  • The line that connects each of the places is drawn as a vector, so it still appears as you to zoom right in to see individual villages. (The official map surprisingly uses tiles for the line.)
  • There are Wikipedia links for each of the places. Almost all of these resolve to proper Wikipedia entries, so you can easily find out about the places that have been picked, with the richness of detail that is characteristic of the Wikipedia project.

See it here.