Categories
OpenStreetMap Orienteering

Bow Street Race

I organised a street orienteering event last night in Bow, East London. It was the first race of this season’s SLOW Street-O series. Nearly 40 people came along and survived the mean streets of Bow in soaring temperatures – it was nearly the hottest day of the year.

When producing the map for the race, I wanted to do something different – I wanted to finally utilise my GIS/OSM based method that I developed in my MSc dissertation last year. So, the map was based *entirely* on OpenStreetMap data, and produced in a GIS rather than a cartography or graphics package. Nothing was added to the map that isn’t in the OpenStreetMap database, so future street orienteering maps of the area that use the same technique will be at least as good, or better, as the wider OSM community continues to improve the mapping of the areas.

bowmap

The GIS used was Quantum GIS. I used a pre-release version, 1.2.0, although the current “unstable” 1.1.0 release should work the same for these purposes. A patch was applied, to cap the ends of thick line strokes to the true extent of the line, rather than them extending slightly out which is the default.

During the creation of the map (which was in Quantum GIS’s buggy but full-featured Print Composer function) I created a number of style templates, representing standard street orienteering map symbology. I hope to have these available for download soon.

The process in creating the map was:

  • Friday – investigating how complete and accurate the OpenStreetMap data of the area is, by comparing with satellite imagery and other sources.
  • Saturday and Sunday afternoons – two long and windy cycles through various housing estates and down alleyways and streets, to record GPS tracks of missing streets.
  • Saturday and Sunday evenings – adding in the detail to the OSM database, based on the GPS data and my notes. Also building Quantum GIS.
  • Monday afternoon – identifying possible locations for controls.
  • Monday early evening – a cycle around half the control points to confirm the questions and answers.
  • Monday late evening – creating, styling and adorning the draft map in Quantum GIS.
  • Tuesday morning – cycling around the remaining control points.
  • Tuesday lunchtime – assembling the final map, checking for any generalisation needed, fine-tuning the control location “dots” and printing.
  • Tuesday evening – the race!

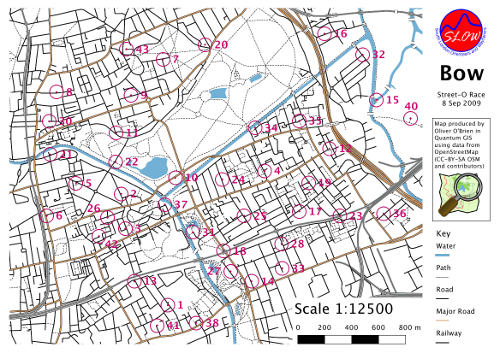
You can download the vector-based PDF of the map here (1MB), and the questions here if you fancy doing the race in your own time (or virtually on Google Street View – many of the answers are visible on it.)

Comments from runners were generally positive – one spotted a road that wasn’t accessible, and the 1:12500 scale made the map quite cluttered. One key underpass under a railway was missed by someone. The simple cartography in Quantum GIS means, for example, black dashed lines can’t be forced to have a black segment at each end. There were more issues with interpretations of the questions than with the map itself.

No one got all of the controls in the hour, and they weren’t supposed to – with 41 controls spread right across the map, this would have been impossible to do. The top score was 550 points, out of a maximum of 800.

Categories
OpenStreetMap Orienteering

How to cycle for 25 miles without leaving the neighborhood

Here’s the GPS trace for a bike ride I did on Saturday:

capture

It’s 25 miles long, but never I’m never more than a mile from the Bow Wharf complex.

Why? I’m organising a street orienteering race (“Street-O”) for Tuesday evening, and the map will be based entirely on OpenStreetMap data – probably the first time OSM data has been used for an orienteering map for a real race.

The cycle was to find as many missing roads, paths and alleyways as possible to try and make the map complete. Bow has a large number of social housing estates and some of these are a real rabbit warren of alleys.

The ways were then drawn in to the map, using Potlatch, and then the data was downloaded, converted using the script I developed for my MSc dissertation last year, and added into a custom build of Quantum GIS. The map was then “composed”, with adornments (scale bar, legend) added, and a PDF created. Because it’s a GIS, the map already knows its scale and the colours used in its symbology, so adding the scale bar and legend is just a case of selecting the area of the map you want the adornment to go on. Quantum GIS’s cartography isn’t perfect though – line capping is problematic, but it will do for tomorrow’s purposes.

The result will be seen, and hopefully used, by everyone who turns up for the event at the Royal Inn on the Park tomorrow evening. Come along if you can! The weather is looking good.

It’s good to finally put into practice the technique I outlined in the dissertation. I will post a couple of excerpts soon to this blog – namely the bits of the dissertation I referred to when creating the final map last night.

Categories
Conferences

RGS Annual Conference

As mentioned in my previous post, I was up at the RGS Annual Conference for a day last week. As well as my own session, I stayed to listen to a number of sessions, including the cartography one – titled “Why do Geographers Make Maps?”. This one, a double-session, was popular – the room was packed out, and I enjoyed the talks. But my highlight of the day was an evening trip to the John Rylands Library in central Manchester, for an evening viewing of the Mapping Manchester expedition – which got a lot of publicity on that day, in the national press, because of the “Soviet Invasion of Manchester” maps that form part of the collection.

I was delighted too, to see an old (1980) orienteering map in the collection, and a map showing the locations of all (1000s?) of the pubs in Manchester, was quite eye opening! The building that the collection was in was itself pretty awe-inspiring two – it’s neo-gothic style, and reminds me strongly of the (much older) Duke Humphrey’s Library which is deep in the Bodleian Library complex in Oxford. Basically, it’s straight out of “Harry Potter”.

Categories
Orienteering

Here come the Vets

Entries for the second City of London orienteering race, next Saturday, are rocketing. We have over 10% more pre-entries last year, and the regular-rate entries have now closed (late entries are open until next Wednesday.)

What’s interesting about the entry this year is the demographics have shifted somewhat.

Here’s a couple of graphs showing the breakdown by class for the two years – MO = Men’s Open, MV = Men’s Vets (40-55) WSV = Women’s Super Vets (55+), and so on.

2008

2009

The open classes are roughly the same as last year – it’s Men’s and Women’s Vets (MV/WV) and the Men’s Super Vets (MSV) that have shot up in terms of entry numbers – and there’s a lot more “new to orienteering” entrants – rougly corresponding to the green parts of the bars – in these categories.

In terms of international entries, we have roughly the same proportion as last year – about 7%. The proportion of beginners (effectively those that haven’t bought their own SI cards) has dropped slightly from 23% to 18%.

The map and courses are being tweaked and polished, before going off to the printers early next week. The courses I’ve seen so far (I’m not the planner this year) look superb. All set for hopefully another thrilling race!

Categories
Uncategorized

Orienteering Fixtures Map Updates

I’ve discovered a bug in the UK orienteering fixtures map which was preventing event name and location updates from appearing correctly – this has now been fixed. In addition, I’m now showing fixtures up to two years away on the list (previously it was a year) as some fixtures, including the urban races, are starting to appear in the list a long way off. Finally, the course indicators are back – at least, until BOF change things again…

Categories
Conferences Mashups OpenLayers OpenStreetMap

Education Profiling with an Open Source Geostack

I was in Manchester yesterday for the first day of the Royal Geographical Society annual conference. I gave a talk at the session called “New Urban Geography: Evolving Area Classification for Socio-Spatial Generalisation” which was convened by my boss Dr Alex Singleton and chaired by Prof Paul Longley, both also of the Department of Geography here at UCL.

My talk discussed a Web 2.0-style mashup of English school attainment and geodemographic data, which has been put together as an online “atlas” using OpenStreetMap data as a contextual layer, Mapnik to produce the graphics and OpenLayers to display them. The atlas is not yet complete, and the data is a little old, so it’s not being widely promoted yet, but if you are really keen on visiting it yourself you can find the URL by looking carefully in the presentation…

It is here.

[slideshare id=1914330&doc=openlayersandmapnik-090827073034-phpapp01]

Categories
OpenStreetMap

OSM gets Isle of Man Government Data

Dan Karran writes that he has received an official, recent (2007) dataset from the Isle of Man government, comprising of a 1:25000 raster with tourist points of interest (POIs), and detailed satellite imagery from 2001, with a licence suitable for tracing into OpenStreetMap. This is great for OpenStreetMap and for the Isle of Man. Although the data doesn’t include individual house shapes, and other fine detail that wouldn’t be on a 1:25000 map, it does allow for complete coverage of the island with a level of detail suitable for routing, POI-finding and landuse mapping.

Now, if the Ordnance Survey could be persuaded to do the same thing for a test area in Great Britain, such as Caithness?

Categories
Uncategorized

One Angel Lane (aka Watermark Place)

Just noticed that the protective fencing has just come down on the newest City building, on the Thames waterfront beside Cannon Street Station. The building is called Watermark Place, although a prominent wooden beam at the building’s main entrance has the inscription “One Angel Place” on it. Although the building is mainly glass and steel, it has some nice wooden and metal slatting on the riverside, to protect it from the sun. The massive wood beams are rather attractive. Some small wooden planks, possibly some offcuts of the wooden beams, have been turned into some benches. The combination of the rich wood colour, the trees and some well placed spotlights, make the front of the building look very attractive from the neighbouring London Bridge.

OpenStreetMap has been duly updated with the now-open Angel Lane walkway.
IMG_1011

Categories
Uncategorized

New Bridge across the Regent’s Canal

[Updated] I somehow missed this last week (although it received very little publicity) – a new bridge across the Regent’s Canal has just been lifted into place. It’s a foot/cycle bridge, linking the middle of Mile End Park, by the climbing wall and the Palm Tree pub, to the new access road for the Suttons Wharf housing development in Meath Gardens. Once the landscaping works are finished and the bridge opens at the end of next month, this means there’s now an attractive and direct non-road route between Bethnal Green and Bow.

[Update – I’m not so sure now that it links to the access road (i.e. Meath Crescent) to the west, as this road is accessed by electronic gates. The path may swing northwards to go into Meath Gardens themselves, which makes it a less useful route. The ramp on the east side also swings north, again making it less useful for going east-west – oh well!]

Tower Hamlets Council have a webcam looking over the bridge, facing west to Suttons Wharf and the London-Stratford railway line. It seems to update about every minute until around 4pm. I’ve shamelessly pinched one of the photos from it below.

camputer45c

The new bridge is particularly exciting for me for a couple of reasons – firstly I’m hosting a street orienteering event in Bow in early September, and this bridge is slap-bang in the middle of the map. Unfortunately it doesn’t look like it will be ready for the event, which is a shame as the bridge will enhance route choice in the area. Secondly, it will also allow an extension of my Queen Mary University of London (QMUL) and Mile End Park orienteering map – a test event was run on this map in 2008, and we are likely to have another race on this map next summer or in 2011. In an ideal world, the link path from the new bridge, under the railway bridge to the north end of the university campus would also be opened up – however I suspect this will remain closed for security reasons.

I’ve marked on my QMUL orienteering map the rough location of the bridge, in purple, and the access road to it.

qmulnewbridge

The bridge is one of the 79 Sustrans Connect2 projects that were set in motion by the charity winning £50 million in the Big Lottery TV competition in 2007.

Categories
Orienteering

Ortelius

A new cartography application for Mac OS X, Ortelius, by Mapdiva, has just appeared. I’ve not heard of it before, but from the screenshots on the site, it looks nice. I like especially how it handles the cartography of junctions properly where one road is a sequence of dashes, by moving the dash-sequence appropriately, but I would be interested to know if it can handle this at either end, by lengthening one of the dashes.

I’m particularly interested to know whether it would be possible to create ISSOM/ISOM orienteering maps with it. It might be possible. Currently there isn’t a compelling solution for the Mac – I’ve created the City of London and Queen Mary College orienteering maps with Adobe Illustrator and a plugin supplying the standard orienteering symbols, strokes and swatches, but it’s not a very “intelligent” solution and requires a lot of manual tweaking. This is one area where the PC solution, OCAD, (which has a near-monopoly) is considerably cleverer – but the application is a lot less attractive to work with. Ortelius is a lot cheaper than OCAD too.

I’m not sure what formats Ortelius imports and exports – hopefully it doesn’t just create the maps in Yet Another Proprietary Format. The technical documentation on the site is at the moment very scant.

Maybe I’ll be able to persuade my club to buy me a copy, so I can give it a full review.