Categories
Uncategorized

Two Weeks

…until I step on a series of trains up to the far north of Scotland, before cycling back home. If all goes to plan, I should be back in London 11 days later, after 9 days of cycling, a day of travelling and a prologue.

Training has been going reasonably well, with a series of day rides radiating out of London, to Oxford, Brighton, Eastbourne, Rye and Canterbury, as well as an unplanned ascent of Leith Hill. The Kent hills are typically small, but numerous and steep – perhaps not the best practice for the longer, but generally gentler hills in Scotland.

It has been exceptionally hot here in London over the last few days. It isn’t forecast to stay this way, but I hope that we will get some sunshine in Scotland, and that we can cycle faster than the midges can fly! Nine days of rain would be a great shame. The long-range forecasts at the moment are unclear.

I would love to be able to push my location live to a map on this blog, but the iPhone can’t do this (unless I had an application open all the time, which would quickly eat the battery.) So I’ll probably aim just to stick up a blog post each day.

I should pass Gregory cycling in the other direction, somewhere just north of Inverness on the 19th.

Categories
Mashups OpenStreetMap

Map of UK Scenicness… and Pubs

picture-5

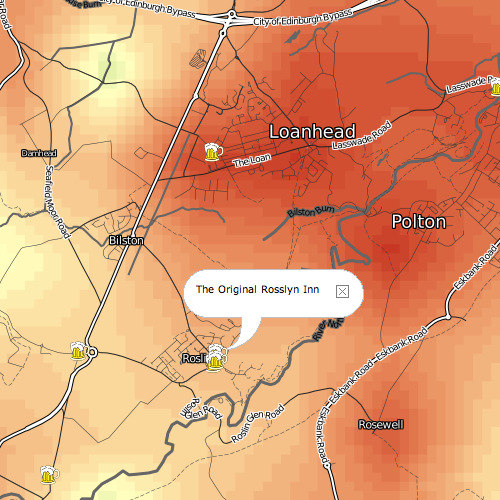
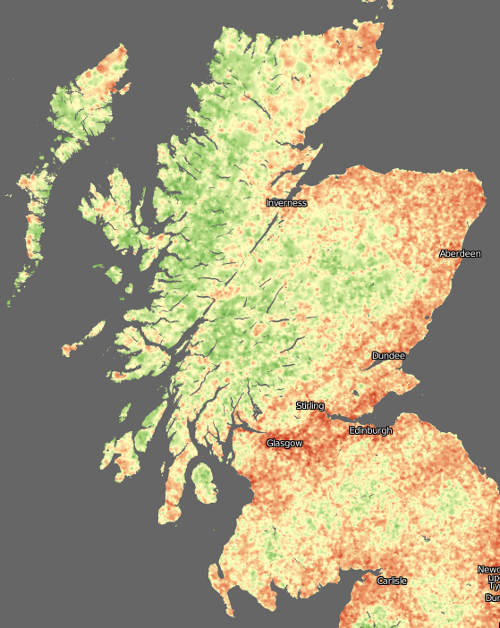
Here’s a little something [no longer online] I knocked up, based on the MySociety scenic score data release last week, as well as OpenStreetMap’s data for the UK – including particularly its pubs.

Basically, the vote point data was converted to a surface, using an IDW (Inverse-Distance Weighted) function. The cell size was pretty small (1km), so there isn’t much smoothing across many vote locations going on – a single vote may cause quite a steep gradient. Instead, the surface effectively extrapolates the values into all areas. Some jiggery-pokery was required to first project the votes onto the British National Grid (so that x/y distances become equivalent) and then the resulting surface was fully rasterised and reprojected to Spherical Mercator so that it could be tiled under the existing OpenStreetMap network overlay. This was surprisingly painful to do.

Note that the photographs that were voted on generally weren’t of the pubs shown on the map, so the pub might well be extremely photogenic – but in an area where the nearest Geograph photos used in the dataset for the voting were not rated highly.

It’s good to see that the Scottish Highlands come out so green (i.e. scenic.) Urban areas generally don’t do too well, although the voting was generally quite critical, so a yellowish hue is still a sign of a very scenic part of a city.

Data came from MySociety (using photographs from Geograph) and OpenStreetMap. The pub icon came from Wikimedia. The map tiles were produced using Mapnik for the OSM network overlay and MapTiler for the scenic map. The increasingly excellent OpenLayers is used to display the tiles, and a point vector layer showing the pubs.

There’s many areas with apparently no pubs at all. This is simply because the data wasn’t in OpenStreetMap when I pulled it in on Friday. However OpenStreetMap’s data is rapidly becoming more complete throughout the UK at the moment, so a future pull of the data should reveal many more pubs.

Some very remote areas don’t have any vote data either, but the production of the surface uses and extrapolates the values from nearby votes instead.

scotland
Categories
OpenLayers

Spherical Mercator Maps in OpenLayers 2.8

Following on from my previous post, it is indeed much easier to put Spherical Mercator “Google-style” maps into OpenLayers, following the 2.8 release this week.

Spherical Mercator is a pseudo-spatial reference system (SRS) that takes some liberties with strict geographic accuracy, to provide a projection that requires the minimum of maths to compute – as this is done on the fly in the user’s browser for OpenLayers-based maps, this is important. (More details.) Maps using Spherical Mercator often use a very hierarchical tile structure – tiles being the generally 256×256 pixel square GIF or PNG images that form the basis of many of the mainstream online “slippy” maps.

Google Maps, OpenStreetMap and NPE-OSM are three sources of tiles using the Spherical Mercator SRS – which the geographers here at UCL have taken to calling WebMercator, and is also known as EPSG:900913 (the numbers representing Google in l33t-speak…) – it has now also been assigned an official EPSG number of 4375 3857. Yahoo and Microsoft Virtual Earth also use Spherical Mercator but a different naming structure for their tiles. The common CRS for all these raster images allows them to be swapped out easily on web maps, which the Mapstraction project aims to achieve.

OpenLayers has an excellent page about Spherical Mercator and has some simple examples to get such a map up and running.

Anyway, I have a large number of sets of tiles in Spherical Mercator, for a project to be launched in the (hopefully near) future. It is now this easy to set them up as layers in OpenLayers.

The map itself still needs to be set up with care:

var bounds = new OpenLayers.Bounds(-30, 40, 15, 70); 
//Fits comfortably around the UK.

map = new OpenLayers.Map ("map", 
{
    controls: [
        new OpenLayers.Control.Navigation(),
        new OpenLayers.Control.PanZoomBar(),
	new OpenLayers.Control.Attribution(),
	new OpenLayers.Control.MouseDefaults()
        ],
    maxExtent: bounds.clone().transform(
        new OpenLayers.Projection("EPSG:4326"), 
        new OpenLayers.Projection("EPSG:900913")), 
    numZoomLevels: 18,
    maxResolution: "auto",
    units: "m",
    projection: new OpenLayers.Projection("EPSG:900913"),
    displayProjection: new OpenLayers.Projection("EPSG:4326")
});

I’ve created a function to create each layer:

function getChoroplethLayer(name, attrib)
{
    return new OpenLayers.Layer.OSM("", 
        "/tiles/" + name + "/${z}/${x}/${y}.png", 
        {numZoomLevels: 14, transitionEffect: "resize", 
          attribution: attrib});
}

Then it’s just a case of running through the layers:

layer_choropleth_1 = getChoroplethLayer("choropleth_1", "X");
layer_choropleth_2 = getChoroplethLayer("choropleth_2", "X");

…and adding them to the map:

map.addLayers([layer_choropleth_1, layer_choropleth_2]);

Easy!

If you want OpenStreetMap’s default Mapnik map tiles themselves, then it’s even easier:

map.addLayer(
    new OpenLayers.Layer.OSM(null, null, 
        {transitionEffect: "resize"}));
Categories
OpenLayers

OpenLayers New Release

OpenLayers, the open source Javascript framework for delivering powerful “slippy” maps via your web browser, has just had a new version released – 2.8. It’s the first release since September last year and is brimming with new features and bug fixes.

If the number of presentations mentioning OpenLayers at Monday’s OS GIS conference is anything to go by, there’s a lot of OpenLayers-powered sites out there now, many of which will benefit from the upgrade. Not least, getting OpenStreetMap base-mapping onto your OpenLayers website just got a whole lot easier. (And will get easier still once the documentation is written!)

Categories
Conferences

OSGIS UK Conference

I was on a very early train on Monday morning, to attend the First OSGIS UK Conference at Nottingham University, hosted by the Centre for Geospatial Science there.

Thanks to the the very tight schedule (speakers generally only had 15 minutes) I was able to see 23 presentations during the day. Most were good, and some were great – it was inspiring to see (a) what people were doing with open source GIS software and (b) how seriously everyone was using the tools – not just as an aside to their regular work but to create real, industrial strength applications for delivery to government bodies and industries.

Some themes came out very strongly – OpenLayers and the GDAL tools were, it seemed, mentioned by nearly every speaker. Certainly, the web browser is the point of delivery for many of the OS GIS projects happening now. Somewhat surprisingly, the map cartography engine Mapnik wasn’t mentioned at all. Less of a surprise, perhaps, was that OpenStreetMap was mentioned in just one talk. Indeed, there was little discussion of open data itself in general – the focus was much on utilising the open source applications and data formats, particularly those under the OSGeo umbrella. There was also no discussion on developing new revenue models from developing open source solutions. Maybe everyone has figured that one out already?

The audience, of around 150 people, was mainly commercial – ESRI and CadCorp (on the app side) and Ordnance Survey and EDINA (on the data side) were all in attendance. Only ~10% were in academia, although around half the talks were given by academics.

It might be the OSGIS UK conference, but there was an excellent representation from around Europe. One of the final sessions was by the European Commission, and many of the individual presentations were from universities around the continent. This reflects that much of the core OS GIS development itself has been driven by academia, such as GRASS in the US and gvSIG in Spain.

Though one of the keynotes was given by the head of the ICA (International Cartographic Association), there were hardly any cartographic presentations, and not really any on geovisualisation either. Perhaps I’m just now starting to appreciate that the “geo” world is actually split into at least four distinct fields – cartography, geovisualisation, GIS analysis and neogeo hacking, with less overlap than I might have thought. The State of the Map conference next month should provide me with my neogeo fix.

Anyway, the talk that won the best presentation award was the one I also liked best – it was well delivered and described a system that was designed for resilience and scalability – something that the best commercial systems can fail to achieve on launch day. It was Mapping Future Climate by Philip James et al at Newcastle University – the system was launched by the government last week and delivers complex models to any one that wants to see them, presented in an attractive way using Open Source tools. The talk also discussed the unusual projection system being used by the Met Office – yet another custom one, to join the thousands of EPSG-designated ones already out there! I also emphasised strongly, as did many in the audience, with the pains of adapting the site for use with IE6 – I’ve spent a couple of days recently pulling my hair out about this particular point. You can see the system here.

I also particuarly liked:

  • Map Warper by Tim Waters, which is essentially an attractive web-based GUI sitting on top of GDAL tools for georeferencing (or “orthorectifying”) rasters. It works well with scans of paper-based maps and aerial photos. I’ve used the Microsoft MapCruncher and the QGIS Georeferencer myself but this looks like a really nice way to do it. Mike also touched on the idea of getting an Open Historical Map project. This is something that the simple Marr Map Mashup in OpenLayers that Alex (my boss) and I did a couple of months back, could contribute to. Tim is also looking at orthorectifying the 10,000 scanned maps in the New York Public Library collection. I was particularly interested in his comments that the underlying GDAL tools are extremely fast, even for large and complex rasters. Not what I’ve found when using them myself, although I may be approaching them in a different way.
  • Sextante by Victor Olaya et al at the University of Extramadura (Spain), a very comprehensive set of over 230 geoprocessing tools, designed to integrate with the various Java-based OS GISes. Similar I think to the Arc Geotoolbox, it has a very similar GUI for building up chains and sequences of operations. In Quantum GIS (my GIS of choice at the moment) there is a similar plugin called fTools, and GRASS has all the operations you could ever need. But Sextante looks very feature rich and the web version uses the Ext-JS framework (as do a number of applications presented) which makes it look very polished indeed.
  • OS GIS for Teaching by Rita Engermaier at the University of Potsdam (Germany). An interesting outline of how students responded to being taught OS GIS applications compared with Arc. A pertinent question was asked at the end though – GIS-based employers will still be looking for specific Arc skills for some time to come. Another similar talk, on OS GISes being used in universities in general, raised the important challenges that (a) staff already know and have the proprietary GISes so why change, and that (b) it’s straightforward to justify purchasing them with departmental budgets, so there’s no perceived benefit of saving the money.
  • SPIRE and Open Source by Rob Booth (IBM) – looking at how open source tools were helping Defra manage and display some of its huge sets of diverse geographic data.
  • Aerial Photo Processing in GRASS by John Stevenson et al at the University of Manchester. This was excellent and a very close contender for my favourite paper – it showed off the power of using GRASS – on the command line no less! – to process remotely sensed data. I wonder if my void filling and hill-shading, that I’ve tried to do with the GDAL tools with only partial success, would be better done in GRASS. Its learning curve was acknowledged but it might be time for me to get stuck into it. I was also very interested to hear about GMT – a toolset which includes the capability to create attractive contours. My own contours, derived using GDAL tools from the SRTM DEM, are not very pretty, so I’ll have a look at it.

Everyone got a 2GB USB key with the conference papers pre-loaded on it which was a nice touch.

A few more notes on some of the other talks:

  • The Ordnance Survey have moved to the more up-to-date OpenLayers 2.7 for their OpenSpace fork. They are also overhauling their lower level OSGB Web Tools package to be a bit more user-friendly, and are planning several releases in the next few months.
  • PostGIS has applied to be part of the OSGeo family. Makes a lot of sense, it’s great to have an organisation packaging and marketing an excellent suite of production-ready OS tools, and with PostGIS, the full stack is there. Now let’s have Mapnik there too!
  • The European Commission have their own licence – the EUPL – for publically-funded work designed for use by public authorities. It’s “yet another” OS licence but is compatible with the various main OS licences (GPL, Apache) but designed to be enforceable across all the member states’ jurisdictions. It’s more of a “marketing” thing, apparently, to help encourage OS software use by administrations across the continent. They also have “yet another” code sharing platform, OSOR.eu, where code can be hosted, if it’s publicly financed and open source. Sextante and gvSIG are two projects using the “GIS/SDI” area on OSOR – it can also act as the underlying repository while the project’s own development portal keeps its branding. The pan-European nature could potentially be very powerful for raising awareness of OS projects in the public sector.
  • There were some lower-level talks, on data and semantics – areas that might not be so glamorous, but are still interesting. These included an outline of the GeoSciML schema for describing geological data, and defining a rules-based language for geospatial constructs, such as how a feature can be identified as being a roundabout, for possible use in the pan-European INSPIRE initiative.
  • The OSGeo UK group is new and is perhaps still deciding what its true role is – whether it should be lobbying the government for even greater use of OS GIS tools, having a marketing role to organisations, or providing a forum for UK-specific discussion of OS GIS usage.
  • A common theme of the higher-level, application based talks was that the project designers were very impressed with the support they had received from the developers of the underlying tools – with patches often being delivered overnight. This is very encouraging and shows the healthy and active nature of the field.

Overall, I was most impressed with what I saw. There was a great buzz in the room – a diverse range of backgrounds, but everyone enjoying seeing what could be done with Open Source tools. There was perhaps a feeling that we might not be having to use Arc any more in the near future, perhaps?

Nottingham already have next year’s conference date set. Maybe I should do a talk on Mapnik’s capabilities at the next one…

Categories
Conferences OpenStreetMap

Open Source GIS is from Mars, OpenStreetMap is from Venus?

I’m going to a couple of conferences in the next few weeks – the 1st Open Source GIS UK (OSGIS UK) conference at Nottingham University, and State of the Map 2009, the 3rd OpenStreetMap conference in Amsterdam.

On the face of it, one might expect an overlap between the two conferences. In both cases, it is about a community geared towards developing and using open source (“free”) geo-applications to further understanding of spatial issues or “do cool things”.

But OpenStreetMap (OSM) is not in the title of any of the talks on the OSGIS agenda.”GIS” appears just once in the SOTM agenda titles – “Bridging the GAp: Using OSM Data with GIS Tools” by Jochen Topf should be an interesting talk.

I suppose the two communities are really separate, coming from two different sources, operating on two levels and with two aims.

  • The open source GIS community comes from academia, particularly Geography, and is interested in having the power to develop applications to advance research, without facing the user interface and functionality challenges of the big proprietary GISes, not to mention the expensive licensing costs. They already have the data – they’ve collected it, or negotiated academic rates for access to the national mapping agencies.
  • The OSM community comes from IT and just wants to do cool things with the data – but doesn’t have the willingness to pay commercial rates for the data – so they are more focused with getting the data in the first place. Once they have it, they are not willing to learn (or aware of ) GISes, which are complicated bits of software, at best, instead generally scripts for specific bits of functionality.

Two worlds, it seems, with “open” goals but seemingly little overlap.

Categories
Orienteering

Walsh Trophy

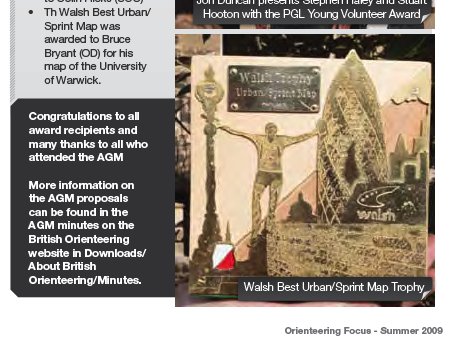
Just seen a picture of the Walsh Trophy, a new award for Sprint/Urban maps produced in the UK, in the most recent issue of Focus magazine.

Here it is:
walshtrophy

The design is of an orienteer leaping off the front of a security wall in front of the Gherkin building in the City of London – right by one of the “spectacular” controls that formed part of the inaugural City of London race I put together last year. In fact, it’s based on this picture by Chris5aw, of one of the competitors (a Spanish runner, if I remember correctly), which also was on the front cover of an earlier Focus issue. The Gherkin has been moved further back, in the trophy design, so that it can be completely seen. The wall is now a brick wall instead of black marble, and the lamppost has been made considerably more ornate!

Categories
Leisure

3D Course Flythroughs

This video of the 2009 Tour de France course has been going around.

With Google Earth 5.0’s new Tour functionality, particularly the GX extensions in the KML Touring spec, I reckon it should be possible to create a similar flythrough for my forthcoming Thurlon trip, based on GPX route data and adding appropriate features, zooms and swoops to show the interesting bits.

I’ve just noticed, incidentally, that the Thurlon trip is on at the same time as the latter part of the TdF and finishes on the same day. We aren’t, however, traveling further than the TdF riders, on any of the days, and we certainly aren’t doing any alpine-sized climbs! We are actually going further than the TdF riders on the final weekend.

Date Thurlon Our Terrain Destination Tour de
France
Their Terrain Destination
17 July 63km Time trial Thurso 200km Medium mountains Colmar
18 July 145km Medium mountains The Black Isle 199km Plain Besançon
19 July 140km Medium mountains The Great Glen 208km High mountains Verbier
20 July 141km Medium mountains Loch Lomond Rest day Rest day Verbier
21 July 138km Plain Edinburgh 159km High mountains Bourg-Saint-Maurice
22 July 152km Medium mountains Morpeth 170km High mountains Le Grand-Bornand
23 July 146km Plain Whitby 41km Time trial Annecy
24 July 144km Plain Lincolnshire 178km Plain Aubenas
25 July 164km Plain King’s Lynn 167km High mountains Mont Ventoux
26 July 173km Plain London 164km Plain Paris
Categories
Orienteering Events Log

Battersea Park Race

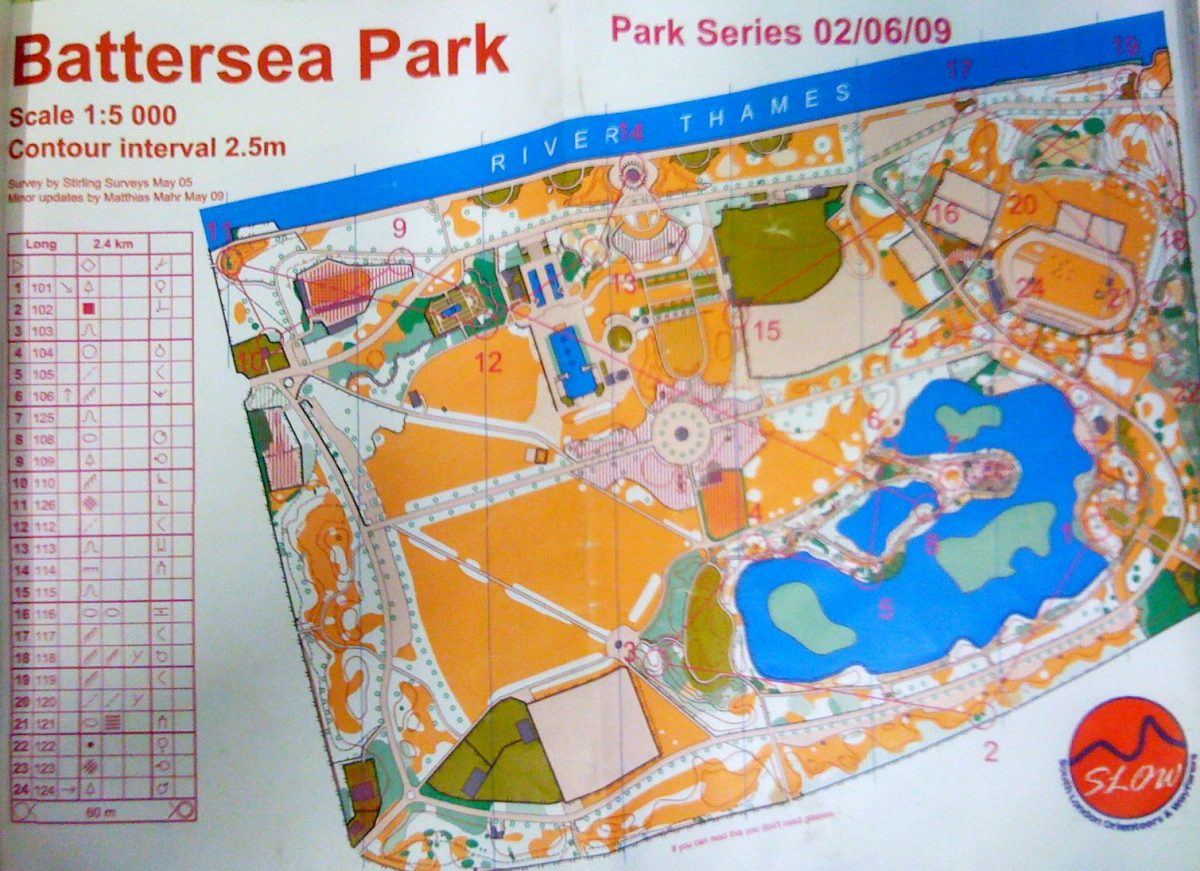
The second of this summer’s SLOW Park Race Series was last night, at a rather special venue – Battersea Park in south-west London. The last time this area was used for orienteering was at the Sprint finals of the Orienteering World Cup competition in 2005 – if it was good enough for the world’s elite, it was good enough for me!

The park is quite ornamental and I was expecting a run high on dramatic views but short on technicality, however Abi and Matthias planned a excellent Long course which got steadily more technical towards the end – I started making quite a few mistakes after the half-way point, and saw other people making bigger ones. My worst was not reading the control description at No. 14 (it is a sprint area after all!) and going round the Japanese Pagoda rather than up onto its plinth. The hot and humid weather probably didn’t help with the concentration either. There was some excellent long legs allowing for quite a bit of route choice – there’s too much “stuff” in the park to allow running along the leg line, unlike at Clapham Common a couple of weeks ago.

There was a great turnout – over 70 people started the Long course which is definitely a record for this series.

Looking forward to the next one in two weeks in Ravenscourt Park and next week’s Mobile-O (an orienteering race guided by mobile-phone!)

Here’s the map – pic snapped on my iPhone, hence the rubbish quality:
battersea

Categories
Leisure

London to Rye

This was the first long bike ride I did on my new bike – a Giant Defy 2.5 road bike. Having recently cycled from London to Eastbourne, as part of training for my cross-Britain epic this summer, I was keen to do another ride across the hill Kent Weald, and to repeat the first hill, with its gentle climb followed by a dramatic 15% drop off the edge of the North Downs.

The route started at Orpington, in order to avoid a tedious two-hour section through London, and went via Tunbridge Wells and part of National Route 18. The section through Bedgebury Forest was on forest tracks, the rest was generally on quiet roads. I didn’t take a map, instead programming the route into my Garmin, which gave accurate turn-based directions all the way to Rye. The route was certainly hilly – with two large hills at the beginning and five small ones, including three in quick succession just west of Tunbridge Wells. The weather was warm with light clouds, but brooding thunderclouds were in the English Channel and they brought some rain for the final third of the route. I cycled it with Anna – who has been doing some serious training recently as she beat me up almost all the hills – and Iain, who accompanied us as far as Tunbridge Wells.

[osm_map lat=”51.18″ long=”0.352″ zoom=”9″ width=”500″ height=”400″ gpx_file=”/files/2009/06/course-1.gpx”]
lonryeprofile

Rye was very nice, even in the pouring rain. Its cobbled streets were certainly not suitable for cycling around, so we pushed the bikes around and explored Mermaid Street and the other ancient, pretty streets in the village. Certainly if we had had more time, and the weather had been nicer, then a stop in one of the Ye Olde pubs with their beer gardens would have been nice. As it was, we had a train to catch and it was starting to get dark, so we headed back to London – it’s nearly two hours on the train to get back, so I was quite pleased we had cycled the 101km route in just over 5 hours, plus 2 hours of breaks.

img_0358