Categories
Mashups OpenStreetMap

Map of UK Scenicness… and Pubs

picture-5

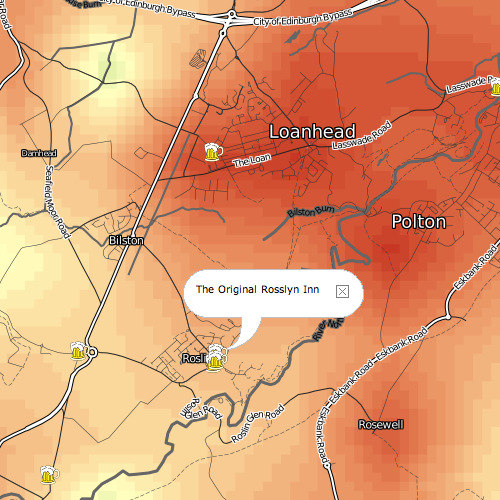
Here’s a little something [no longer online] I knocked up, based on the MySociety scenic score data release last week, as well as OpenStreetMap’s data for the UK – including particularly its pubs.

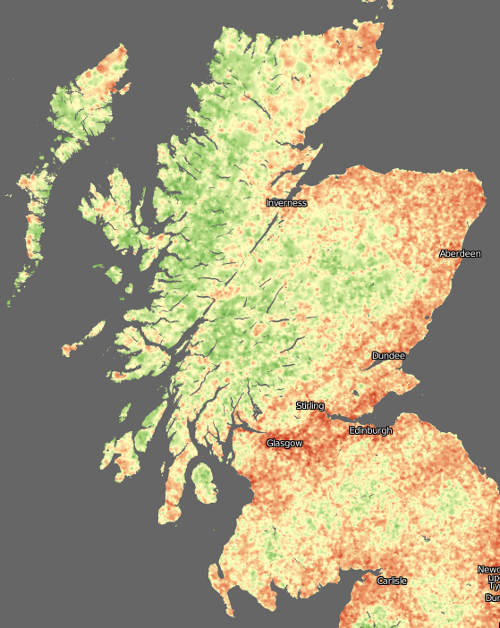
Basically, the vote point data was converted to a surface, using an IDW (Inverse-Distance Weighted) function. The cell size was pretty small (1km), so there isn’t much smoothing across many vote locations going on – a single vote may cause quite a steep gradient. Instead, the surface effectively extrapolates the values into all areas. Some jiggery-pokery was required to first project the votes onto the British National Grid (so that x/y distances become equivalent) and then the resulting surface was fully rasterised and reprojected to Spherical Mercator so that it could be tiled under the existing OpenStreetMap network overlay. This was surprisingly painful to do.

Note that the photographs that were voted on generally weren’t of the pubs shown on the map, so the pub might well be extremely photogenic – but in an area where the nearest Geograph photos used in the dataset for the voting were not rated highly.

It’s good to see that the Scottish Highlands come out so green (i.e. scenic.) Urban areas generally don’t do too well, although the voting was generally quite critical, so a yellowish hue is still a sign of a very scenic part of a city.

Data came from MySociety (using photographs from Geograph) and OpenStreetMap. The pub icon came from Wikimedia. The map tiles were produced using Mapnik for the OSM network overlay and MapTiler for the scenic map. The increasingly excellent OpenLayers is used to display the tiles, and a point vector layer showing the pubs.

There’s many areas with apparently no pubs at all. This is simply because the data wasn’t in OpenStreetMap when I pulled it in on Friday. However OpenStreetMap’s data is rapidly becoming more complete throughout the UK at the moment, so a future pull of the data should reveal many more pubs.

Some very remote areas don’t have any vote data either, but the production of the surface uses and extrapolates the values from nearby votes instead.

scotland
Categories
OpenLayers

Spherical Mercator Maps in OpenLayers 2.8

Following on from my previous post, it is indeed much easier to put Spherical Mercator “Google-style” maps into OpenLayers, following the 2.8 release this week.

Spherical Mercator is a pseudo-spatial reference system (SRS) that takes some liberties with strict geographic accuracy, to provide a projection that requires the minimum of maths to compute – as this is done on the fly in the user’s browser for OpenLayers-based maps, this is important. (More details.) Maps using Spherical Mercator often use a very hierarchical tile structure – tiles being the generally 256×256 pixel square GIF or PNG images that form the basis of many of the mainstream online “slippy” maps.

Google Maps, OpenStreetMap and NPE-OSM are three sources of tiles using the Spherical Mercator SRS – which the geographers here at UCL have taken to calling WebMercator, and is also known as EPSG:900913 (the numbers representing Google in l33t-speak…) – it has now also been assigned an official EPSG number of 4375 3857. Yahoo and Microsoft Virtual Earth also use Spherical Mercator but a different naming structure for their tiles. The common CRS for all these raster images allows them to be swapped out easily on web maps, which the Mapstraction project aims to achieve.

OpenLayers has an excellent page about Spherical Mercator and has some simple examples to get such a map up and running.

Anyway, I have a large number of sets of tiles in Spherical Mercator, for a project to be launched in the (hopefully near) future. It is now this easy to set them up as layers in OpenLayers.

The map itself still needs to be set up with care:

var bounds = new OpenLayers.Bounds(-30, 40, 15, 70); 
//Fits comfortably around the UK.

map = new OpenLayers.Map ("map", 
{
    controls: [
        new OpenLayers.Control.Navigation(),
        new OpenLayers.Control.PanZoomBar(),
	new OpenLayers.Control.Attribution(),
	new OpenLayers.Control.MouseDefaults()
        ],
    maxExtent: bounds.clone().transform(
        new OpenLayers.Projection("EPSG:4326"), 
        new OpenLayers.Projection("EPSG:900913")), 
    numZoomLevels: 18,
    maxResolution: "auto",
    units: "m",
    projection: new OpenLayers.Projection("EPSG:900913"),
    displayProjection: new OpenLayers.Projection("EPSG:4326")
});

I’ve created a function to create each layer:

function getChoroplethLayer(name, attrib)
{
    return new OpenLayers.Layer.OSM("", 
        "/tiles/" + name + "/${z}/${x}/${y}.png", 
        {numZoomLevels: 14, transitionEffect: "resize", 
          attribution: attrib});
}

Then it’s just a case of running through the layers:

layer_choropleth_1 = getChoroplethLayer("choropleth_1", "X");
layer_choropleth_2 = getChoroplethLayer("choropleth_2", "X");

…and adding them to the map:

map.addLayers([layer_choropleth_1, layer_choropleth_2]);

Easy!

If you want OpenStreetMap’s default Mapnik map tiles themselves, then it’s even easier:

map.addLayer(
    new OpenLayers.Layer.OSM(null, null, 
        {transitionEffect: "resize"}));