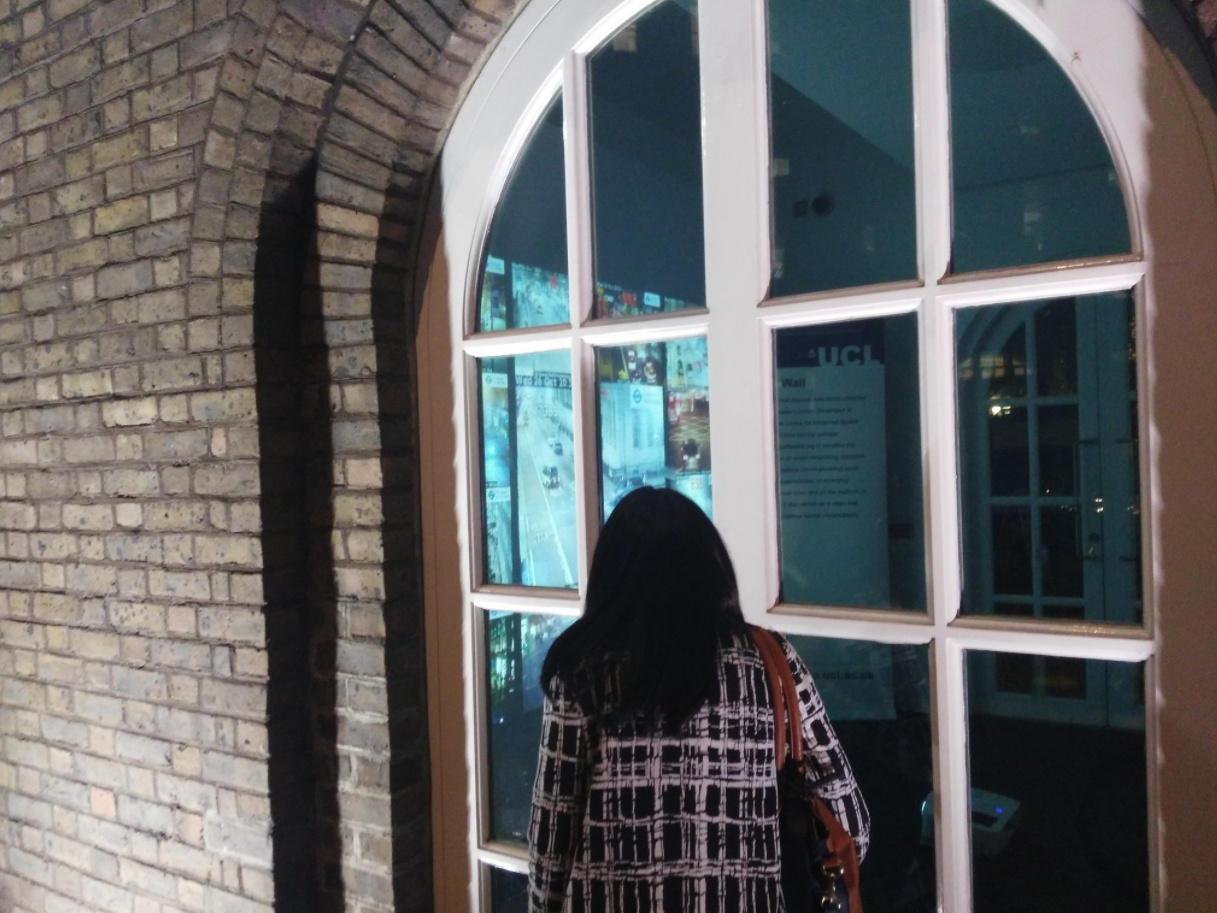
So Big Data Here, a little pop-up exhibition of hyperlocal data, has just closed, having run continuously from Tuesday evening to this morning, as part of Big Data Week. We had many people peering through the windows of the characterful North Lodge building beside UCL’s main entrance on Gower Street, particularly during the evening rush hour, when the main projection was obvious through the windows in the dark, and some interested visitors were also able to come inside the room itself and take a closer look during our open sessions on Wednesday, Thursday and Friday afternoons.
Thanks to the Centre for Advanced Spatial Analysis (CASA) for loaning the special floor-mounted projector and the iPad Wall, the Consumer Data Research Centre (CDRC) for arranging for the exhibition with UCL Events, Steven Gray for helping with the configuration and setup of the iPad Wall, Bala Soundararaj for creating visuals of footfall data for 4 of the 12 iPad Wall panels, Jeff for logistics help, Navta for publicity and Wen, Tian, Roberto, Bala and Sarah for helping with the open sessions and logistics.
The exhibition website is here.
I created three custom local data visualisations for the big screen that was the main exhibit in the pop-up. Each of these was shown for around 24 hours, but you can relive the experience on the comfort of your own computer:
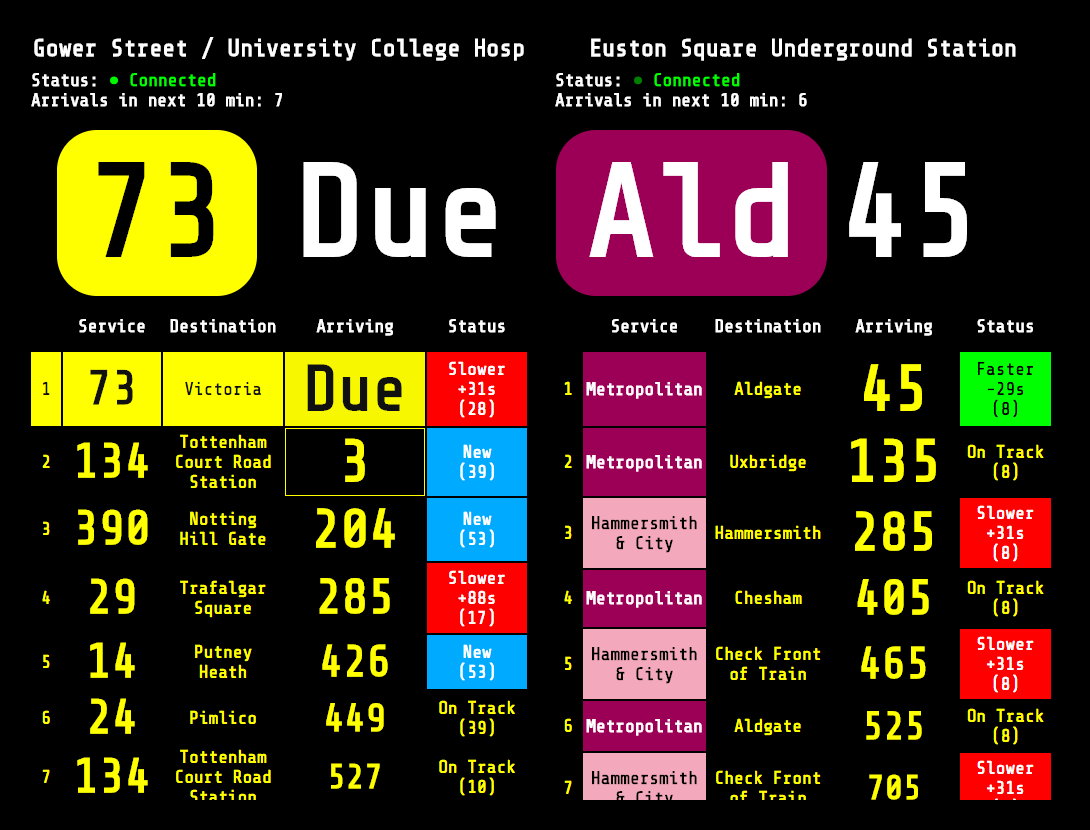
1. Arrival Board
This was shown from Tuesday until Wednesday evening, and consisted of a live souped-up “countdown” board for the bus stop outside, alongside one for Euston Square tube station just up the road. Both bus stops and tube stations in London have predicted arrival information supplied by TfL through a “push” API. My code was based on a nice bit of sample code from GitHub, created by one of TfL’s developers. You can see the Arrival Board here or Download the code on Github. This is a slightly enhanced version that includes additional information (e.g. bus registration numbers) that I had to hide due to space constraints, during the exhibition.
Customisation: Note that you need to specify a Naptan ID on the URL to show your bus stop or tube station of choice. To find it out, go here, click “Buses” or “Tube…”, then select your route/line, then the stop/station. Once you are viewing the individual stop page, note the Naptan ID forms part of the URL – copy it and paste it into the Arrival Board URL. For example, the Naptan ID for this page is 940GZZLUBSC, so your Arrival Baord URL needs to be this.
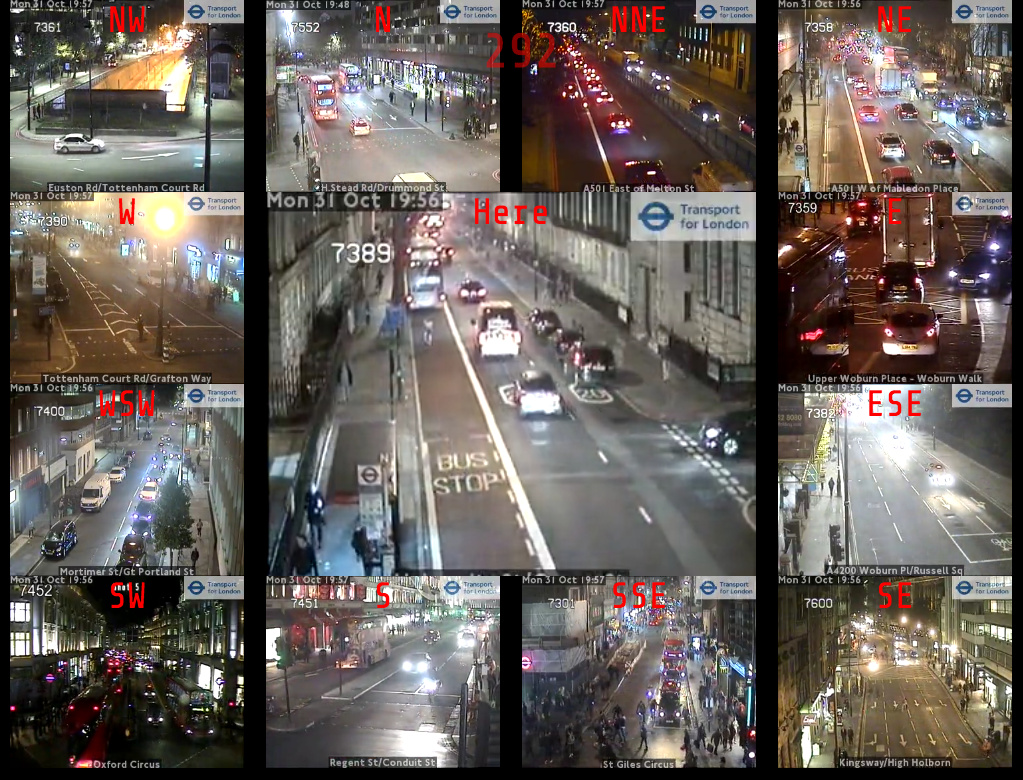
2. Traffic Cameras
This was shown from Wednesday evening until Friday morning, and consisted of a looping video feed from the TfL traffic camera positioned right outside the North Lodge. The feed is a 10 second loop and is updated every five minutes. The exhibition version then had 12 other feeds, surrounding the main one and representing the nearest camera in each direction. The code is a slightly modified version of the London Panopticon which you can also get the code for on Github.
Customisation: You can specify a custom location by adding ?lat=X&lon=Y to the URL, using decimal coordinates – find these out from OpenStreetMap. (N.B. TfL has recently changed the way it makes available the list of traffic cameras, so the list used by London Panopticon may not be completely up-to-date.)
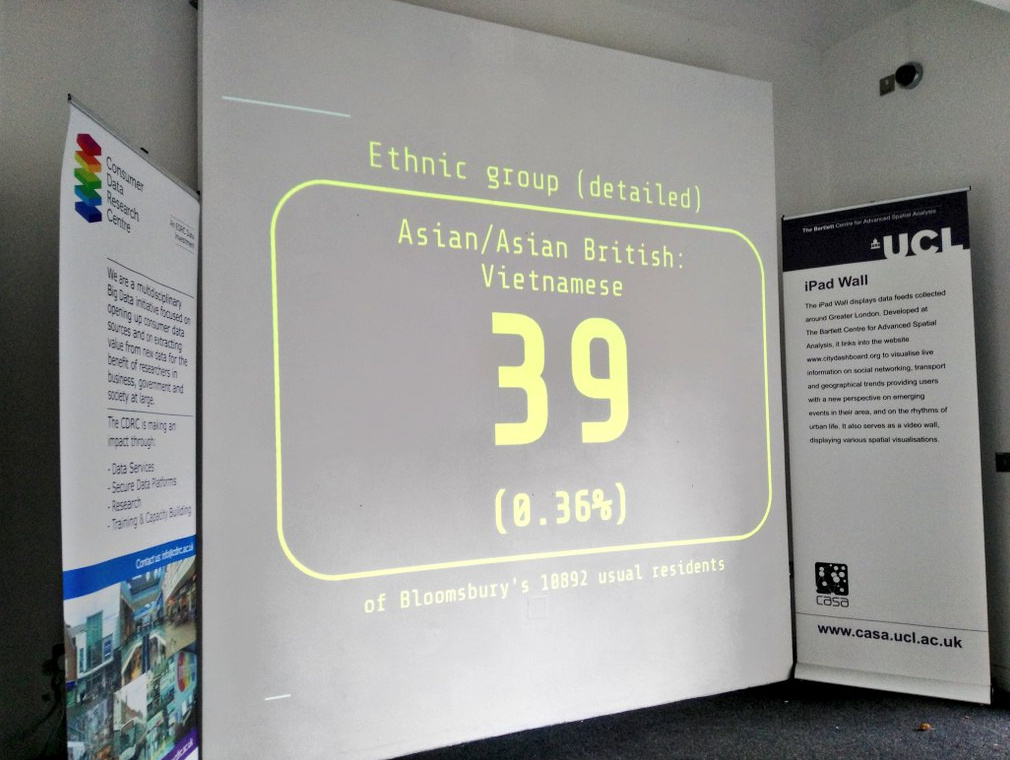
3. Census Numbers
Finally, the screen showed randomly chosen statistical numbers, for the local Bloomsbury ward that UCL is in, from the 2011 Census. Again, you can see it in action here (wait 10 seconds for each change, or refresh), and download the code from GitHub.
Customisation: This one needs a file for each area it is used in and unfortunately I have, for now, only produced one for Bloomsbury. The data originally came, via the NOMIS download service, from the Office for National Statistics and is Crown Copyright.