As a weekend project, I’ve made an interactive version of my London North/South artwork.
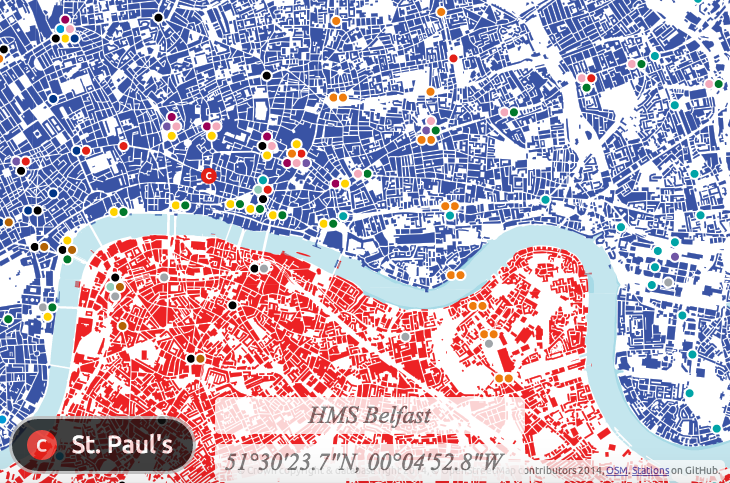
As well as the blue and red house silhouettes, assembled in QGIS, I’ve added in GeoJSON files of the River Thames (from Ordnance Survey Vector Map District, like the buildings) and of tube/DLR/Overground stations – the location/name/network data is from this GitHub file and I’ve applied a custom styling in OpenLayers 2, with station name styling inspired by the NYC Subway signs. The positional information comes from an OpenLayers control – I’m using a utility function to modify the output to use degrees, minutes and seconds. Finally, the naming popup is a set of UTFGrid JSON files (with 2-pixel resolution) based on OpenStreetMap data for polygons. Where the polygon has a building, leisure or waterway tag, I’m extracting a name, if available, and showing it. The coverage here is therefore only as good as building naming is in OpenStreetMap. I could potentially add in street names in the future.