The Broadband Speed map has been one of the most popular maps that the Consumer Data Research Centre has ever published on our CDRC Maps platform. The map is based on data from Ofcom, the UK’s digital connectivity and broadcast media regulator, and I was invited to talk at their Innovation Workshop event, hosted by ODI Leeds, earlier this month. My brief was to demonstrate the Broadband map but also critique Ofcom’s open data offering (which provided the data for the map). The talk slides can be found below:
As part of the preparation for the event, I produced a new version of the the Broadband map, showing 2017 data from the Connected Nation report (the original was based on the 2016 data). This gave the opportunity to therefore prepare a third map, showing the change between 2016 and 2017. Note that this is showing the change in the average broadband download speed experienced across both business and residential premises conneections, averaged by postcode with each postcode averaged then averaged again across the local output area (which typically contains five postcodes for residential areas, but many more than this for business areas.) The metric population numbers displayed when you mouse across each area, therefore, is the number of business and residential connections – typically 50-150 for the latter.
The map shows a general light green gradient across the country, showing broadband connection speeds are gradually increasing, as more and more fibre to the cabinet (FTTC) is installed and people change organically contracts to providers with better service. The places where other colours appear are the interesting results. Large increases are seen in rural Lancashire, near Kendal in the Lake District, as a community-driven ultra-high-speed rural service there continues to roll out. More dramatic improvements are seen just to the east of Cheltenham, again a rural area with specialist high technology and defensive industries.
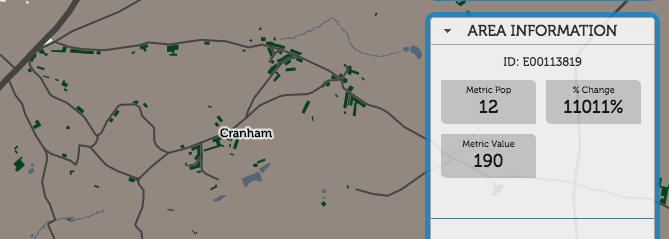
Cranham, for example, has seen a 11000% improvement, from 1.7mbit/s to 190mbit/s, as new business connections have come online:
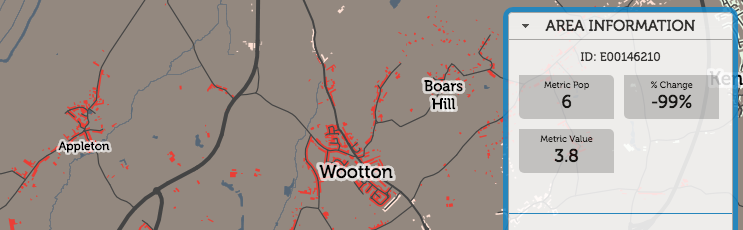
Appleton, on the other hand, has seen a 99% decrease, from 540mbit/s to 2.3mbit/s:
In London, the drop around King’s Cross, the previous year’s fastest postcode, is almost certainly not due to a general decrease in available speed, but actually because residential connections have come online, and demonstrates the problem with aggregating by the residentially defined “Output Area” geography. The previous, ultrafast result was likely due to dedicated ultra-highspeed links into Google’s new UK office, and other high-technology businesses opening there. Since then, the residential blocks nearby have opened. These still have pretty nice connections, but not the business-level infrastructure needed. So, it shows as an average fall in London.
Rotherhithe is always an interesting area:
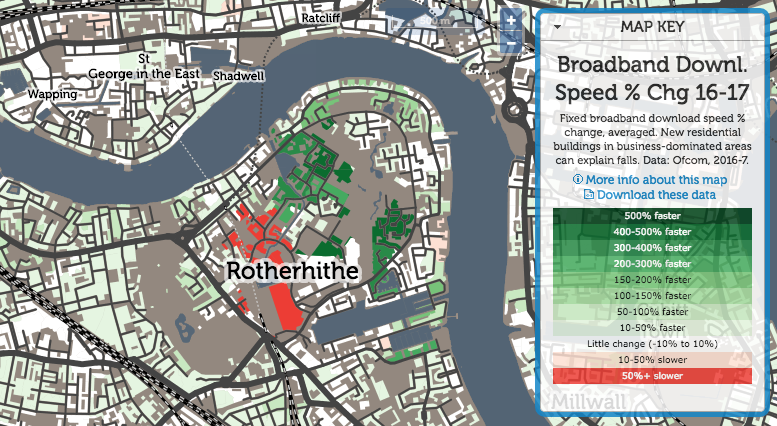
A traditionally very poorly connected area, both in transport but also digital connectivity, it has seen dramatic improvements in many areas. but also big falls in the newest area – again possibly due to an increased residential component in the mix.
One reply on “Changing Broadband Speeds in the UK”
Great easy to use interactive map, thanks for sharing. Good commentary around business vs residential speeds to explain some of the dramatic speed changes.