When running a fleet of dockless bikeshare bikes, one of the potentially most costly problems is theft of the bicycles. They aren’t attached to anything if they are dockless, even if they are in a marked “hub”, and, even if the bikes are typically heavier than a personal bike, they can still be easy targets for theft. There are six operators in central London currently and each of these operators has to consider whether it is worthwhile operating in a particular borough – whether the profit to be made from legimitate hires outweights the costs involved in replacing stolen bicycles.
With the news earlier this month that Beryl is suspending operations in Enfield due to vandalism after just three months of operation, and following Urbo’s similarly rapid arrival to and departure from the borough (and indeed all of the UK) last year, I’ve done a simple analysis of the risk/reward of operating in different London boroughs. This analysis is an alternative approach to a previous model that looked specifically at general vandalism rates and usage rates, because it looks at the daytime as well as nighttime populations.
I’ve used the Census 2011 Travel to Work counts, comparing the full 16-74 population with that that travels to work mainly by bicycle, looking at both the Workplace populations (i.e. daytime/evening) and the Residential populations (i.e. nighttime/weekends). A simple approximation of the populations is achieved by equally weighting both figures. This means that Croydon’s average population more than halves its nighttime population during the day, while Westminster’s triples. I also only looked at bikes being used to regularly travel to work, as these are the ones that are most likely on the streets, and therefore much more vulnerable to theft.
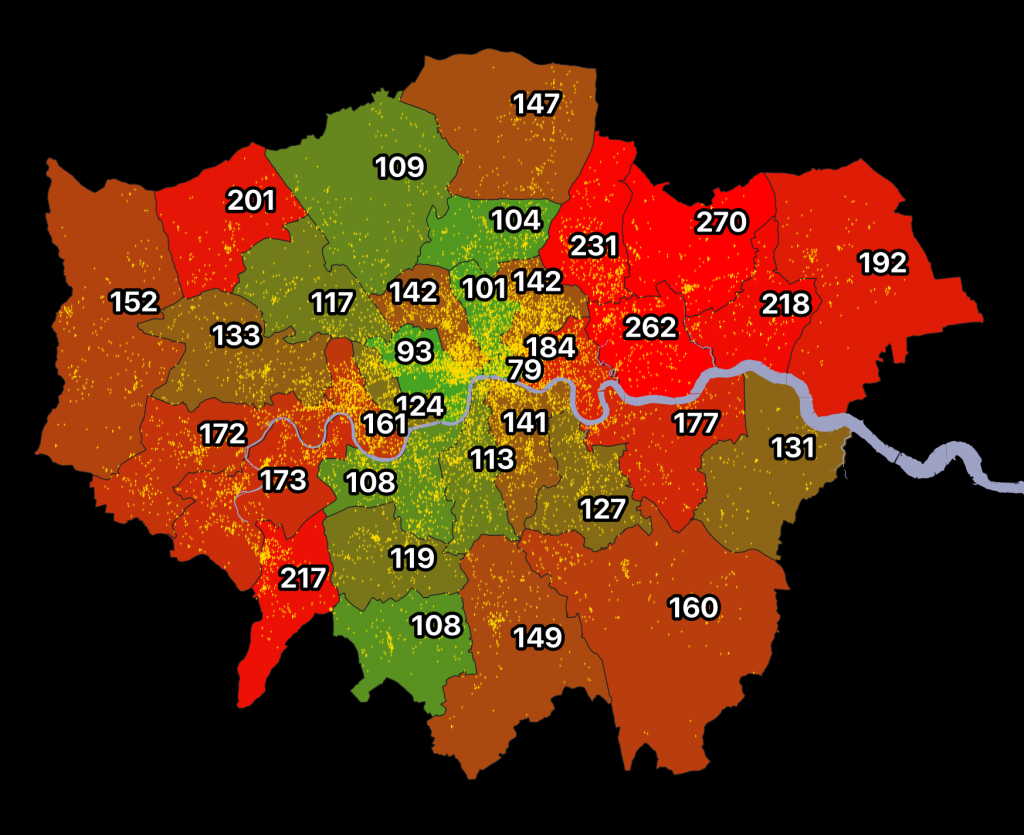
I also use the Police data statistics on cycle theft, for 2018-9, looking across the Metropolitan Police, City of London Police and British Transport Police force data. I only considered bicycle theft rather than vandalism, as the latter is not broken down by object type, and I believe that general bicycle theft is a good proxy for vandalism and theft of dockless bicycles – with vandalism often occurring as a result of attempted theft. Dockless bicycles are probably not numerous enough in London yet (there are maybe around 3000 available) compared with the ~200000+ private bicycles that are used to commute to work daily with many left in public parking facilities, albeit almost always chained to an immoveable object.
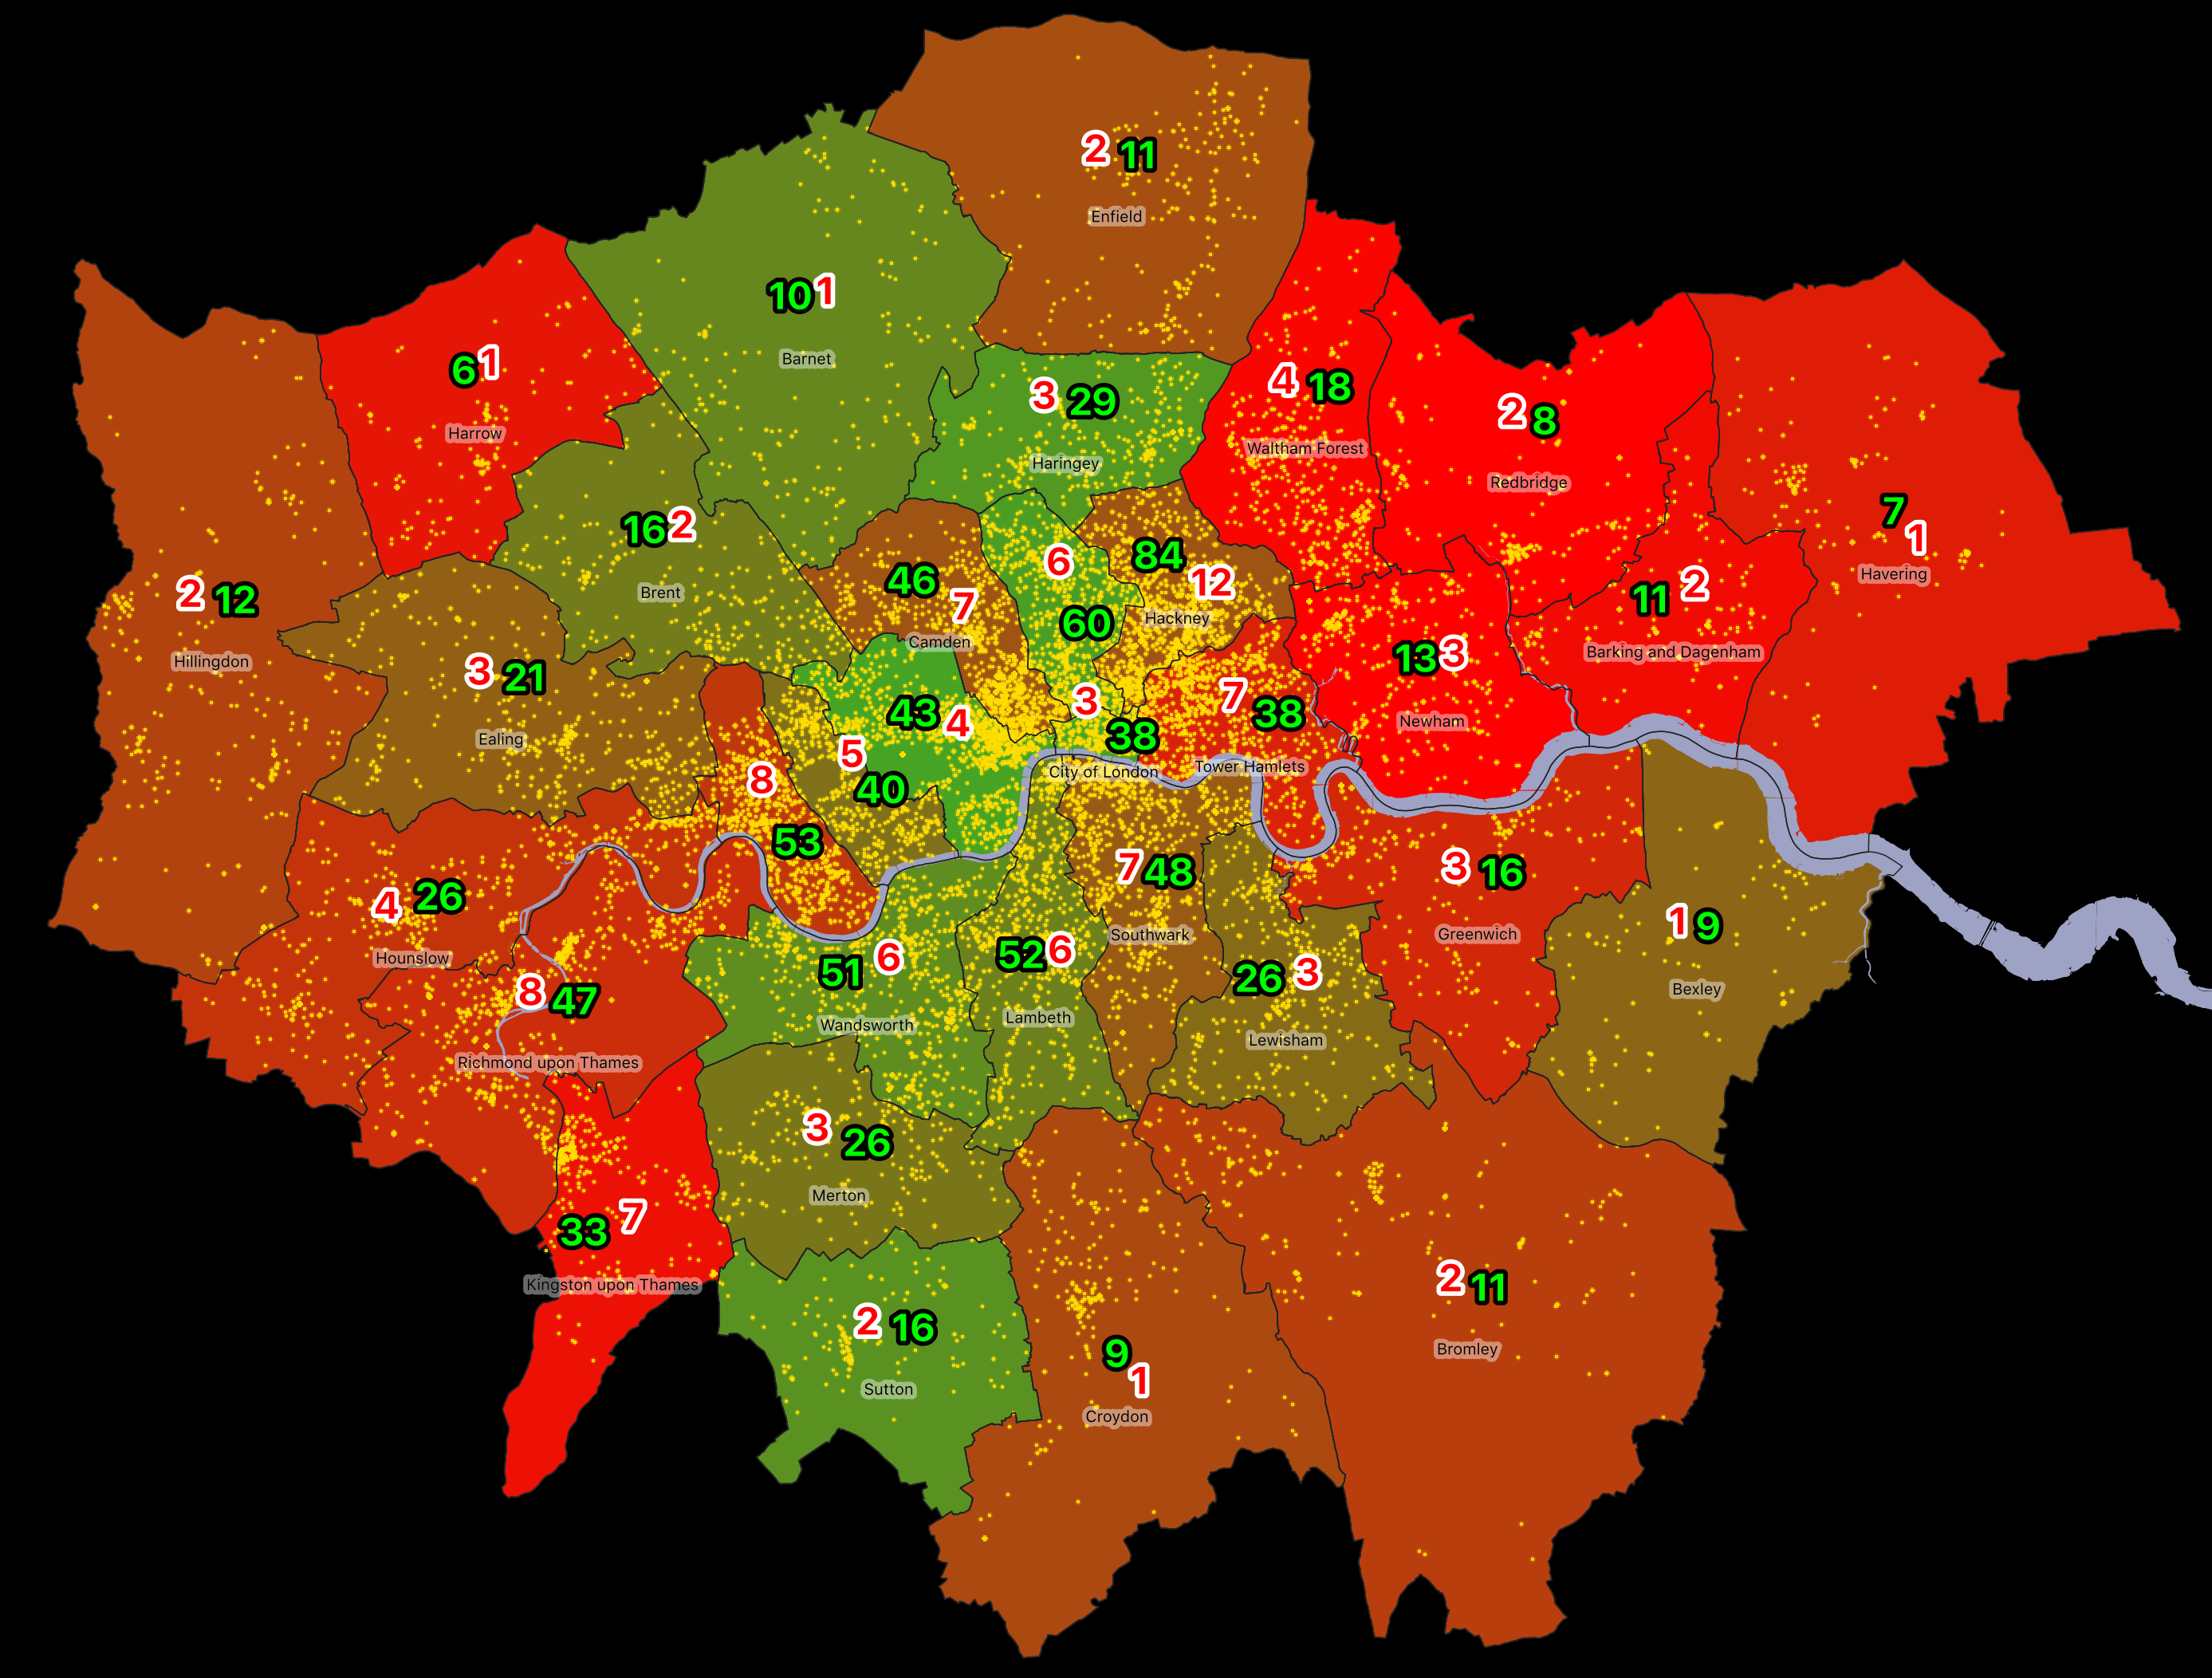
I was keen to not map areas of high cycle theft or use – but rather map one compared to the other. Some places see very little cycle use – the low green numbers – e.g. Harrow and Havering. But they still see some cycle theft – the red numbers – and so the average number of thefts per bicycle is therefore high. On the other hand, Westminster, the City and Islington also see high theft rates but these are more than balanced out by very high usage rates. Only in Hackney, does the very high cycle usage rate (84 bikes/1000 people) still suffer from the also very high theft rate (12 bikes/1000 people). In Hackney, you’ll therefore probably suffer a stolen bike every 7 years on average. In Redbridge though, it’s 1 every 4 years – there aren’t very many bikes in the borough at all, but the few that there are often victims of cycle theft.
This is a really rough study – it could be improved by using more recent population/cycle usage data (which is available for residential areas but not work areas), by looking at vandalism as well as cycle theft, and by more carefully modelling the 24-hour population. But it’s good indicator of why Islington, Westminster and the City of London are so popular with operators, despite a high “headline” rate of theft when looking at the raw Police numbers, and why Greenwich, Newham and Kingston have no operators at all, despite plenty of regular cyclists. It is also why boroughs that sit in the middle – Enfield, Croydon, Southwark and Hillingdon – are probably only going to succeed with dock-based approaches, and so likely require council capital funding rather than hoping that dockless operators will be able to run a successful commercial service for making bikes easily available to those that don’t own one or have one handy – which is what bikeshare is.
Data used in this study: