Categories
OpenLayers

Review: OpenLayers – The Book

OpenLayers 2.10 Beginner’s GuideErik Hazard, Packt Publishing

The OpenLayers 2.10 Beginner’s Guide (buy: Amazon) is a guidebook for a technology that is relatively unknown in the broader technology world – OpenLayers being a JavaScript-based online mapping framework, the open-source equivalent of the popular Google Maps API. As mapping and open source software have increasingly become mainstream over the last couple of years, such a guide has appeared at just the right time.

As with many open source projects, documentation and startup guides are freely available online, but their quality and completeness often is very variable. A paper-based guidebook is still the best way to get to grips with the complete capabilities of a complex framework like OpenLayers – but with the danger that it is likely to date quickly as the project evolves. The author is particularly brave in referring to the current version – 2.10 – in the book title, as any subsequent release (2.11 is probably just around the corner) will appear to age the book, while actually it is likely the vast majority of its content will remain relevant with the new version.

The book serves both as an introduction for beginners to JavaScript and/or online mapping, while also acting as a reference that means it can remain in the development bookshelf for even more advanced developers. There is not a standalone reference section – but then the automatically-generated JavaScript documentation online perhaps serves best for this. However the detail of the chapters mean they effectively can act as a near complete reference.

OpenLayers does have a notably steeper learning curve than (for example) the Google Maps API – although it is ultimately more powerful. A physical, complete guide like this does therefore have a definite benefit to a developer aiming to produce online mapping applications based on open source technology.

The book, slightly surprisingly, introduces some fairly weighty programmatic detail right at the beginning – in Chapter 1. For example, I wasn’t expecting a discussion of Object Orientated Programming, and defining objects, instances and classes/subclasses, so early on in the book. It could be argued that these are important concepts to learn early, o gain a good understanding of a powerful API. I do still think that these would be likely to intimidate a genuine beginner, who just wants to quickly create a map.

The second chapter covers Firebug in depth. While again I was not expecting this so early in the book, I can understand why it is introduced at this stage. It is easy to make typos when writing JavaScript, and a working knowledge of Firebug stops painful debugging that might be necessary for someone just starting out with JavaScript development. But it is possible to use OpenLayers and dip into its rich API without knowing about Firebug, and such detail might serve to intimidate a novice, who would get buried in the detail – hence why I was surprised to see this inclusion so early.

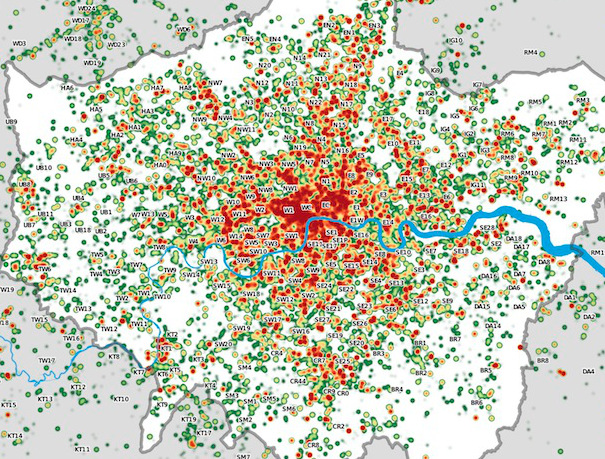
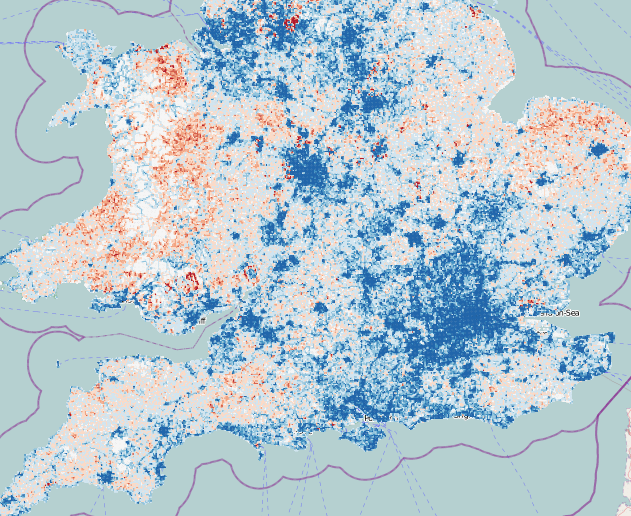
It is interesting that OpenStreetMap (OSM) was not introduced until a third of the way into the book. Before, complex concepts such as map projections and coordinate transforms are used. You really don’t need to know these to use OpenStreetMap! OpenLayers is of course used for so much more than just showing OSM maps – at a recent academic conference I was impressed by the number of speakers that showed complex web applications using OpenLayers. But the “simple case” for OpenLayers is pulling in Google Maps or OpenStreetMap map tiles, and putting pins on them – “mashing up” data, without worrying about projections, ESPG numbers, JavaScript debugging and WMS parameters – all of which you’ll meet early on in the book. Only on page 124 is a simple mashup (Google + WMS + vector editing) introduced, with a more complex example application dissected in the very final chapter.

The vector layers – which in my opinion are the most interesting and powerful part of OpenLayers are introduced all the way back in chapter 9. Vector styling – advanced but powerful – is in the chapter after that. There are many complex method calls for vector layers, and so many of these do deserve to be introduced only late on – but introducing a subset of vector capabilities much earlier in the book would have been of benefit.

There are several typos and minor misspellings in the book, including in a couple of code examples, detracted slightly from the clarity of the book.

The OpenLayers 2.10 Beginners Guide is fantastic as a reference – it goes into great detail and is so very useful for advanced users of the OpenLayers API. But it forsakes smoothing the OpenLayers learning curve in favour of a solid ground-working of the detail – great if this is your career, not so great if you just want to download OpenLayers and create a simple map. If you are prepared to spend the time with the detail, then you will emerge an OpenLayers expert!

The book’s accompanying website includes Chapter 9 as a sample. You can also buy the book – OpenLayers 2.10 Beginner’s Guide – from Amazon.

Categories
Bike Share Data Graphics London

CASA on TV

Pleased that a feature on spatial data visualisation at UCL CASA has appeared as a video on the BBC News website today. It includes some work I did with Martin Austwick on animating the bike share in London – I did the routing, he did the amazing animation in Processing. It also includes visualisation of bus journeys, Oyster card taps and tweet stats for cities around the world.

Categories
Bike Share

Brussels – Villo and the Open Data Challenge

I was pleased to be invited to Brussels last week to pick up a prize for my Bike Share Map. It won the visualisation stream of the Open Data Challenge, which was organised by the Open Knowledge Foundation.

The presentation took place as part of the European Commission’s Digital Agenda Assembly event, and I was presented with a certificate by EC Vice President Neelie Kroes. You can briefly see me bumbling around the huge stage here (at around 2:40). What the video doesn’t show is the four prizewinners in each category had a minute each to say a few words about their project. It was somewhat unnerving giving unscripted remarks to an audience of over 1000 people plus a live web-stream, and having those remarks simultaneously translated into French and German, signed by an on-stage interpreter, and subtitled on the huge screens. (Photo: OKFN)

I also attended the Open Data workshop which took place before the plenary and prize-giving. There were a number of short, interesting talks here – including a presentation from Rennes in France – who have a very well developed API for accessing their public transport data including Bike Share, and an introduction to the Open Cities project. You can download both presentations from the link above.

I took the opportunity, the following morning, to use a Villo bike share bike, to head from my hotel back to the Eurostar at Brussels Midi station. The route looked straightforward on the map – basically down a long, straight street with a dedicated, paved cycle path on the pavement, and then a bit of weaving through the centre of town. What I didn’t anticipate was the large roundabout right by my starting station. I did just about manage it, and think I completed the 5km journey in just less than the half-hour free time. Having seven gears (rather than three in London) was useful for building up a decent speed, and the front basket was useful for carrying my coat and luggage. The process was pretty painless – I just used my credit card – and the big docking station at the end was very visible and had a couple of free spaces. In short – the scheme worked well and I was pleased to be able to do part of my journey back using bike share.

So, pleased to have had the Bike Share Map recognised in this way – even Boris heard about it! I’m planning on adding some more cities soon – European and otherwise – to the 30+ already on the map. While not all the feeds I’m using are probably genuinely “open”, things are hopefully starting to move in that direction. In time, hopefully all cities will come to recognise the value of including bike share and other public transport data as part of their open data platforms.

Categories
Bike Share

An Uphill Struggle for Open Transport Data in Europe

We don't have these in Holland

Today, Europe’s latest bike share scheme, Antwerp’s A-Velo launches. With roughly 80 stations and 1000 bikes, it’s quite an impressive scheme. It follows Ljubljana’s own launch last month.

Sadly it won’t appearing on my Bike Share Map anytime soon. It appears the scheme operator may have, possibly deliberately, slowed down the speed of access to the data on how empty or full each cycle dock is – making life difficult for mobile apps which would help users quickly find their nearest bikes, or free docking points. For bike shares to be a success, such apps are crucial – without them, it can be a bit of a lottery finding stands at certain times of the day. It also makes it difficult for me to access the same data, for my at-a-glance map.

You’ll notice, if you click on a stand on the Google Map of the scheme, there is a characteristic delay, of either 7.5 or 12.5 seconds, while the popup says “opladen…” – before the numbers appear.

You can see the delay visually by looking at the data coming in with your web browser’s developer tools (built into Chrome/Safari, or use Firebug in Firefox.) mHere’s what it looks like for Antwerp, as I clicked on a number of the docking stations on the map in turn:

The times it took to receive the data files – 7.5 or 12.5 seconds – are too similar for it to be due to the server being overloaded, or random delays through the web. It does looks like there may have been a decision to delay the service – perhaps with the best of intentions of ensuring a single client can’t overwhelm the server. Still, it’s a pity.

Spain announced its forthcoming Open Data Store today – but when raolbaletco enquired to the regional government about opening the data for the Valencia bike share scheme, the response was just “ask [scheme operator]”. A similar response was forthcoming for Paris’s bike share scheme – even though there is an Open Data Store for the city, and the bike share data would surely be a find candidate for inclusion in the store. And Ljubljana’s bike share scheme’s website has draconian terms and conditions associated with it which sound far too scary for me to use.

If I were to speculate for a moment, it would appear that some operators may be realising there is potentially a commercial value in the data – maybe in controlling that data, they can ensure it is only viewed within the context of an official app, be it chargeable, served with ads, or available as an exclusive value-added benefit to annual members. There’s nothing wrong with this – after all, like most public transport, its very difficult for bike share schemes to be commercially viable on their own – if you don’t quantify the social, environmental and touristic benefit they bring to a city. Any extra potential revenue is important. But it’s a shame – my map could have been so much more interesting.

North America seems to have the right idea – the data is free and easy to access for almost all the schemes across the US and Canada. In Washington DC they even publish the bike breakdown rates and reasons. And there is one good piece of news from Europe. London has, earlier this week, released the official feed – and API documentation for their own, hugely popular, bike share – Barclays Cycle Hire. It appears both on the transport authority’s website and in the city’s open data catalogue. While it is not perfect – you still need to sign up to see the data, and I’m still waiting on my approval – it is encouraging that my home city is, unlike most places on the continent, going in the right direction.

Shoreditch Park. Empty Boris Bike racks. N1

Categories
Olympic Park

Inside the Olympic Park – Update

I’ve been on another bus tour of the Olympic Park – I last went on one in May last year.

Everything seems nearly complete now, and there’s a lot of landscaping going on. This year’s tour was much faster – under 40 minutes – and disappointingly we didn’t get to go up close to the Velodrome this year, but we did get close to the Aquatic Centre, which is currently getting its sides “filled in”.

New to the tour this year were a trip through the Athlete’s Village, with its many apartment blocks all designed slightly differently but yet looking the same, and to outside the new Stratford International DLR station which is due to open along with Westfield Stratford City in September. A newly tarmac-ed section of road at the north end of the park, with new security cameras, indicated a section of the Northern Retail Lifeline that will open along with Westfield, soon.

As to the stadium itself – well, you actually get a better view now from the elevated Greenway’s viewpoints, than from the bus. There also no sign of the stadium’s wrap being extended.

Here’s the photos:

Categories
Bike Share Conferences

Wherecamp and Bikes in Berlin

I was in Berlin last weekend for Wherecamp EU – the European neogeo unconference, which was previously in London. The unconference took place in the pleasant campus of a language school in the north-east of the city. As well as the session rooms, there was an outdoor area for snacking – with giant salted pretzels! – and informal discussions. A wide range of spatial developers and technologists were present, from the UK, Germany and around Europe, although all sessions were in English.

There were some very interesting sessions – I particularly enjoyed Chris Osborne‘s closing talk showcasing the latest ITO visualisations of travel, including a “coloured lasers” animation of John McKerrell‘s movements over several years, and Peter Batty‘s look behind the work of his company – Ubisense – indoor navigation, including tracking cows!

My own presentation was a summary of CASA‘s current research, with a focus on some of our recent visualisations, particularly of transport and social network data. I also touched on my bike share work. Steve, my co-worker who was also at the conference, presented in more depth on visualising georeferenced social network data, such as Twitter and Foursquare, and also mentioned GEMMA, the JISC project that we are both working on at the moment. We’ll be going into GEMMA in more depth at State of the Map EU, in Vienna next month.

I also took the time to have a look at the bike share scheme in the city, which is called Call-a-Bike:

It has been around for a few years, as a fully distributed system, where users, on finding a locked bike anywhere in the city, call a number on the bike to receive an unlock code, then do their journey and leave it locked. Last week, it relaunched as a dock-based system, with bikes grouped at docking stations, and terminal screens:

Interestingly the bike docks are just concrete blocks with simple holding gates – so the bike itself knows if its locked (and presumably via RFID in the dock where it is) rather than the data being transmitted through the dock itself. There is also no power attached to the stands. In London, the information presumably gets passed through the docks to the terminal which then broadcasts it to the scheme operation system – and the dock recharges the lights on the bike [Update – the lights are charged by dynamo]. In Berlin, each bike itself does the broadcasting, and the bikes have a long-life battery. Having the simple, unfixed concrete blocks allows docks to expand much more easily. In London, it’s a big deal to get the planning permission, install the underground connectivity in the pavement and hatches for the docks, and finally put the docks in themselves.

I was excited to see that the terminal screens have maps showing the empty/full status of the surrounding docking stations. The terminal screen maps appear to be using a custom map, similar to Google Maps, as their background, with the statuses superimposed on top:

Interestingly, the empty/full information displayed on these screens is not available on the scheme’s public website, so I have not been able so far to include it in my bike share map which now covers 32 (non-German) cities. I would love to know the source of the data for the maps in the terminals…

The map in the terminal has some obvious flaws, such as if you zoom out:

The scheme is quite expensive – 15 EUR for a 24 hour hire (compared to £1 in London) and, like London, you get charged additionally for journeys that last longer than 30 minutes. There is also a pay-per-minute option of 8 cents per minute, which works out quite well for shorter journeys but is still quite an expensive option (half an hour would be 3 EUR). [Update – I got this slightly wrong – it’s 12 EUR to register, which gives you 7.50 EUR of credits, then it’s 8 cents per minute up to a ceiling of 15 EUR for 24 hours. Still quite a lot more than London’s pricing.] The scheme has only just been relaunched, but I noticed only one person using a bike share bike in the several hours I spent wandering about the area, whereas in London you can’t move for Boris Bikes in certain areas…

The bikes themselves seem to be in good condition, and have a generous area for stowing bags, on the back. I hope the scheme does continue to grow.

This was what I found most upsetting about the trip, as a London cyclist:

Notice the dedicated cycleway, which is using coloured bricks (rather than paint), is raised to the level of the pavement, and has priority over side-streets that it crosses. But the thing which made me wish I was a Berlin cyclist and not a London cyclist, was the deliveryman. Notice how he is carefully unloading the boxes from the lorry and stacking them up on the narrow space between the road and the cycleway. If this was London, the lorry would first be parked across the cycleway, or failing that the boxes would be piled up on the cycleway. Non-cyclists in London just don’t respect cycle facilities.

Anyway I enjoyed my Berlin trip, it was a good unconference, both interesting and informal, and I look forward to future Wherecamps!

Categories
Orienteering

Summer Plans 2011

I’m now fixed, finally, after my fall in Sicily, and back to running again. My first event since recovering was the Bushy Park Trail Challenge that SLOW, my orienteering club, organises every year. It’s roughly a 10K run. I didn’t feel particularly fast out there – although I did sprint for the line at the end. My quads were screaming for about two days afterwards – to the point that I was holding onto bannisters walking down stairs. It’s amazing what a couple of months off does to your fitness – I was still cycling every day so thought I had a good base fitness, but I guess not.

Anyway, this summer is looking like:

  • London Park Race series. Generally Tuesday evenings in June and Thursday evenings in July. I’m doing the website again so will be quite involved, although I think I’ve managed to offload the publicity this year. The Park Race events are generally quite short (5K) and finish in a pub, which is good.
  • parkrun. I’ve done 47 of these over the last four years, and really want to do three more soon, to get a highly coveted (and very red) parkrun 50 technical shirt. As seems to happen often in the summer, it’s going to be a while before I can run those three Saturday 9am 5Ks – 2 July, 9 July (slowly) and 13 August are the next three free days.
  • Ripon and York urban double – 29/30 May.
  • Nottingham urban race – 5 June
  • Lossie/Culbin double weekend – 11/12 June. A long way to travel but should be great.
  • Great Wilderness munroing – 13-16 June. Might as well as I’m up there.
  • North Downs Way Relay – 25 June. Don’t think I’ll be fit enough to break the record for the leg I’m on – this year at least.
  • Saxons Trail Challenge Half Marathon – 10 July. Knole Park near Sevenoaks, and along to the east. Should be lovely.
  • Scottish 6 Days – 31 July – 6 August. Really looking forward to this, I have ambitiously entered elite, so really need to step up my training.
Categories
London

Tweets in London

From the Mapping London blog:

Many Twitter messages, or “tweets”, are sent with latitude/longitude information, allowing an insight into the places where the most amount of tweeting happens. For a magazine article, I produced the above map of London, with help from a colleague Steven Gray, who collected the data across several weeks using some technologies he has developed. It is a heatmap of sorts, with particular locations where the level of tweets are very high. The data is collected in a 30km radius around central London.

London’s city centre stands out, as would be expected, as well as a distinctive streak of tweets heading directly north – an arm of London where the typical Twitter demographic – young and connected – makes up a particularly high proportion of people living there. Other features – such as along a road in the North West that suffered severe roadworks during the collection period, the A13/Eurostar travel line running along estuarine Essex, and the runways of Heathrow Airport, also appear. It’s also interesting to see how large parts of surburban London are “empty” of tweets.

Further detail on Steven’s Big Data Toolkit blog.

The map contains data which is CC-By-SA OpenStreetMap and contributors (the River Thames) and which is Crown Copyright Ordnance Survey (OpenData) 2011.

Categories
Data Graphics OpenStreetMap

A Historical Comparison of OpenStreetMap’s Completeness in Britain

Dr Muki Haklay, UCL CEGE, has been carrying out some quantitative research into OpenStreetMap’s coverage in the UK, comparing road lengths in each square kilometre, with those in a definitive national dataset, Ordnance Survey Meridian 2. He’s updated his findings every few months, from March 2008 until March this year. Some interesting research findings have been found, such as a potential correlation between an area’s affluence and the map’s completeness, a possible reflection of a contributor demographic. On his suggestion I’ve taken his dataset and overlaid the red/blue under/overcompleteness maps on OpenStreetMap (or Ordnance Survey StreetView) itself, allowing the specific towns and villages that are missing the OSM love, to be identified.

The mashup can be viewed here [no longer online].

These days, OpenStreetMap’s coverage is pretty good -often exceeding Meridian’s, as service roads, private roads and alleys, that don’t exist on Meridian 2 are added in. There’s still (as of March 2011) some significant holes though, particularly in parts of Wales, the North East and East Anglia.

Note the first four maps only cover England. There is an interesting artefact in the first one – a square around London can clearly be seen, corresponding to the extent of aerial imagery, in that area, that was available via a special agreement with Yahoo for tracing. Outside of that area, only 50-year-old (out of copyright) maps and contributor GPS traces were available. Since May last year, the Ordnance Survey OpenData release, and Microsoft Bing Aerial imagery, which became available at roughly the same time, has significantly accelerated work on the map. I presented on the diverse sources of data at the Society of Cartographers annual conference last year, you can see the slides here.

ITO World’s OS Locator is just one of a number of tools that the OpenStreetMap contributor community in the UK is using to “complete” the map, moving towards the goal of a comprehensive free database of the UK’s (and world’s) streets.

Categories
Technical

Notes on a Migration with Images from Blogger to WordPress

I’ve recently reported a very large blog from Blogger to WordPress. The blog has been around for many years, with around a thousand posts – most of which contain at least one image embedded in.

The WordPress theme to be used was a gallery-style one (Arras) which displays the post image thumbnails properly, so there was a requirement to have these included in the import. However it is trickier than you might think to get these in from Blogger on a bulk-import basis. Individually associating all the images is not an option due the number of posts. I’ve not used a solution requiring programming, but writing a Python script to do this would be pretty straightforward. Instead I’ve used Excel to extract the URLs and build up SQL queries with the URLs in them, to insert into WordPress. These notes will hopefully prove useful to someone trying to do the same thing.

Assumptions (a lot of these can be worked around if you have the know-how): You have Excel, EditPad (a text editor), a WordPress.org 3.1.X install which allows you to install arbitrary plugins (i.e. if using WordPress Multisite, you are a super-admin), and that you can access the MySQL database backing your blog using phpMyAdmin.

1. Install the Blogger Import plugin in WordPress and use it to import your blog in.

The result should be a successfully imported blog. When viewing a post, the images even appear. However – these are just links to images on the Blogger server. The images themselves haven’t been pulled across.

2. Install the Hot Linked Image Cacher (HLIC) plugin and use it to pull in local copies of your images.

Now the images are locally stored, and linked to locally in the content of your posts – the plugin updates the URLs as well as copying the images across. However, the images are still not formally associated with the posts that link to them.

3. Use phpMyAdmin to export just the ID and post_content columns of the wp_posts table to a CSV file. Use the suppress CR/LF option and the pipe “|” delimiter.

4. Open the CSV file in EditPad (not Excel – as Excel will automatically assume that the commas in your posts are the field delimiters.) and change all commas in the document to spaces.

5. Copy the contents and paste them into a blank Excel document. Use the Text-to-Columns Import wizard to import in the data with the pipe delimiter.

6. Extract the (first) image URL from the post_content column. You can do this by adding another column and using a formula like this:

=MID($B823,FIND("HLIC/", $B823),41)

It’s OK to use 41 characters because the HLIC plugin always saves images with names this long.

7. Use a Filter (AutoFilter) to remove rows for which there is no image URL.

8. You need to create SQL statements, two for each image, structuring them using Excel columns. Post-associated images are considered by WordPress to be themselves posts, with a parent ID referencing the corresponding post ID – and the images also have entries in the post metadata table. Here’s two examples of the two statements you need for each image, I’ve used IDs from the 7xxxxx and 8xxxxx ranges on the assumption there are no existing posts with IDs this high.

insert into wp_posts values( 700002 ,1,NOW(),NOW(),"","","","inherit","open","open","","","","",NOW(),NOW(),"", 1654 ,"/wp-content/uploads/ HLIC/2af1d48d3251d953b106a0bbf8f2f810.jpg ", 0,"attachment", "image/jpeg", 0); insert into wp_postmeta values( 800002 , 700002 ,
"_wp_attached_file", "HLIC/2af1d48d3251d953b106a0bbf8f2f810.jpg ");

insert into wp_posts values( 700003
,1,NOW(),NOW(),"","","","inherit","open","open","","","","",NOW(),NOW(),"", 1683 ,"/wp-content/uploads/ HLIC/dd376f1a86ba3e833e866e7f03127712.jpg ", 0,"attachment", "image/jpeg", 0); insert into wp_postmeta values( 800003 , 700003 , "_wp_attached_file", "HLIC/dd376f1a86ba3e833e866e7f03127712.jpg ");

Elements in red are from the original database export. Elements in blue are sequential numbers.

I’ve assumed all the images are JPEGs – you’ll need to change the “image/jpeg” part of the SQL statement if this is not the case.

If using WordPress Multisite, you’ll need to use the appropriate wp_NN_ table prefix and also set the author number (1 above) appropriately.

9. Paste the statements into EditPad, remove all tabs, and then paste all the statements into phpMyAdmin and execute.

10. Finally you need to build in the attributes for each image, before they are seen. You can do this with another plugin called Regenerate Thumbnails. Note that this plugin depends on the URL that was specified in the post metadata table.

Manual tidying will still be needed – particularly for embedded YouTube videos and other content.

One more gotcha with the import was that the Blogger post tags were coming in as categories. As there were several hundred of these, that wasn’t very practical. So I ran the following bit of SQL to change them to be WordPress tags:

UPDATE wp_term_taxonomy SET taxonomy = replace(taxonomy,"category","post_tag")