Recently published on CDRC Maps is a new a map of Broadband Speed in the UK. This is the average download speed for premises, right across the UK. It’s based on data annually released by the national regulator, OFCOM (I’m using the most recent dataset, from 2016). I’m using a Purple-White-Green colour ramp, where purples indicate areas with very slow speeds, white tends towards the national median and dark greens show areas of very fast connection – potentially homes using the new “ultrafast” connections available in some areas.
It should be noted that this is based on the actual average download speed based on the deal people have signed up for, not the maximum attainable download speed (either theoretical or actual) in an area. I hypothesise below that, in cities, this may be due to consumer inertia as much as infrastructure gaps – while in rural areas it is more likely the latter. I’m not mapping broadband through high-speed mobile networks, only “fixed line”.
Urban/rural divide
As would be expected with infrastructure costs, the economics of putting in fibre connections, and increased distances to the nearest telephone exchanges, broadband speeds still suffer in the countryside, with the Llandrindod Wells (LD) postal area in rural central Wales, having the slowest average broadband connection of 14.9Mbit/s. Looking at specific postal outcodes, PA70, on the also extremely rural island of Mull in western Scotland, has an average speed of just 1.1Mbit/s.
Why do city centres show up as slow?
Of note, as well as this urban/rural divide, the very centre of cities often show slower speeds than the suburbs. This is possibly because of the difficulty of installing the needed infrastructure under narrow, busy streets and through old, often historic buildings. By contrast, newer housing developments, normally on the edge of cities may come with broadband infra designed in to the plans. The fastest postal region is OX, the Oxford postal area, perhaps reflecting the large technologically literate population (thanks to the universities and various science parks in the area). The fastest postal outcode in the country, however, is N1C, the new area behind King’s Cross. This is a central city area, but one which has essentially been built from scratch in the last few years, rather than needing broadband retrofitted into it. Another new area however, E20 (the Olympic Park) appears in the London bottom 10.
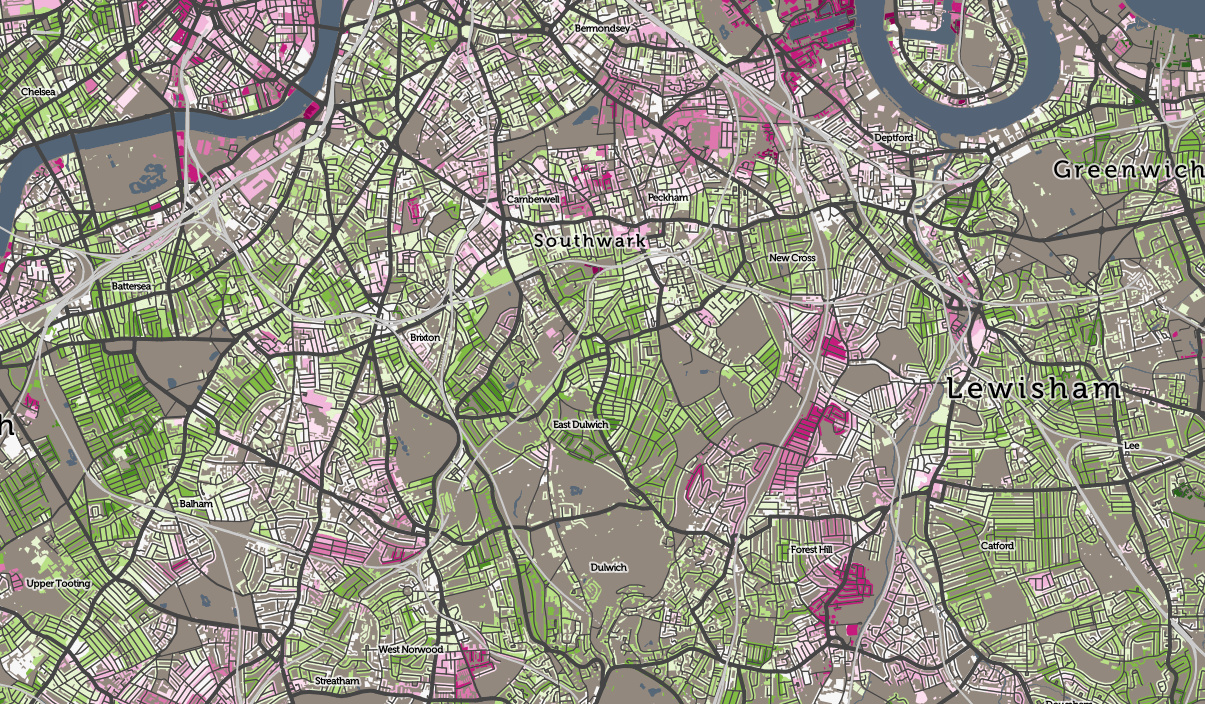
An alternative argument is that it may be that city centres got the “first wave” of broadband capabilities, many years ago, and people switched then – and consumer inertia means that they are less likely to switch to faster broadband offerings that are now available to them. In central London, the Rotherhithe area shows up as having particularly slow broadband speeds being used. This area is quite distinct to just about every other central London area, having become a residential area in the 1980s and 1990s. It is also rather isolated geographically. However, the lowest speeds of all in London are found, rather surprisingly, in and around the City of London. For example, the Barbican Estate has few keen users of ultra-fast broadband. It may be available to them, but the elderly population here may just not want it.
A short note on methodology: This is an area average (by output area – 150 properties) of postcode averages of individual connections. I’ve excluded postcodes with no broadband connections, as these are still recorded in the source data but with a speed of 0. By using OAs rather than individual postcodes, the data is slightly smoothed, i.e. less noisy, so trends can be seen easily across areas, even though individual properties (or indeed whole postcodes) may be connecting at a faster speed than what appears in the map in that place. In short – the map is of the overall picture, not individual addresses.
You can download the data, and see the Top/bottom 10 postal area stats, on the CDRC Data page for the dataset, or explore the data on the interactive map.
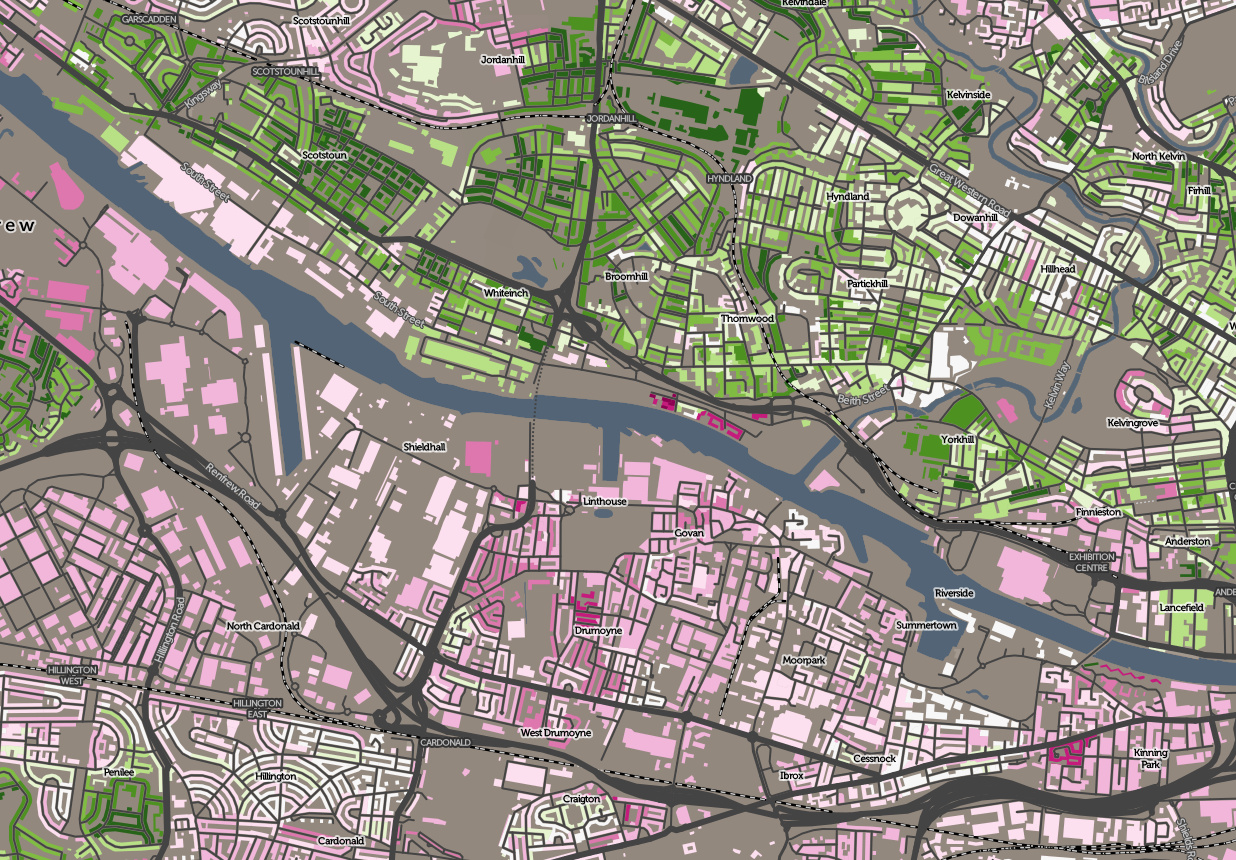
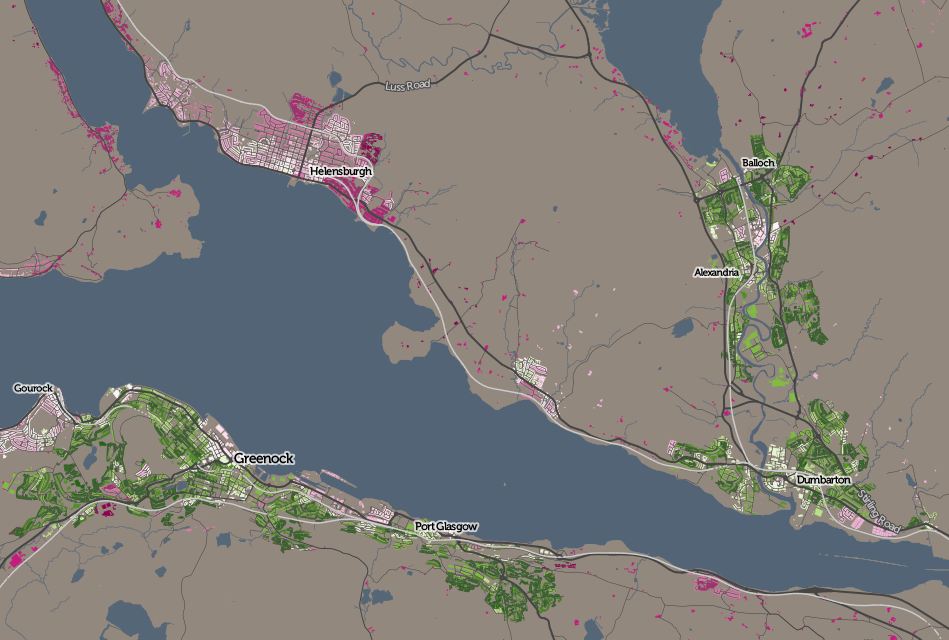
Top: A river divides them – broadband average download speed in west Glasgow. Above: Towns north and south of the Firth of Clyde. Below: Variations in south London. All maps based on data which is Crown Copyright OS and OFCOM.