Many of my visualisations have focused on London – there is an advantage of being in the city and surrounded by the data, which means that London is often the “default” city that I map. However, I’ve created a couple of Manchester versions of my popular maps Ward Words and Ward Work. Logistics and time reasons mean that I present these as images rather than interactive websites, although I used the existing London-centric website as a platform to work with the Manchester data. A bonus is that, by presenting these as images, I can use LSOAs which are more detailed than wards – there are too many of them for my interactive version to be very useable but they work well within a standalone graphic.
I’m only showing the top* result, and the way the categories are grouped can therefore significantly influence what is shown. For example, if I grouped certain categories together, even ones which don’t appear on the map itself, then the grouped category would likely appear in many places because it would more likely be the top result. It would therefore easy to produce a version of this graphic that showed a very different emphasis. (*Strictly, second-top for the languages.)
The maps were created using open, aggregated data (QS204EW and QS606EW) from the ONS which is under the Open Government Licence, and the background map is from HERE maps. Enjoy!
1. Languages second-most commonly spoken in each LSOA in the Greater Manchester area (click for a larger version):
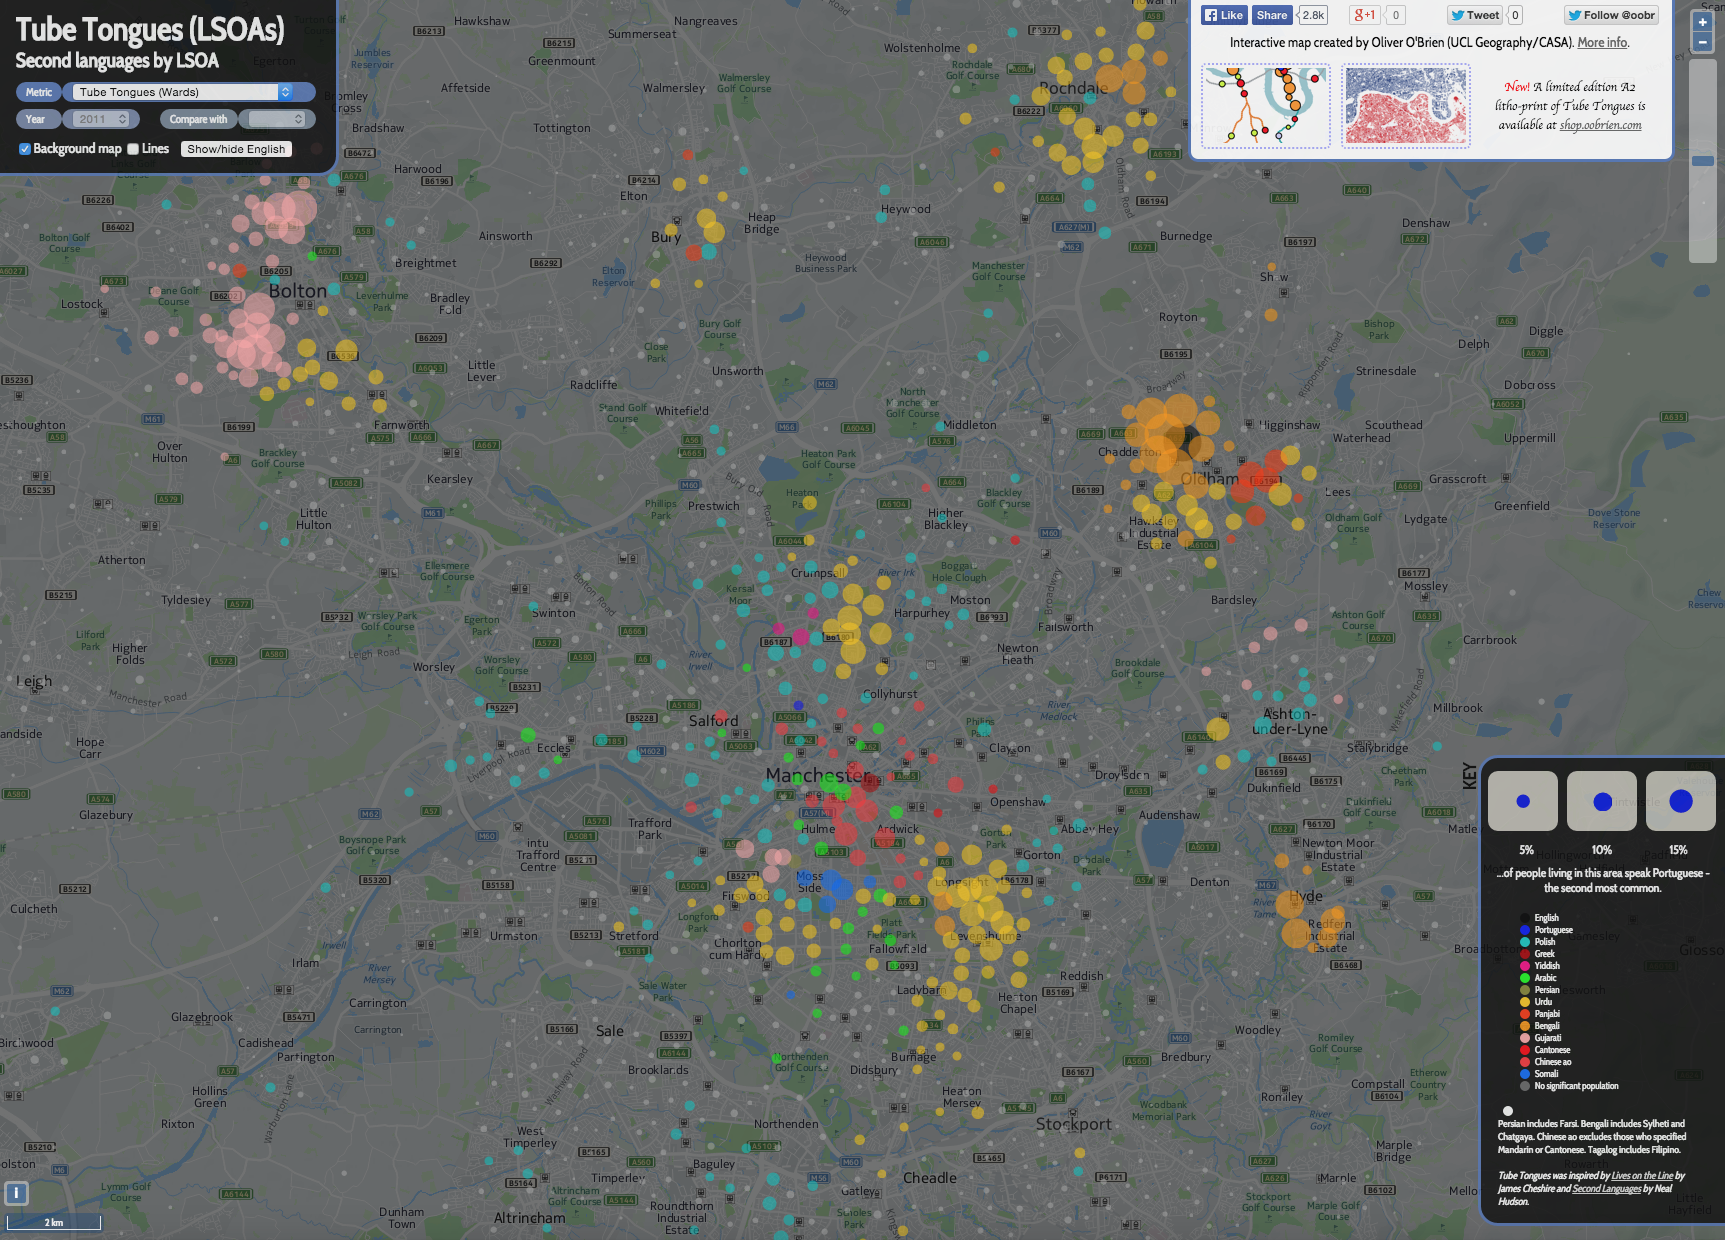 N.B. Where the second language is spoken by less than 2% of the population, I simply show it as a grey circle. LSOAs have a typical population of around 1500 so the smallest non-grey circles represent around 30 speakers of that language.
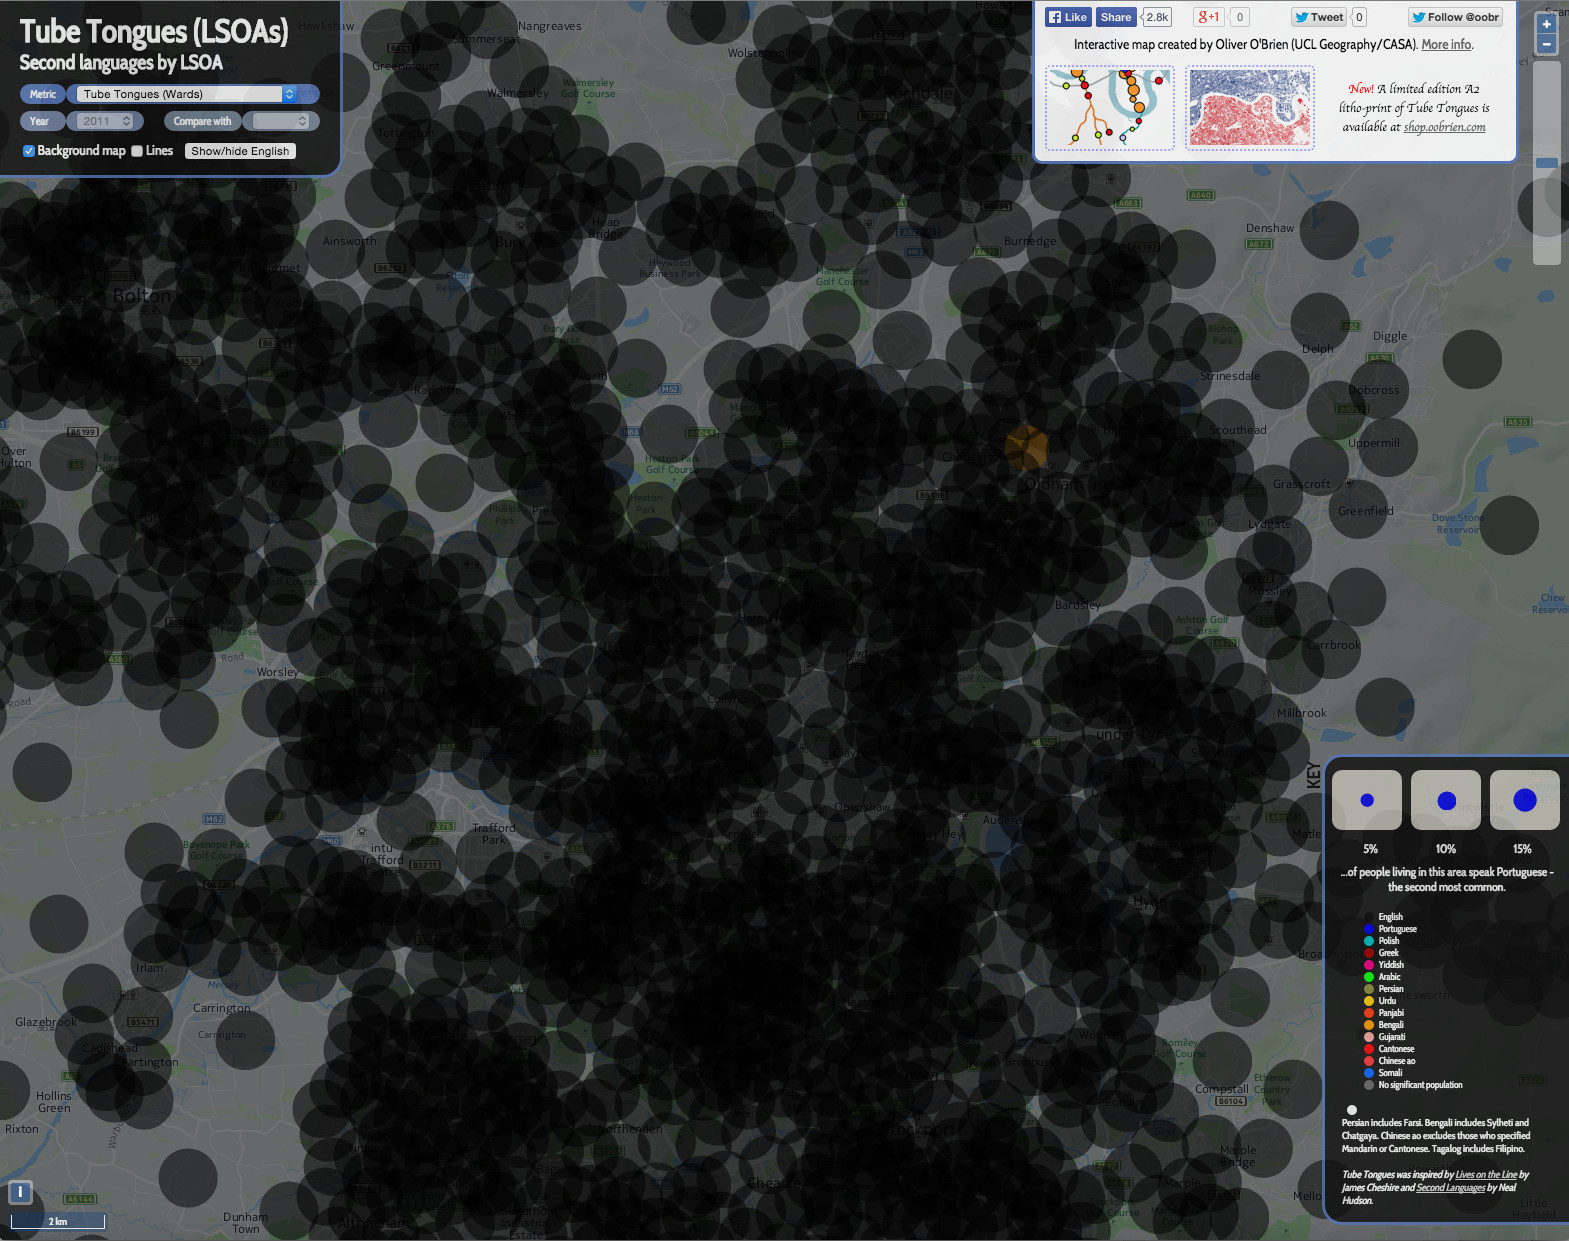
2. It’s important to remember that, except in a single area, English is not represented on the map at all. If you show the primary language (i.e. English) to the same scale, the map looks like this:
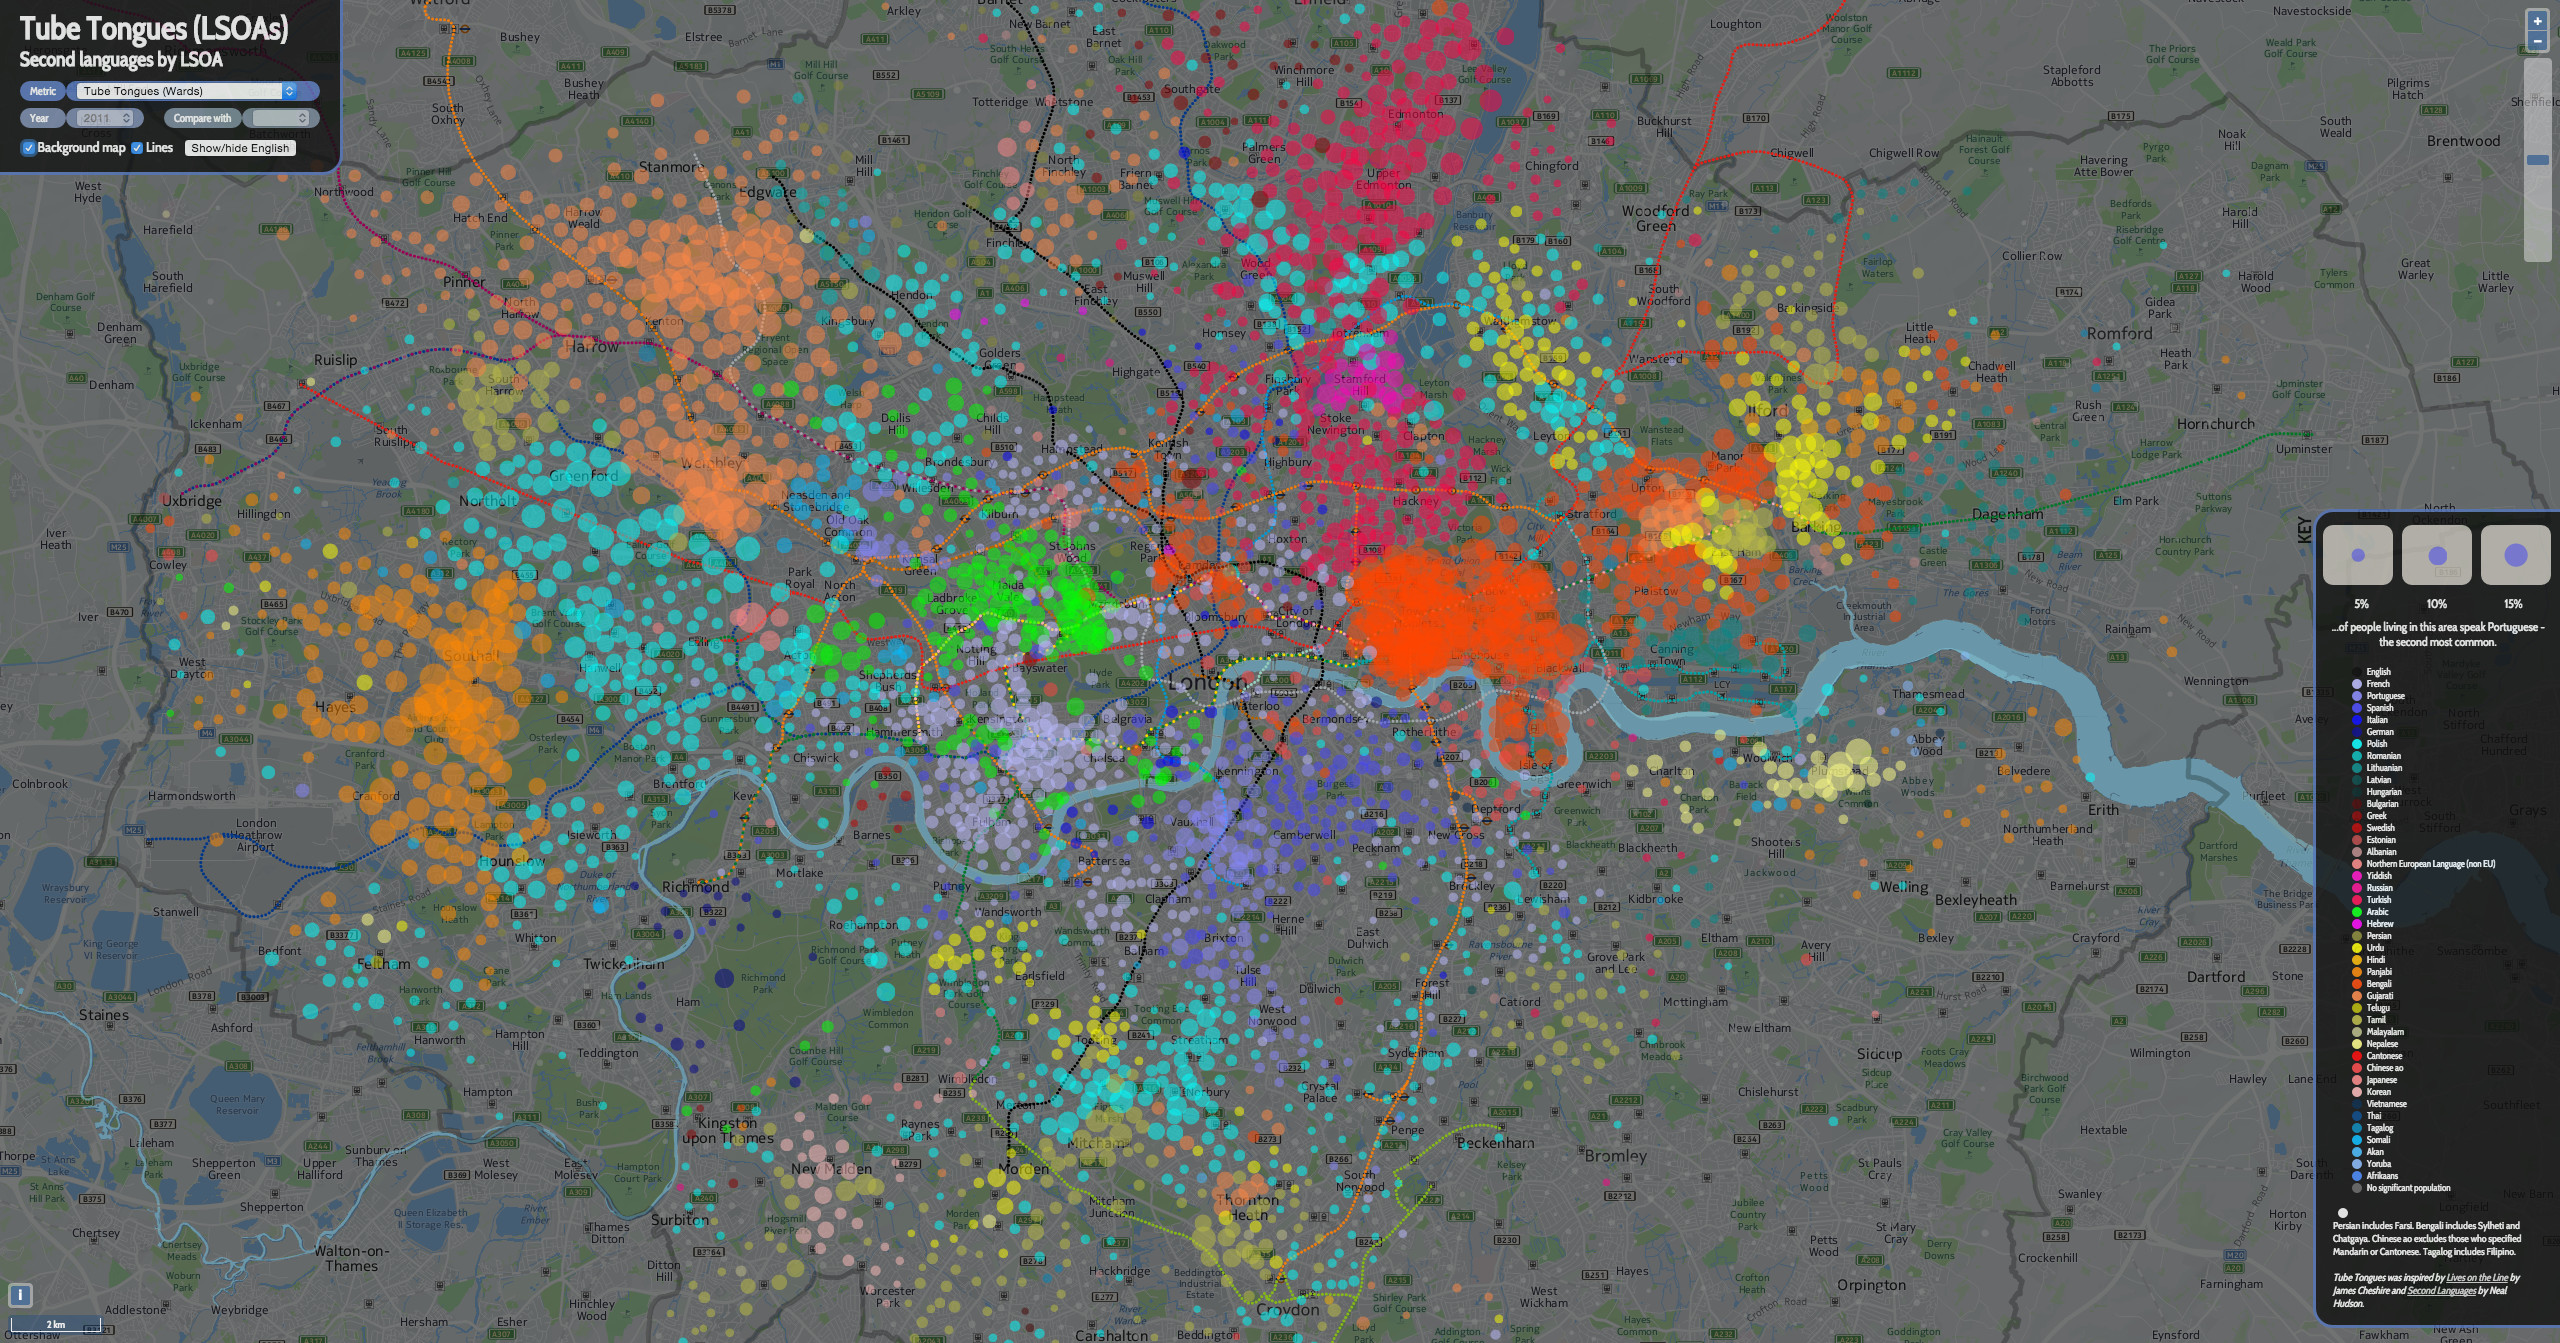
3. Here’s the equivalent of the first map, for (most of) London. Note I’ve changed the key colours here. I appreciate that it is difficult to use the key, as there are so many more languages shown, and the variation between the colours is slight – particularly as they are shown translucently on the map:
4. The most popular occupation by (home) LSOA (again, click for a larger version):
 I’ve used grey here for the “Sales Assistant” occupational group, as this is the dominant occupation in large urban areas.
5. By way of comparison, and at roughly the same scale, here is (all of) London:

My interactive (London only I’m afraid) version is here – change the metric on the top left for other datasets.